v.104 Release: Azure Billing and Custom Graph Widget Improvements
Last updated on 14 September, 2022The v.104 Release will be rolled out to customers through mid-May. Among the changes you will see are an improved Custom Graph Widget, Azure Billing monitoring, as well as an important announcement regarding ConfigSources.
Bottom X View in Custom Graph Widget
In v.102, we added the ability to create a dynamic view of the bottom instance values for a given datapoint in the Table Widget. We have extended this functionality to visualize a datapoint’s bottom 5/10/25/100 instance values on the Custom Graph Widget. This is exceptionally valuable if you would like a real time view of resource-deficient or over-provisioned resources across your environment.
Azure Billing
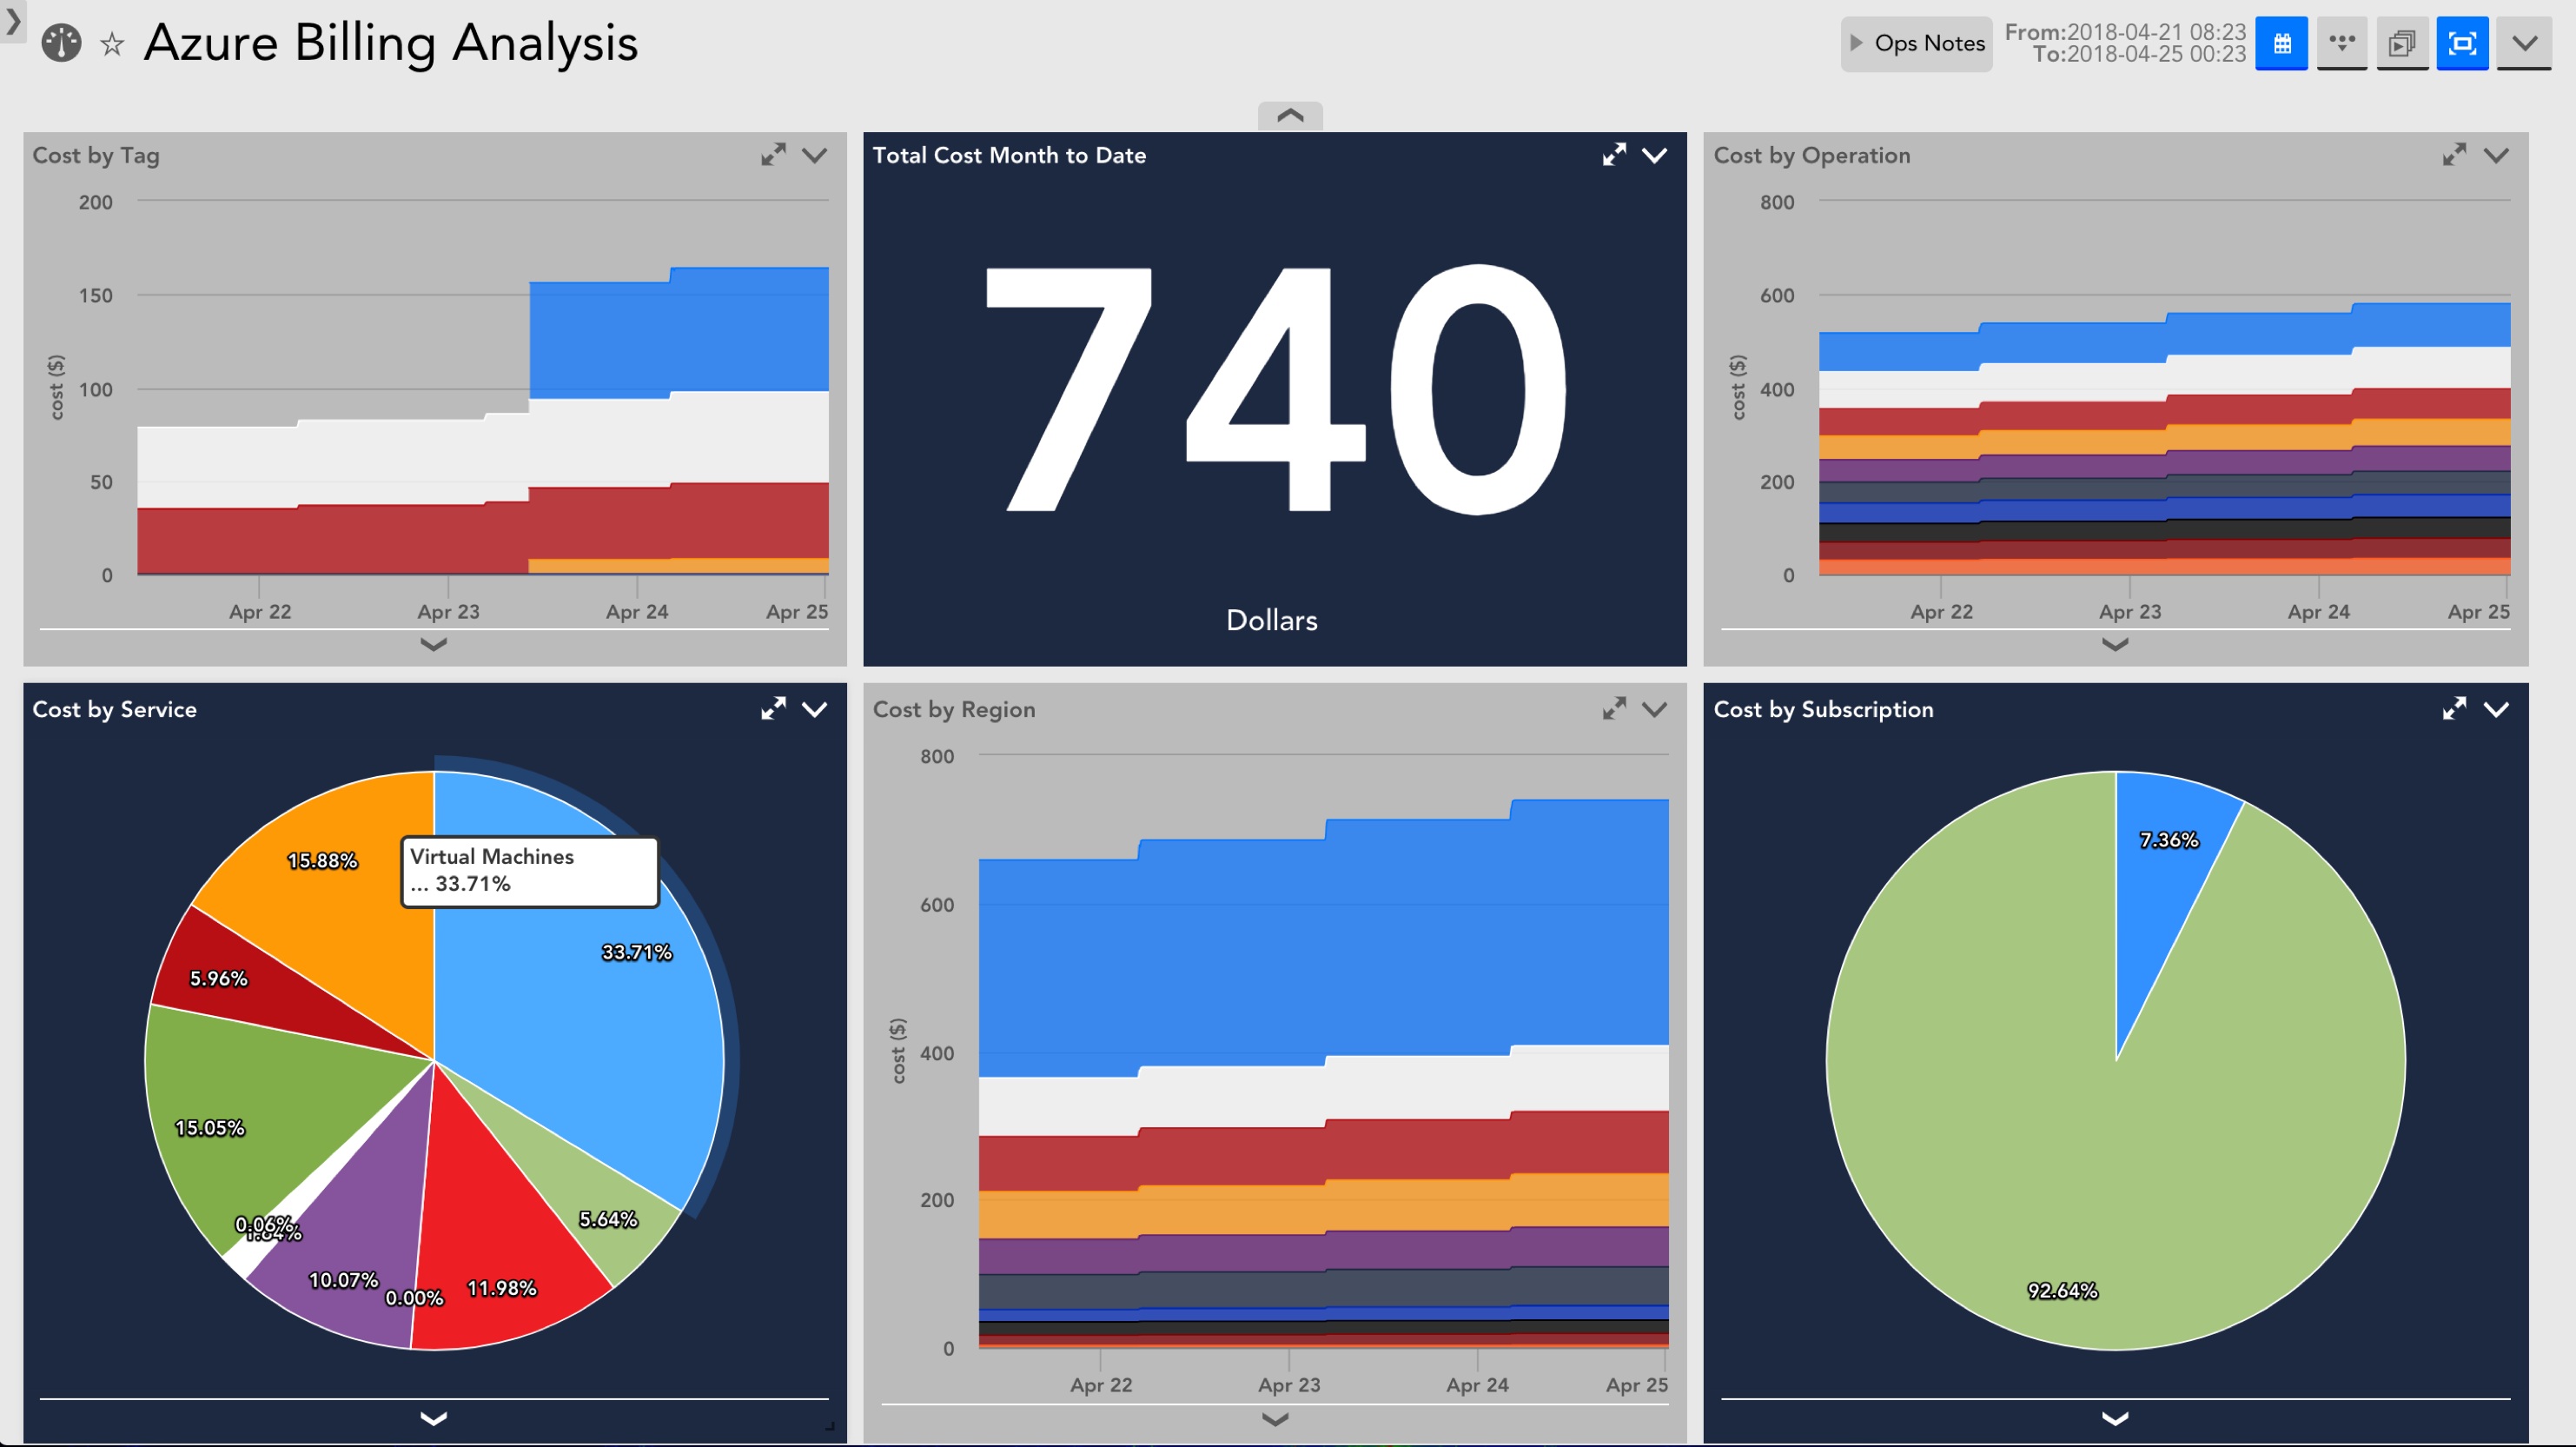
We have added support for monitoring Azure Billing data! You can now monitor, visualize, and alert on Azure spend. Our core suite of DataSources will monitor by Azure service, region, subscription, and operation by default, with the option to also monitor by tag if desired. If you are using Azure, you will find this new functionality useful for keeping track of how your bill is trending month to month, and for identifying ways you can optimize spend in the cloud. You can find more information here.
ConfigSource Updates
We recently made changes to ConfigSources that allow users to control instance lifecycle like they would on a multi-instance DataSource. With this change, we also changed the default behavior on multi-instance ConfigSources to never auto-delete instances, even if they’re inactive. This is done to prevent loss of configuration files in the event that your devices go down for an extended period of time. We strongly recommend you update your ConfigSources to the latest versions (which have the new defaults) to get these updates.
If you’ve created your own ConfigSources, we also recommend double checking their Active Discovery settings to avoid data loss in the future.
If you have any questions, please don’t hesitate to reach out to our Support team.
Other Improvements
Collector
- Users must now have “Manage” rights to use the Debug Console
Dashboards
- Append your dashboard URL with “&fullscreen” to force a dashboard to open in “full screen” mode. This is useful when viewing dashboards in an embedded app
- Added ability to directly edit the source HTML within a Text Widget
Devices
- Custom Time Range values are now displayed on Devices and Websites page
LM Cloud
- Added support for discovery and monitoring of resources in the Azure France Central region
- Our naming convention for API Gateway instances previously made it such that two APIs with the same name couldn’t be monitored. As such, we’ve made an adjustment to include API Gateway group id in the resource name in LogicMonitor to correct for this for all new and existing API Gateway resources
- Added support for monitoring Azure Automation Accounts
- Added support for discovering and monitoring Azure Virtual Network Gateways
- Added support for discovering and monitoring Azure Express Route Circuits
- Added a “Manage Device” option at the DataSource & Instance levels for cloud resources, which is consistent with what options are available at the DataSource & Instance levels for normal devices
REST API
- Published the ability to get instance group overview graphs via our REST API
Bugs Fixed
- Fixed a bug preventing Azure MySQL and PostgreSQL database instance tags from being discovered
- The ‘Name’ tag option in the ‘Rename Discovered Devices’ field for EC2 instances wasn’t always case sensitive. If you had a ‘name’ tag defined, that was used to set the display name instead of the traditional ‘Name’ tag
LogicModule Releases
Below is a list of new and improved LogicModules that were implemented since our last release:
New Monitoring Coverage
- Microsoft Azure AppServicePlan – 1 DataSource
- Microsoft Azure CosmosDB – 1 DataSource
- AWS EC2 EBS – 2 DataSources
- Azure Express Route Circuit – 1 DataSource
- Azure Virtual Network Gateway – 1 DataSource
Monitoring Improvements
- AWS EC2 – 1 DataSource
- Updated AppliesTo to exclude EBS compatible instances which are now monitored by the AWS_EC2_EBS DataSources due to CloudWatch endpoint differences
- Various improvements to datapoint definitions, alert messages
- Multi-Instance ConfigSources
- AD settings changed to never delete instances automatically
- Email Transit Time – 1 Datasource
- Improved accuracy of time measurement
- Added support for custom ports
- More robust handling of sync issues with inbox
- Improved removal of orphaned test messages
- Cisco_IOS ConfigSource
- Improved error handling around the initialization process. If a connection to a device fails, the script will return a failure code to the LM platform rather than the text string “false.”
- Fortinet_FortiOS – 1 ConfigSource
- Added capability to use non-standard port for SSH when “ssh.port” host property is set
- Added regex pattern matching to extract the particular property name logged when it could be either config.* or ssh.*