v.121 Release: Anomaly Detection Visualization
Last updated on 14 September, 2022Rolling out through the end of June, LogicMonitor v.121 brings an exciting new capability: anomaly detection visualization! Other enhancements coming your way with our v.121 release including topology mapping for Kubernetes clusters, new REST API resources, and monitoring for Cisco ACI and Firepower.
Heads up! New deployment windows coming soon
Beginning with release v.122 (slated for early July), we’re moving our new version deployment windows from 6-9 p.m. PT on Tuesdays/Thursdays to 6-9 p.m. PT on Mondays/Wednesdays. During deployment windows, portal interruption is typically less than one minute.
Release Highlight: Anomaly Detection Visualization
LogicMonitor is excited to announce anomaly detection visualization! Adding to our growing suite of AIOps (artificial intelligence for IT operations) capabilities, anomaly detection visualization allows you to visually identify data that does not conform to expected patterns and potentially catch issues before they escalate into more severe events.
Similar to our data forecasting feature, anomaly detection visualization is available from any graph in the LogicMonitor interface. The feature comes with a unique set of tools, including:
- Red highlighting of anomalies
- Expected range overlay
- Alert threshold markers
- Offset periods that allow direct comparison between current data and data from a day, week, and/or month prior
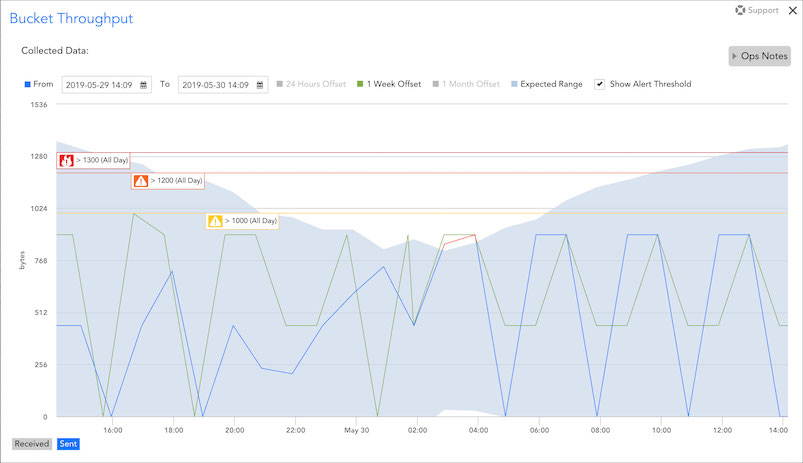
Anomaly detection visualization is available to users of LogicMonitor Enterprise. To learn more about this new AIOps capability, see Anomaly Detection Visualization.
Release Highlight: Topology Mapping for Kubernetes
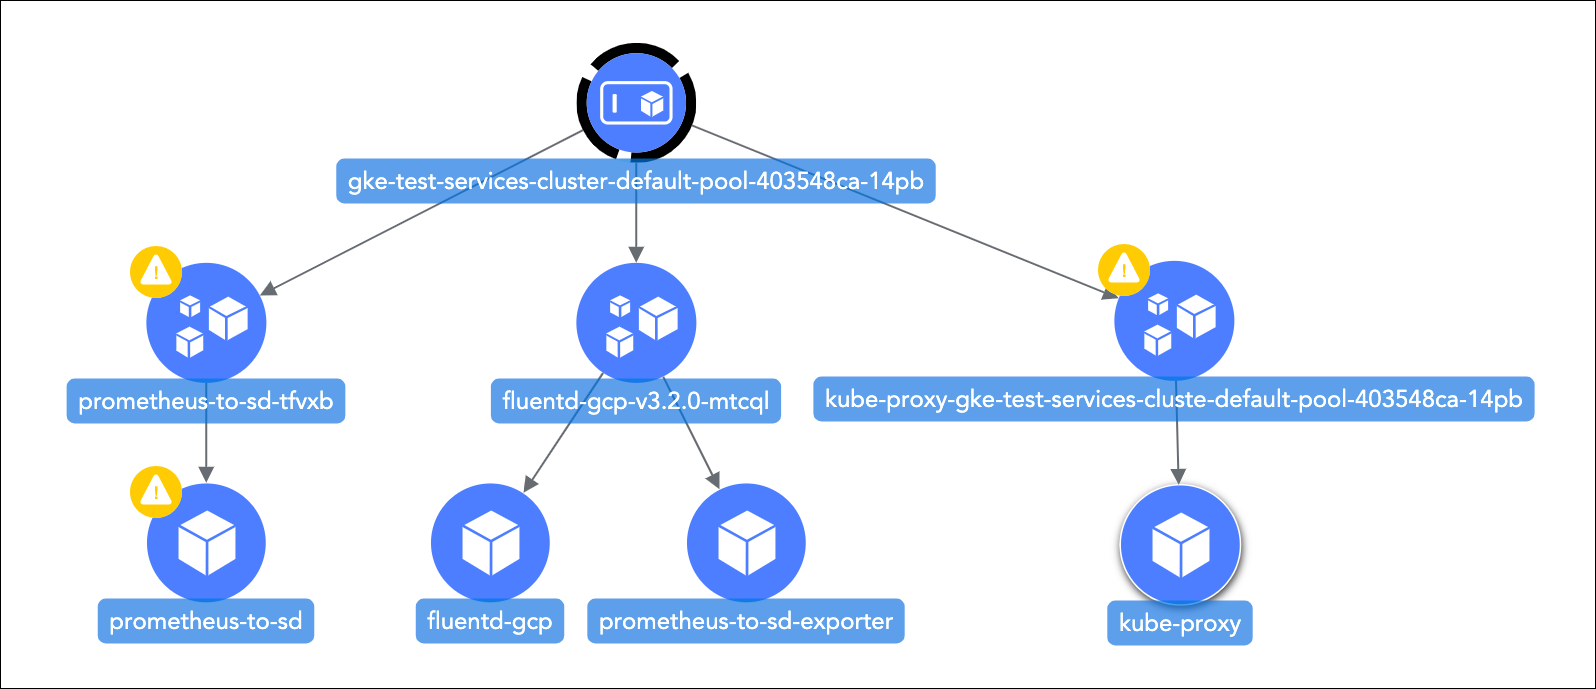 Monitored Kubernetes nodes, pods, containers, and services can now be automatically rendered in LogicMonitor’s topology maps, allowing you to visualize the topology of your dynamic cluster as it changes over time. As discussed in Topology Mapping Overview, you will need to import the new PropertySources and TopologySources dedicated to topology mapping, as well as update the Kubernetes Container DataSource in order to enable auto-mapping of your Kubernetes clusters.
Other v.121 Enhancements
AppliesTo Functions
- Improvement to isWindows(). The isWindows() AppliesTo function now excludes system.sysinfo strings that contain “Hyper-V-VA” to avoid falsely categorizing Pulse Connect Secure virtualization appliances.
Dashboards
- Gauge widget. The Aggregate function field for the Gauge widget is configured to display when multiple resources are selected in the widget’s configurations. However, the field wasn’t correctly recognizing multiple resources if wildcards weren’t present. For example, other methods of indicating multiple, specific resources, such as using pipe separators, weren’t triggering the display of the Aggregate function field. Now, the Aggregate function field will more reliably display when multiple resources are indicated through a variety of expression methods, including pipe separators.
LM Container
- Kubernetes deployments. Added monitoring for Kubernetes deployments. To take advantage of this, you’ll need to update your helm charts and the Argus pod running in your cluster (helm repo update, and then restart the argus pod). This will ensure permissions to discover and monitor the deployments. You may find this new Kubernetes monitoring useful for monitoring unavailable vs. available pods for deployments in your cluster.
- Kubernetes uptime tracking. A new Kubernetes_Uptime DataSource, which monitors the time since a Kubernetes node, pod, service, or deployment was created, is now available. The data collected by this new DataSource will used to populate the Uptime widget that displays by default on the Device View dashboard for Kubernetes nodes, pods, services, and deployments in the next release.
REST API
- Portal usage data. A new resource, /metrics/usage, has been published that returns portal usage statistics such as device count, cloud resource count, service and website counts, etc. You may find this useful for programmatically retrieving information that was previously only collectively available from the Account Information page within LogicMonitor.
- More efficient retrieval of instance data. Published the ability to GET /device/devices/{id}/instances. This new endpoint enables you to retrieve instances without having to specify Device DataSource Id, so you may find it useful for getting instance metadata and/or time series data with fewer API requests.
- NetFlow issue corrected. Size and sort parameters were not returning NetFlow data via our REST API. This has been corrected.
Topology Mapping
- Display of Undiscovered Vertices. Topology maps can now display connections to undiscovered vertices (i.e. network components that have only been identified via topology mapping); previously, only resources currently monitored in LogicMonitor would appear as vertices. Undiscovered vertices, when enabled for mapping, will display with a dedicated icon (
 ) to allow you to easily distinguish between monitored resources and those that have not been added into monitoring. From a map’s settings, you have the ability to toggle on/off the display of undiscovered vertices. You may find this new feature useful for visualizing an environment where not all network components are monitored in LogicMonitor, but have been identified via topology relationships.
 - More meaningful vertex icons. The icons representing vertices have been updated to impart deeper meaning and improve the overall appearance of topology maps. In addition to featuring new imagery, icons are color-coded to provide quick correlation between the vertex and its resource type category (e.g. network resource, storage hardware, compute device, OS, cluster, etc.).
- Clear map canvas. Users can now clear the map canvas when viewing or building topology maps by clicking the new clear icon located in the bottom left of the canvas. Previously, users would have to leave and then reenter the canvas in order to clear it.
User Interface
- New UI coming soon! LogicMonitor will be rolling out a new user interface on a page-by-page basis over the coming months. With each new page deployed to production, there will be a six-week preview period during which the new UI will exist in parallel with the current UI (a toggle will support movement between UI versions). The first page to feature the new UI will be the Alerts page, targeted for production with the release of v.124 (August 2019).
Note: The new UI will not support Microsoft Internet Explorer 11, Microsoft’s final version of the Internet Explorer browser.
LogicModule Releases
LogicModules added or updated since the last release.
New Monitoring Coverage
- AWS Database Migration Services: Replication Instances – 1 DataSource
- AWS WAF Web Access Control List (Web ACL) – 1 DataSource
- Cisco ACI/APIC – 9 DataSources, 1 PropertySource
- Cisco Firepower – 7 DataSources, 1 PropertySource
- Device Basics – 1 PropertySource
- EMC Elastic Cloud Storage (ECS) – 7 DataSources, 2 PropertySources
- Kubernetes Deployments – 1 DataSource
- Kubernetes Topology – 3 PropertySources, 3 TopologySources
- Kubernetes Uptime – 1 DataSource
- LogicMonitor Collector Total CPU and Memory – 1 DataSource
- Ubiquiti UniFi Security Gateway (USGs), Switches, Clients (Wired and Wireless) – 4 DataSources, 1 PropertySource
- Previous Datasource Ubiquiti_UniFi_Clients has been deprecated in favor of this set of new DataSources which splits wired and wireless clients
Monitoring Improvements
- addCategory – Dell PowerConnect – 1 PropertySource
- NoSNMPIf tagging to ensure proper module collects data
- addCategory – Microsoft SQL Server – 1 PropertySource
- Major improvements to authentication verifications, execution efficiencies, and code readability
- AWS ECS – 1 DataSource
- Added complex datapoints to improve alerting abilities
- Citrix NetScaler Full Backup – 1 ConfigSource
- Added filter support to remove null instances
- Cisco SLA ICMP Echo – 1 DataSource
- New datapoint for detailed RTT status; updated datapoint descriptions, graphs, and alert messages
- Cisco UCS Ethernet Interfaces – 1 DataSource
- Fixed datapoint in throughput graph
- Citrix XenApp Delivery Groups – 1 DataSource
- Fixed issue in collection script for connectionStates
- Dell PowerConnect Interfaces – 1 DataSource
- Updated complex datapoint to use ##POLLINTERVAL## token
- DNS – 1 DataSource
- AppliesTo updates to exclude hosts which do not respond to standard device ping, along with various datapoint, alert message and graph improvements
- Kubernetes Container – 1 DataSource
- Topology support added; minor script updates
- Layer 2 Topology (Cisco | RFC 1213) – 2 TopologySources
- Code cleanup and comments
- Linux SSH Info – 1 PropertySource
- Added support for additional metadata retrieval for Linux hosts via SSH
- Microsoft Azure (APIManagement | AnalysisServices | AppServicePlan | ApplicationGateway | ApplicationInsights | AutomationAccount | BillingCostByOperation | BillingCostByRegion | BillingCostByService | BillingCostBySubscription | BillingCostByTag_Example | BlobStorage | CosmosDB | DataLakeAnalytics | DataLakeStore | EventHub | ExpressRouteCircuit | FileStorage | Firewall | Function | Integration_Authentication | IoTHub | MySQL | PostgreSQL | QueueStorage | RedisCache | RedisCacheClusterShards | ResourceHealth | SQLDatabase | SQLElasticPool | ScaleSetVirtualMachine | ServiceBus | StorageAccount | TableStorage | VMBackupStatus | VMs | VirtualMachineScaleSet | VirtualNetworkGateway | WebApplication) – 39 DataSources
- Updated datapoint to use primary aggregation method passed in by the Azure API
- Microsoft Azure Scale Set Virtual Machines – 2 DataSources
- Added support for a number of new datapoints and graphs
- No Ping – 1 PropertySource
- Additional no ping filtering on certain Kubernetes modules
- Palo Alto Running Config – 1 ConfigSource
- Added support for secondary URL for retrieving running config
- SNMP Disks and NFS Mounts – 2 DataSources
- Added filtering for known ephemeral instances (Docker and Kubernetes specifically)
- SNMP Interfaces – 2 DataSources
- AppliesTo updates to ignore devices which do not respond to standard SNMP interface OIDs; complex datapoint update to use POLLINTERVAL token.
- SNMP Switch – Cisco – 1 TopologySource
- VLAN option support to unset snmp.community
- Ubiquiti UniFi Sites and Access Points – 2 DataSources
- Resolved issues that were causing instances that were not APs to be discovered
- Veeam Backup & Replication (HyperVProxyServers | BackupSync | Jobs_Backups | Jobs_ConfigBackup | Jobs_Copy | Jobs_Replicas | Repositories | VMwareProxyServers) – 8 DataSources
- Code improvements to attempt authentication via Collector user; improved tech notes documentation for requirements and setup
- Veeam Backup & Replication (HyperV Proxy Servers | VMware Proxy Servers) – 2 DataSources
- Corrected AD and Collection scripts to accurately interpret Boolean values
- VMware ESXi Host CPU – 1 Datasource
- Disabled auto-instance deletion to preserve instance history retention
- VMware vCenter Alerts – 1 DataSource
- AD script and alert cache improvements to prevent duplicate alerting
- VMware vCenter Host vSwitch and VM Interfaces – 2 DataSources
- Commented out ERIs in AD scripts
- VMware vCenter VMPerformance – 1 DataSource
- Fixed issue with CPUReady datapoint