v.140 Release: Alert Overview Graphs
Last updated on 14 September, 2022
v.140 Highlights:
- Feature Highlight: Alert overview graphs
- Other Platform Enhancements: LM Container, LM Exchange, NetFlow, and topology mapping enhancements
- New and Updated Monitoring Coverage: AWS Health, AWS Elemental MediaStore, Cisco Intersight, Kubernetes, and more
Feature Highlight: Alert Overview Graphs
When viewing alerts triggered by datapoints from the Alerts page, the Overview tab now displays an alert overview graph that plots 60 minutes of data collected for the datapoint. (Previously, this graph was only available on the Overview tab for alerts triggered by dynamic thresholds.)
All alert overview graphs, whether the alert is the result of dynamic or static thresholds, support the following anomaly detection visualization tools:
- Expected range. The expected range band shades the area of the graph in which datapoint values are expected to fall, as based on the nine days of historical data immediately preceding the start of the graph’s time range.
- Offsets. Offsets add historical signals to support quick comparisons with the current signal. LogicMonitor offers three offsets, allowing you to display signals that shift back in time by 24 hours, one week, or one month (30 days). For example, if you are analyzing a point in the graph that occurred on Wednesday at 2:17 p.m., the one-week offset point would represent 2:17 p.m. on Wednesday of the previous week.
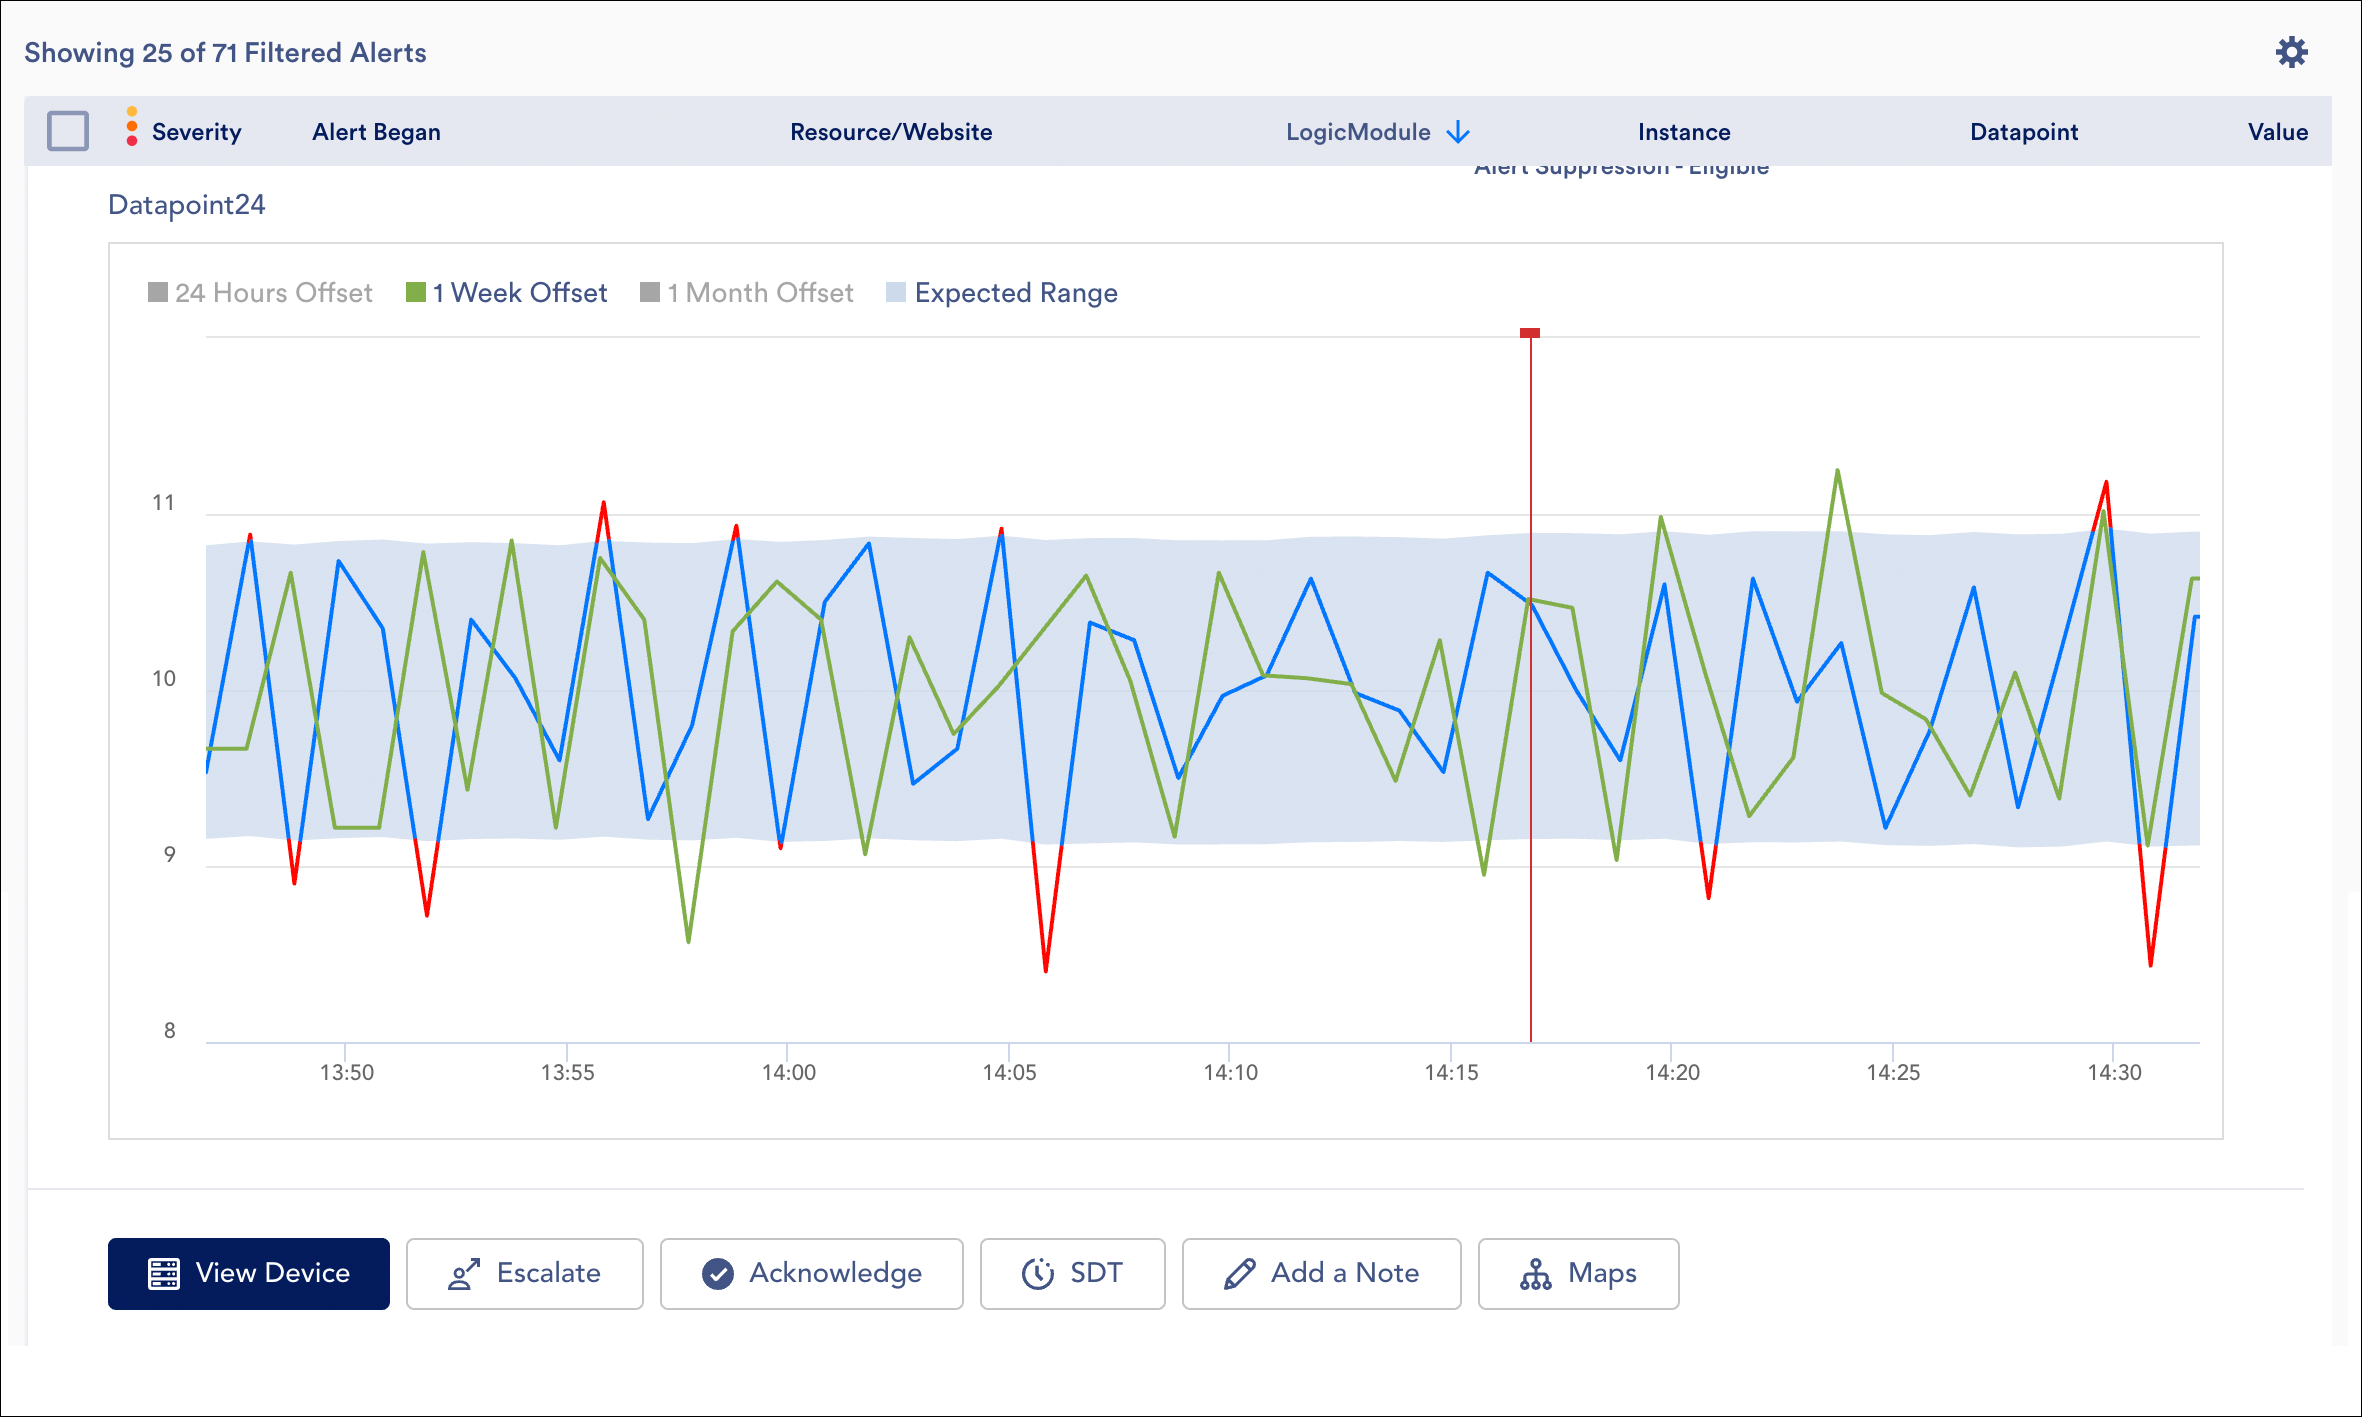
This at-a-glance graph and its anomaly visualization tools are useful for quickly understanding the context of the alert, particularly when no predefined graphs exist for the triggering datapoint.
Other Platform Enhancements
Alerting
- (FIX) Filtering alerts by resource group. Fixed an issue with the group filter (available when filtering alerts from the Alerts page, Alerts tab, and definitions of some reports and dashboards) that was causing alerts from deleted resources that were not members of selected group(s) to be returned.
Collector
- Improved error formatting. Adjusted the output text width of Collector debug information (as displayed in various locations in the UI such as Collector Debug Facility or test script) to make code issues easier to locate. For example, previously, a Groovy code exception with a caret indicating where in the code line the problem is was not properly aligned with the problem character.
- Collector group display pagination. The Collectors page now provides pagination for Collector groups to allow for browsing across a large number of Collector groups. Previously, a restriction of 300 maximum displayed Collector groups was in place.
LM Container
- Automated retry upon resource add fail. Argus will now retry the adding of resources (pods) into monitoring when the initial request fails. This is useful for ensuring monitoring stays up to date and compensating for any issues that may interfere with initial discovery.
- Support for priorityClass. LogicMonitor Helm charts now support a new option priorityClass for Argus, Collectorset-controller, and collector pods. You may find this useful if you already use priorityClass as a way to determine which pods get priority when there are insufficient resources to schedule all pods.
LM Exchange
- Resizable column widths. Columns, which display when viewing LogicModules in the lists view, are now resizable across the Exchange page UI.
LM Intelligence
- Historical offset comparisons available when configuring dynamic thresholds. Historical offset comparisons (what data looked like exactly 24 hours, one week, or one month (30 days) ago) are now available from the anomaly detection graph that displays in the Threshold dialog when enabling dynamic thresholds at the instance level. You may find this useful for understanding how the current metric behavior compares to historical performance when configuring dynamic thresholds for a datapoint.
NetFlow
- NBAR2 support. Added filters and visualizations for NBAR2 (Next Generation Network based Application Recognition) in NetFlow interface. Note: Collector version 29.101 or higher required for NBAR2 functionality.
Role-Based Access Control (RBAC)
- Default topology map view permissions. Previously, LogicMonitor’s default standard roles of Readonly and Ackonly did not provide users with permissions to view topology maps. With v.140, these roles have been updated to include view permissions for topology maps displayed in both the Resources and Mapping pages. Specifically, the Allowed to view Map Tabs option (available under the Resources area) and the View permission level available under the Saved Maps are now selected by default for these roles.
REST API
- (FIX) Correct return of the alertExprNote property in API call. For REST API endpoint
/device/devices/{deviceId}/devicedatasources/{hdsId}/instances/{instanceId}/alertsettings/{id}, the alertExprNote property was incorrectly returning null. This has been fixed.
Topology Mapping
- Edge display. A new Show / Hide Edges dropdown is now available on the Mapping page canvas that allows you to show or hide all edges by edge type (for example, member edge type or network edge type or storage edge type).
New and Updated Monitoring Coverage
Upon your account’s upgrade to v.140, import our new and updated LogicModules from the LogicMonitor public repository to expand and enhance your monitoring coverage.
New Monitoring Coverage
- AWS Elemental MediaStore – 1 DataSource
The new AWS_Elemental_MediaStore DataSource monitors network, request, and error metrics for AWS Elemental MediaStore containers.
- AWS Health Events – 1 EventSource
Monitors the AWS Health event log via the AWS Health API.
- Cisco Intersight – 2 DataSources, 2 EventSources, 1 PropertySource
Monitors Cisco HyperFlex cluster information via Cisco Intersight, as well as monitors security adversities, licensing data, and HyperFlex alarms for Cisco Intersight. We are targeting v.141 for the release of several more Intersight LogicModules, along with setup documentation.
- Cisco Meraki – 1 DataSource
A new DataSource named Cisco_Meraki_Licensing, which monitors license status and days until expiration, has been added to the Cisco Meraki monitoring package.
- Kubernetes – 1 DataSource
A new DataSource named Kubernetes_Endpoint has been released that monitors the number of available Endpoints or Endpoint Slices per service, depending on which is available. As discussed in the Updated Monitoring Coverage section, this data was previously monitored by the Kubernetes_Service DataSource.
- Nimble Array – 1 DataSource
LogicMonitor has released a new DataSource named Nimble_Array_Info that features an updated data collection method to parse for metrics rather than extracting results from the raw response via datapoints. Exception handling for missing metrics as well as new storage metrics have also been added.
Important: This new DataSource deprecates the Nimble Array Info DataSource. If you are currently using this now-deprecated DataSource, you will not experience any data loss upon importing the new DataSource because of the name variation that exists between the two DataSources. However, you will collect duplicate data and potentially receive duplicate alerts for as long as both DataSources are active. For this reason, we recommend that you disable the legacy DataSource after you have imported the new one and verified that it is working as expected.
- Pure Storage – 2 PropertySources, 1 TopologySource
Two new PropertySources (addERI_PureStorage and addERI_AIX) and one TopologySource (PureStorage_Topology) were created for the purpose of supporting topology mapping for Pure Storage nodes and arrays. (As discussed in Updated Monitoring Coverage, several existing LogicModules were also updated for this purpose.)
Updated Monitoring Coverage
- AppliesTo Functions – 5 Convenience Functions
Updated the following AppliesTo functions with descriptions: isMisc(), isNetwork(), isStorage(), isVirtualization(), and NetScan_discovery_queue.
- Aruba AP Radios – 1 DataSource
Updated active discovery script to handle missing or invalid instances. Discovery will no longer fail if a single instance returns “noSuchInstance”.
- AWS_VPC_NATGateway – 1 DataSource
Updated all datapoints, with the exception of ActiveConnectionCount (Max) and Status (Average), to request Sum metrics.
- Cisco_ASA_Temperature – 1 DataSource
Updated collection script to account for sensor scale, type, and precision; now ignores all sensors that aren’t measuring temperature. Replaced estimation with code that looks at scale and precision.
- Cisco HyperFlex – 1 PropertySource
Updated the Description field for the addCategory_CiscoHyperFlex PropertySource to indicate the need to manually assign the value of “CiscoHyperFlex” to the system.categories property for devices not configured for SNMP.
- Cisco_ISE_TACACS+_Ports – 1 DataSource
Updated to no longer assign the placeholder auto.fooProperty instance-level property.
- Cisco Meraki – 10 DataSources, 1 PropertySource
Added a check for the HTTP return code before parsing responses for the following LogicModules:
- Cisco_Meraki_AccessPoint_Interfaces
- Cisco_Meraki_APIUsage
- Cisco_Meraki_DeviceCount
- Cisco_Meraki_Gateway_Interfaces
- Cisco_Meraki_Gateways
- Cisco_Meraki_SecurityAppliance_Interfaces
- Cisco_Meraki_SecurityAppliances
- Cisco_Meraki_Switch_Interfaces
- Cisco_Meraki_Switches
- addCategory_Meraki_API
The incorrect dead host status set for some Meraki devices (and causing incorrect alert suppression) is now being overridden for the following LogicModules:
- Cisco_Meraki_AccessPoints
- Cisco_Meraki_APIUsage
- Cisco_Meraki_DeviceCount
- Cisco_Meraki_Gateways
- Cisco_Meraki_SecurityAppliances
- Cisco_Meraki_Switches
- addCategory_Meraki_API
For the Cisco_Meraki_Switch_Interfaces DataSource only, the following updates have been made:
- Switched to HTTP (from SNMP) for active discovery and data collection instead.
- Added assignment of instance properties to active discovery.
For the addCategory_Meraki_API PropertySource only, the “NoPing” category is applied to organizations or networks that have no devices; fixed bug causing the auto.timezone property to be set to null.
- Citrix_Netscaler_FullBackup – 1 ConfigSource
Added support for empty files to reduce incidence of false alerts; added checks for error messages that echo output back to eliminate errors in execution from entering the history.
- Device_BasicInfo – 1 PropertySource
Updated to add properties for resource age, DNS resolution, auth, SSH availability, SNMP status, and WMI availability; added error state properties.
- HPE – 1 ConfigSource
Updated the AppliesTo statement for the HPE_Network_Config ConfigSource to add support for H3C devices.
- HP MSA – 10 DataSources
For the following DataSources, fixed error that was dropping leading 0s from the authentication hash causing active discovery and data collection to fail in the event the hash had a leading 0.
- HP_MSA_Controllers
- HP_MSA_Disks
- HP_MSA_Fans
- HP_MSA_FRU
- HP_MSA_Ports
- HP_MSA_PSU
- HP_MSA_Redundancy
- HP_MSA_SASLinkHealth
- HP_MSA_VirtualDisks
- HP_MSA_Volumes
- HTTPS- – 1 DataSource
Added Keep-Alive header to request in order to resolve a bug that was causing some incorrectly too-long timeouts to be recorded along with gaps in historical data.
- Istio Kubernetes – All 9 DataSources
Updated the AppliesTo statement for all DataSources in the Istio Kubernetes monitoring package to additionally return TRUE for pods with label “app = promsd”.
- Kubernetes_Service – 1 DataSource
Moved endpoints count from this DataSource to a new DataSource named Kubernetes_Endpoint. Important: Historical data for the numberOfEndpoints datapoint will be lost upon update as this datapoint is no longer present in the Kubernetes_Service DataSource.
- Linux SSH – 2 PropertySources
- Updated the addCategory_Linux_SSH PropertySource to allow it to run against Collectors.
- Updated the Linux_SSH_Info PropertySource to add properties for resource age, DNS resolution, auth, SSH availability, SNMP status, and WMI availability; added error state properties.
- LogicMonitor_Collector_ReportCacheQueue – 1 DataSource (deprecated)
This DataSource never collected data; customers can safely delete from their portals.
- Microsoft_ActiveDirectory_FSMORoles – 1 ConfigSource
Updated the PowerShell script to use PSSession.
- Microsoft Office 365 – 1 PropertySource
Fixed an issue in the collection script of the addCategory_Office365Reports PropertySource that was obscuring error messages on failure.
- Microsoft_SQLServer_SystemJobs – 1 DataSource
Updated the query used by the active discovery script; updated both collection and active discovery scripts to strip out additional unsupported characters from wildvalues.
Note: Some historical data loss may occur on import of this new DataSource version; however, instances for these DataSources are typically short lived so impact should be minimal.
- Miscellaneous – 12 DataSources
As part of a datapoint cleanup initiative, missing datapoint descriptions were added to the following DataSources.
- CiscoDSUCSU-
- DellChassis-
- DellGlobalStorage-
- F5_GTM_Datacenters-
- F5_GTM_Servers-
- F5_GTM_VIPs-
- F5_GTM_WideIP-
- LinuxProcesses-
- Port-
- WinCitrixServices-
- Windows Stuck Print Jobs-
- WinService-
- NetFlow_Device_Heartbeat – 1 DataSource
Removed the alert threshold from the idleInterval datapoint since the threshold should be dependent on device configuration; updated the Technical Notes field with information about needing to manually set the threshold.
- NetSNMP_Memory_Usage – 1 DataSource
Updated collection script to bypass kernel version checks of net-snmp 5.7.2 or higher if the device’s system.sysinfo property does not contain kernel information and is less than three parts, such as when the property value string only contains the hostname.
- Nimble Array Info – 1 DataSource (deprecated)
As highlighted in the New Monitoring Coverage section, LogicMonitor has released a new Nimble_Array_Info DataSource. This new DataSource deprecates the Nimble Array Info DataSource. If you are currently using this now-deprecated DataSource, you will not experience any data loss upon importing the new DataSource because of the name variation that exists between the two DataSources. However, you will collect duplicate data and potentially receive duplicate alerts for as long as both DataSources are active. For this reason, we recommend that you disable the legacy DataSource after you have imported the new one and verified that it is working as expected.
- NTP (Network Time Protocol) – 1 PropertySource
Updated the AppliesTo statement of the addCategory_NTPResponds PropertySource to prevent it from applying to devices with a value of “CiscoNTP” in their system.categories property (due to resulting script timeout issues for those devices).
- OSPF_Neighbors – 1 DataSource
Fixed issue where collection and active discovery scripts were handling null SNMPv3 parameters incorrectly.
- Pure Storage – 4 DataSources, 5 PropertySources
Four DataSources (PureStorage_VolumePerformance, PureStorage_VolumeUtilization, VMware_vCenter_HostPerformance, and VMware_vCenter_HostStatus) and five PropertySources (addERI_Device, addERI_ESXi, addERI_HyperV, addERI_Linux, and addERI_Windows) were updated for the purpose of supporting topology mapping for Pure Storage nodes and arrays. (As discussed in New Monitoring Coverage, several new LogicModules were also created for this purpose.)
For the PureStorage_VolumeUtilization DataSource only:
- Added new datapoints for space saved through data reduction and thin provisioning, as well as aggregate space savings.
- Removed alert thresholds from percent_used datapoint.
- Added missing datapoint descriptions.
- Renamed Data Reduction graph to Storage Space Savings and fixed graph min/max values.
- snmp64_If- – 1 DataSource
Updated to permit the assignment of a literal * character for the interface.description.alerts_enable property.
- SNMP_Network_Interfaces – 1 DataSource
Updated collection interval to two minutes; using OperState instead of ifLastChange when iterating over the raw data; added handling for missing uptime values.
- SwiftStack_Cluster_PolicyStorageUtilization – 1 DataSource
Fixed the AppliesTo statement, which was not updated appropriately after being targeted to a specific device for testing purposes.
- Tomcat JVM – 3 DataSources (Deprecated)
The following DataSources were replaced and deprecated more than one year ago, but never removed from the LogicMonitor public repository. With v.140, they have been removed from the repository.
- JVM Garbage Collection- (replaced by Tomcat JVM Garbage Collection-)
- JVM Memory Pools- (replaced by Tomcat JVM Memory Pools-)
- JVM status- ( was replaced by Tomcat JVM Status-)
- Tomcat_Sessions – 1 DataSource
Updated active discovery script to check ports before attempting a connection, previously passing a closed port would cause active discovery to fail.
- Virtual Windows Machines – 1 DataSource, 1 PropertySource
Updated ERIs for the Win_HyperV_VirtualMachines DataSource and addERI_Windows PropertySource to resolve an issue in which virtualized Windows machines were not merging with their parent VMs.
- WinCPUCore- – 1 DataSource
Updated the display name.