
Static Thresholds for Datapoints
Last updated - 25 July, 2025
A static datapoint threshold consists of a timeframe; comparison method and operator; and up to three threshold values for triggering different alert severity levels.
When developing DataSources, LogicMonitor does much of the work for you by setting default static datapoint thresholds based on published documentation and KPIs, industry best practices, research, years of experience, and customer feedback. For most resources you monitor using LogicMonitor DataSources, alerts are triggered right out of the box and are generally meaningful.
Requirements for Adding Static Thresholds
To add threshold values, you need the following:
- A user with the “Threshold” and “Manage” permissions set at the Resource group level.
In addition, if your environment leverages Access Groups for modules, you need the following:
- The user must have the “Resources: Group Threshold” permission set.
Adding Static Threshold at a Global DataSource Definition Level
- In LogicMonitor, navigate to Resources Tree > Resources.
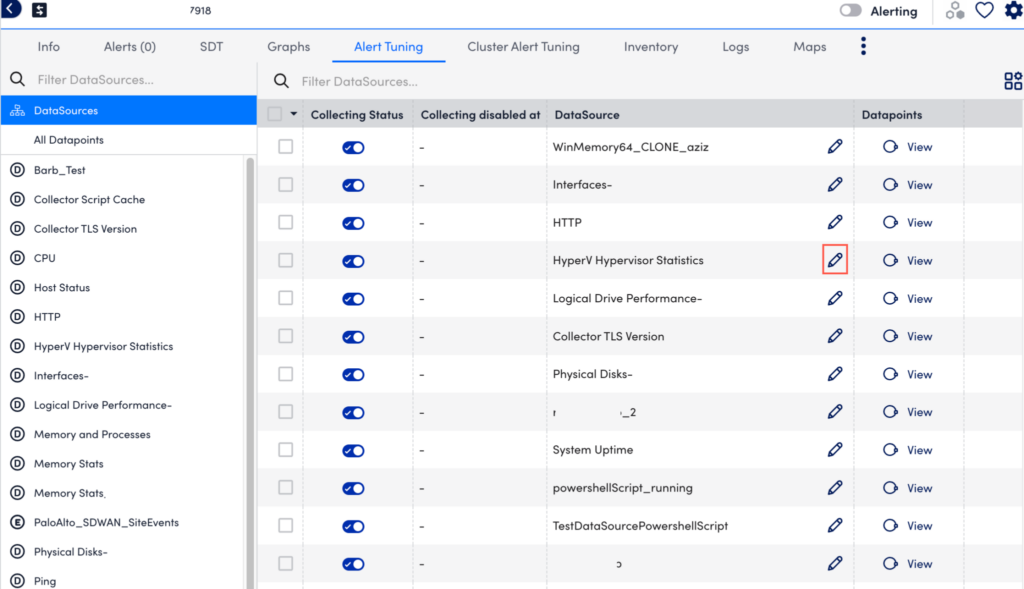
- Select the Alert Tuning tab, and then select a specific datapoint from the dataSource table to edit that dataSource definition in a new tab.
- In the DataSource definition page, select the Datapoints tab.
- In the Datapoints section, under the Action column of your required Normal or Complex Datapoint table, select
 .
. - In the details panel, under the Static Thresholds section, select Alert Threshold Wizard.
You can alternately select or Add Static Threshold button to add your static threshold.

- In the Global Datapoint Threshold modal, select the time range from the From and To dropdown menus.
Multiple sets of thresholds can only exist at the same level if they specify different time frames. - (Optional) You can select All Day for alert thresholds to last the entire day.
- In the When field, select a comparison method as follows:
- Value—Compares the datapoint value against a threshold
- Delta—Compares the delta between the current and previous datapoint value against a threshold
- NaNDelta—Operates the same as delta, but treats NaN values as 0
- Absolute value—Compares the absolute value of the datapoint against a threshold
- Absolute delta—Compares the absolute value of the delta between the current and previous datapoint values against a threshold
- Absolute NaNDelta—Operates the same as absolute delta, but treats NaN values as 0
- Absolute delta%—Compares the absolute value of the percent change between the current and previous datapoint values against a threshold
- Select a comparison operation (For example, >(Greater Than), =(Eqaul To), and so on).
- Enter one or more severity levels with your required values to trigger that alert severity. If you add the same threshold value to more than one severity level, the higher severity level takes precedence. For example, if you set both the warning and error severity level thresholds at 100, then a datapoint value of 100 will trigger an error alert.
If the datapoint value jumps from a lower severity level to a higher severity level, the alert trigger interval count (the number of consecutive collection intervals for which an alert condition must exist before an alert is triggered) is reset. For more information, see Datapoint Overview.

- Select Save to close the Global Datapoint Threshold modal.
- In the Add Threshold History Note input field, enter the required update.
- From the Alert for no data dropdown menu, select your required alert severity option.
- From the Alert trigger interval (consecutive polls) dropdown menu, select your required alert trigger interval value.
- From the Alert clear interval (consecutive polls) dropdown menu, select your required alert clearing interval value.
- From the Alert Message dropdown menu, select the required alert template.
- Select Save to apply the settings.
Adding Static Thresholds at Instance, Instance Group, Resource Group, and Resource DataSource Level.
- In LogicMonitor, navigate to Resources Tree > Resources.
- Select the level where you want to add the static threshold.
For more information, see Different Levels for Enabling Alert Thresholds. - Select the Alert Tuning tab, and then select the required row from the datapoint table.
- In the details panel, select the Threshold tab.
- Select Add a Threshold and select Static Threshold.

- In the Add Static Threshold section of the details panel, select the time range from the From and To dropdown menus.
Static thresholds can have overlapping time ranges but the threshold that is used to determine whether or not an alert is triggered is determined by threshold priority. Threshold priority is represented from right to left in the modal or from left to right in the composite string. - (Optional) You can select All Day for alert thresholds to last the entire day.
- In the When field, select a comparison method as follows:
- Value—Compares the datapoint value against a threshold
- Delta—Compares the delta between the current and previous datapoint value against a threshold
- NaNDelta—Operates the same as delta, but treats NaN values as 0
- Absolute value—Compares the absolute value of the datapoint against a threshold
- Absolute delta—Compares the absolute value of the delta between the current and previous datapoint values against a threshold
- Absolute NaNDelta—Operates the same as absolute delta, but treats NaN values as 0
- Absolute delta%—Compares the absolute value of the percent change between the current and previous datapoint values against a threshold
- Select a comparison operation (For example, >(Greater Than), =(Eqaul To), and so on).
- Enter one or more severity levels with your required values to trigger that alert severity. If you add the same threshold value to more than one severity level, the higher severity level takes precedence. For example, if you set both the warning and error severity level thresholds at 100, then a datapoint value of 100 will trigger an error alert.
If the datapoint value jumps from a lower severity level to a higher severity level, the alert trigger interval count (the number of consecutive collection intervals for which an alert condition must exist before an alert is triggered) is reset. For more information, see Datapoint Overview. - In the Threshold Update Note field, enter the required update.
- Under the Alert tuning parameters section, do the following:
- From the If there is no data dropdown menu, select your required alert severity option.
- From the Alert trigger interval (consecutive polls) dropdown menu, select your required alert trigger interval value.
- From the Alert clear interval (consecutive polls) dropdown menu, select your required alert clearing interval value.

- Select Save to apply the settings.
