AWS Monitoring Setup
Last updated on 18 October, 2024You can use LogicMonitor to monitor your Amazon Web Services (AWS) accounts and the underlying services and license usage. This allows you to identify faults and manage performance in your AWS environment.
Setting up AWS monitoring involves the following:
- Adding an AWS account to LogicMonitor
This requires you to simultaneously configure settings in your LogicMonitor portal and your AWS account. - Selecting the AWS services you want to monitor
- (Optional) Configuring billing
Note: You can configure billing after you set up AWS monitoring. To configure billing as part of the setup, you must create an AWS Billing and Usage Report. For more information, see AWS Billing Monitoring Setup.
You can use a wizard in your LogicMonitor portal to guide you through this process.
When you add an AWS account to LogicMonitor, you must create an IAM policy and IAM role in AWS using values provided by LogicMonitor. Amazon then creates an Amazon Resource Name (ARN) for the role which you add back to LogicMonitor. The following diagram illustrates the process of adding the AWS account to LogicMonitor:

Setting up AWS Monitoring
- Navigate to Resources > Add.
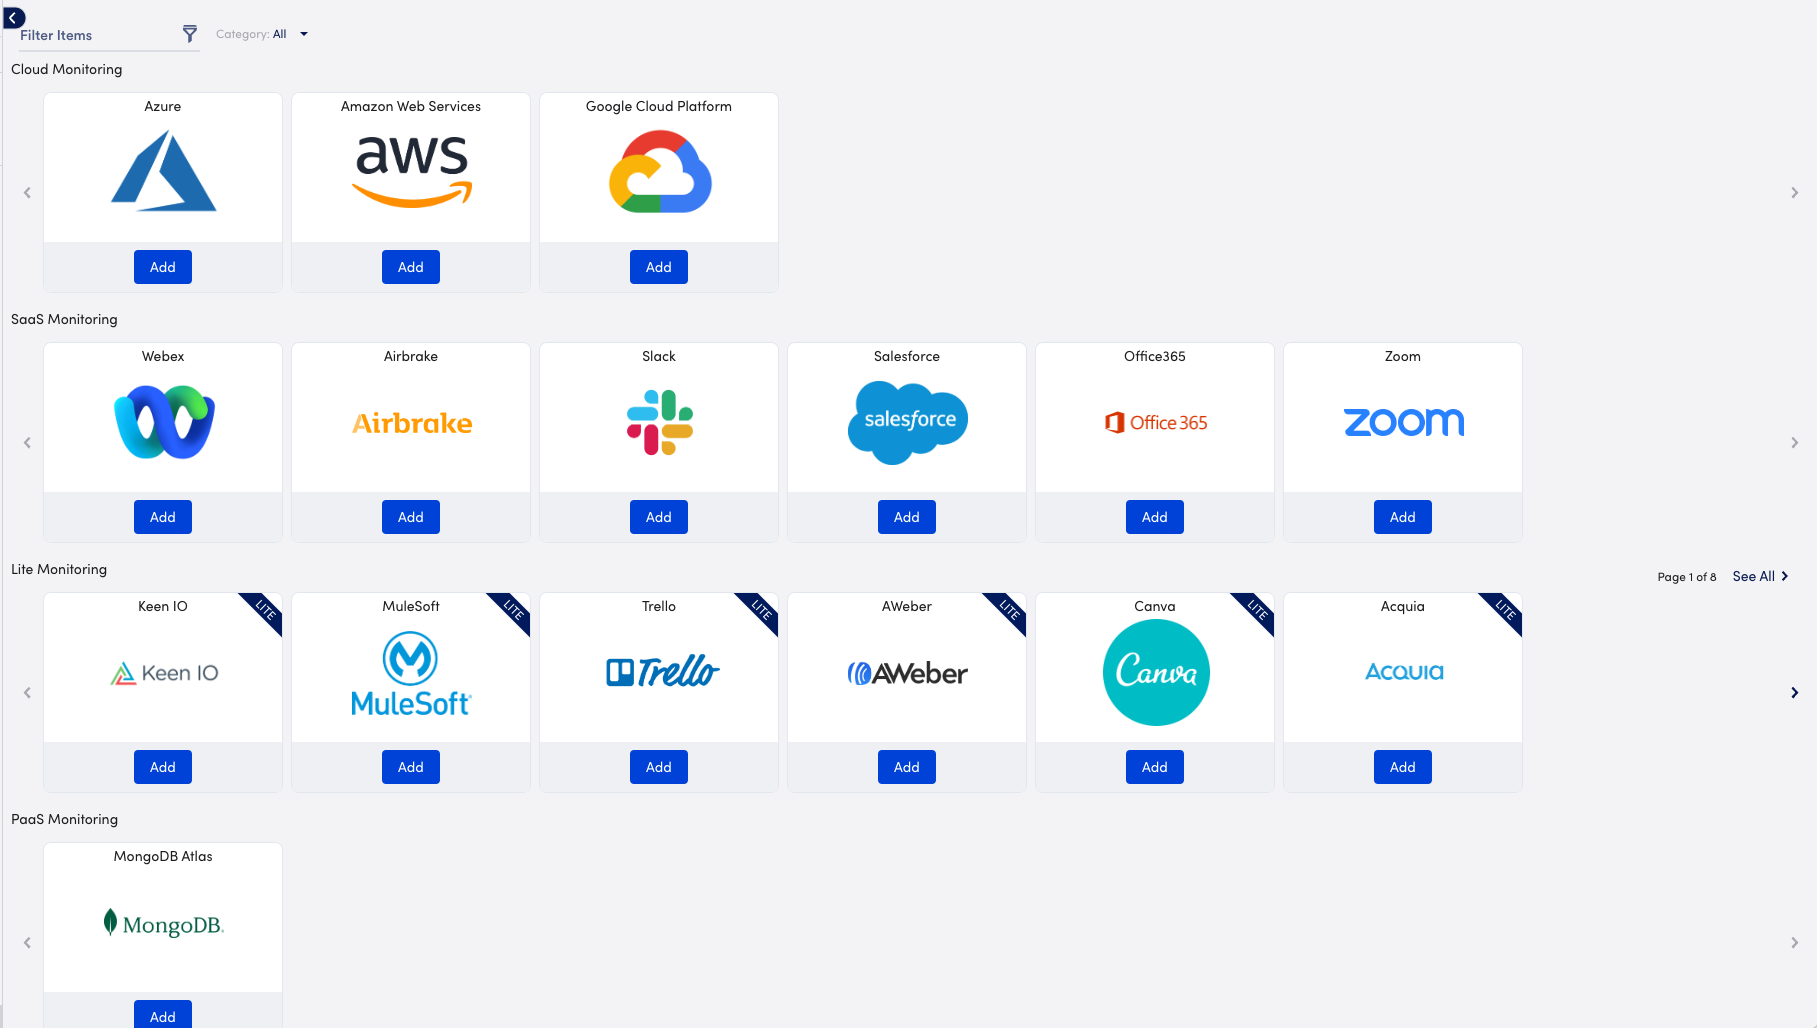
- Select Cloud and SaaS.
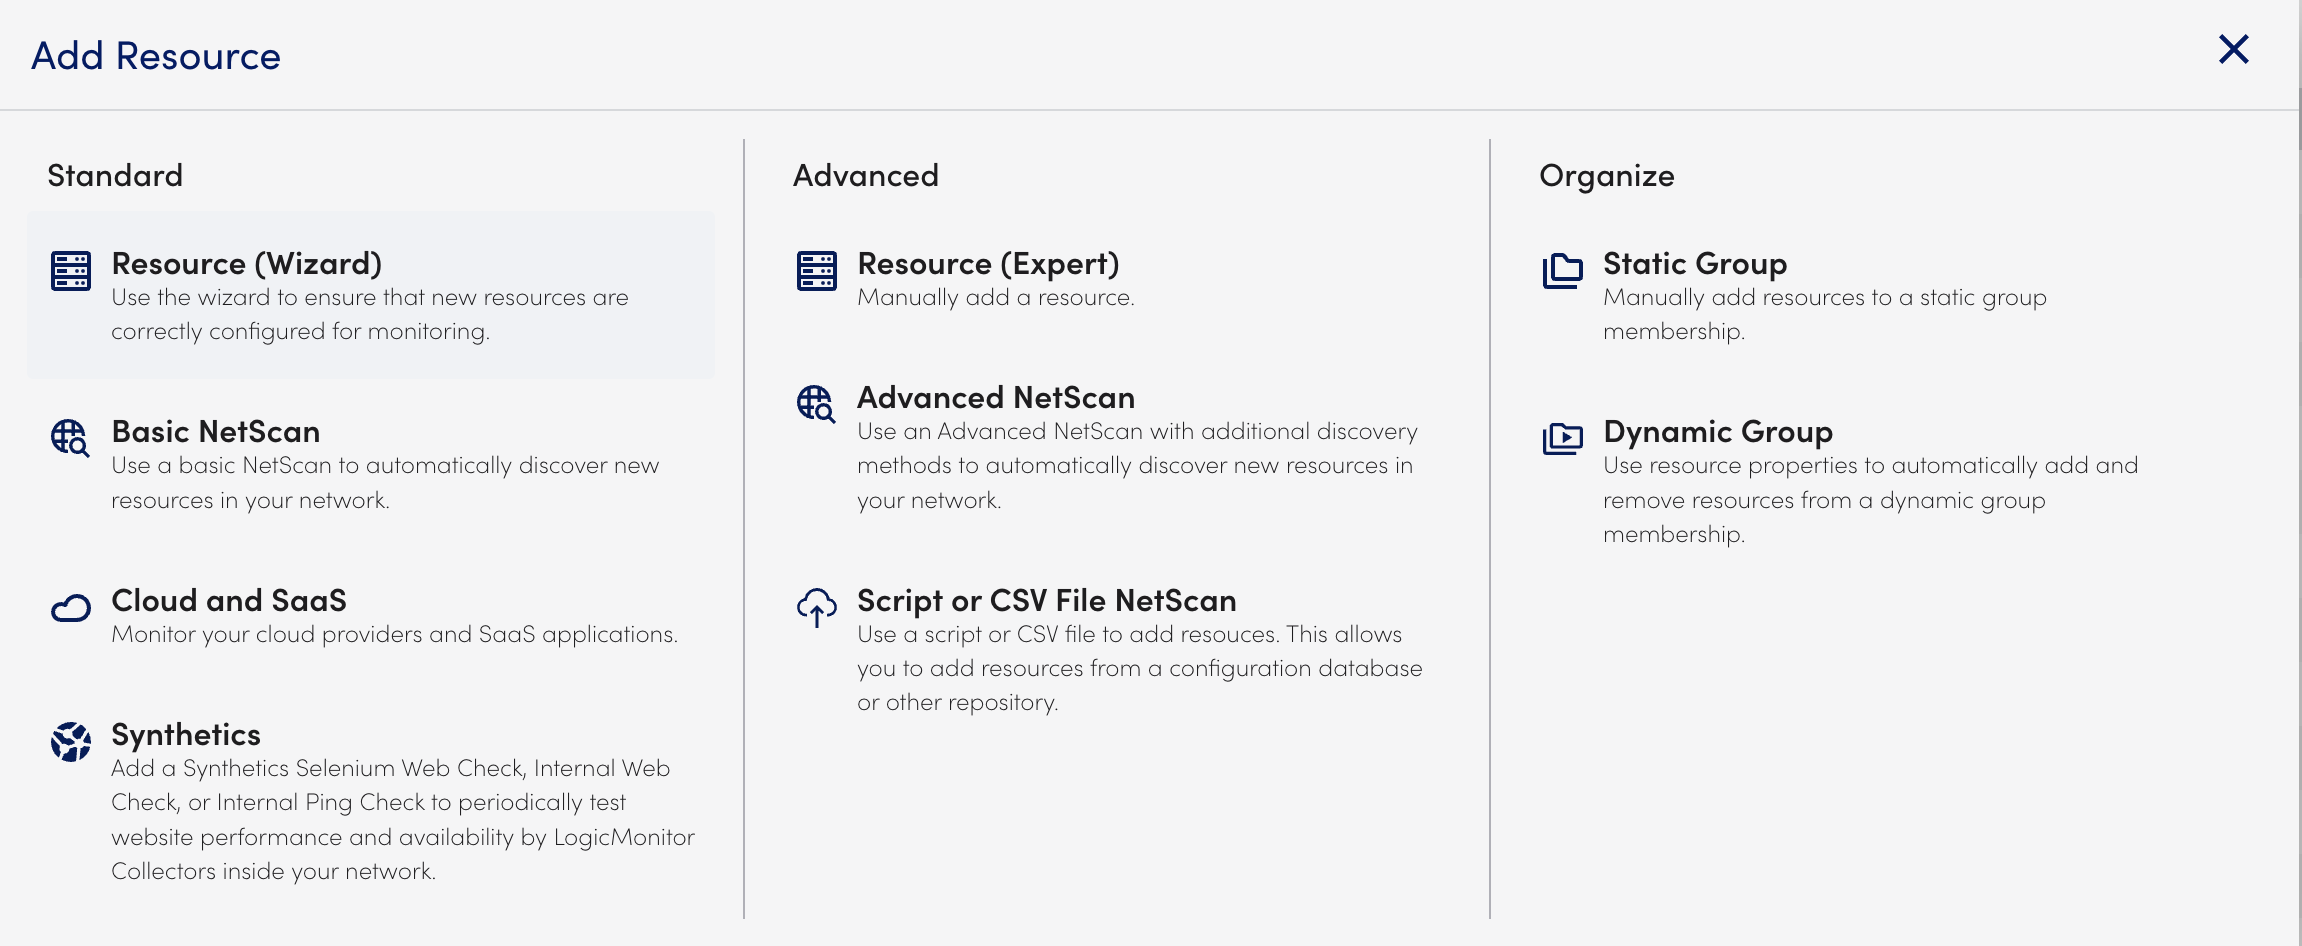
- In Cloud Monitoring, select Add for Amazon Web Services.
- In the Name step of the wizard, do the following:
- In the Name field, enter a name for how the AWS account displays in your LogicMonitor portal.
- (Optional) In the Description field, enter a description to provide more information about the account.
- In the Where should it be placed? field, enter the name of a parent group to specify where the account should be placed in the Resources page.
LogicMonitor attempts to match results as you type. - In the Properties settings, enter a name and value pairs for the AWS account.
For more information, see Resource and Instance Properties.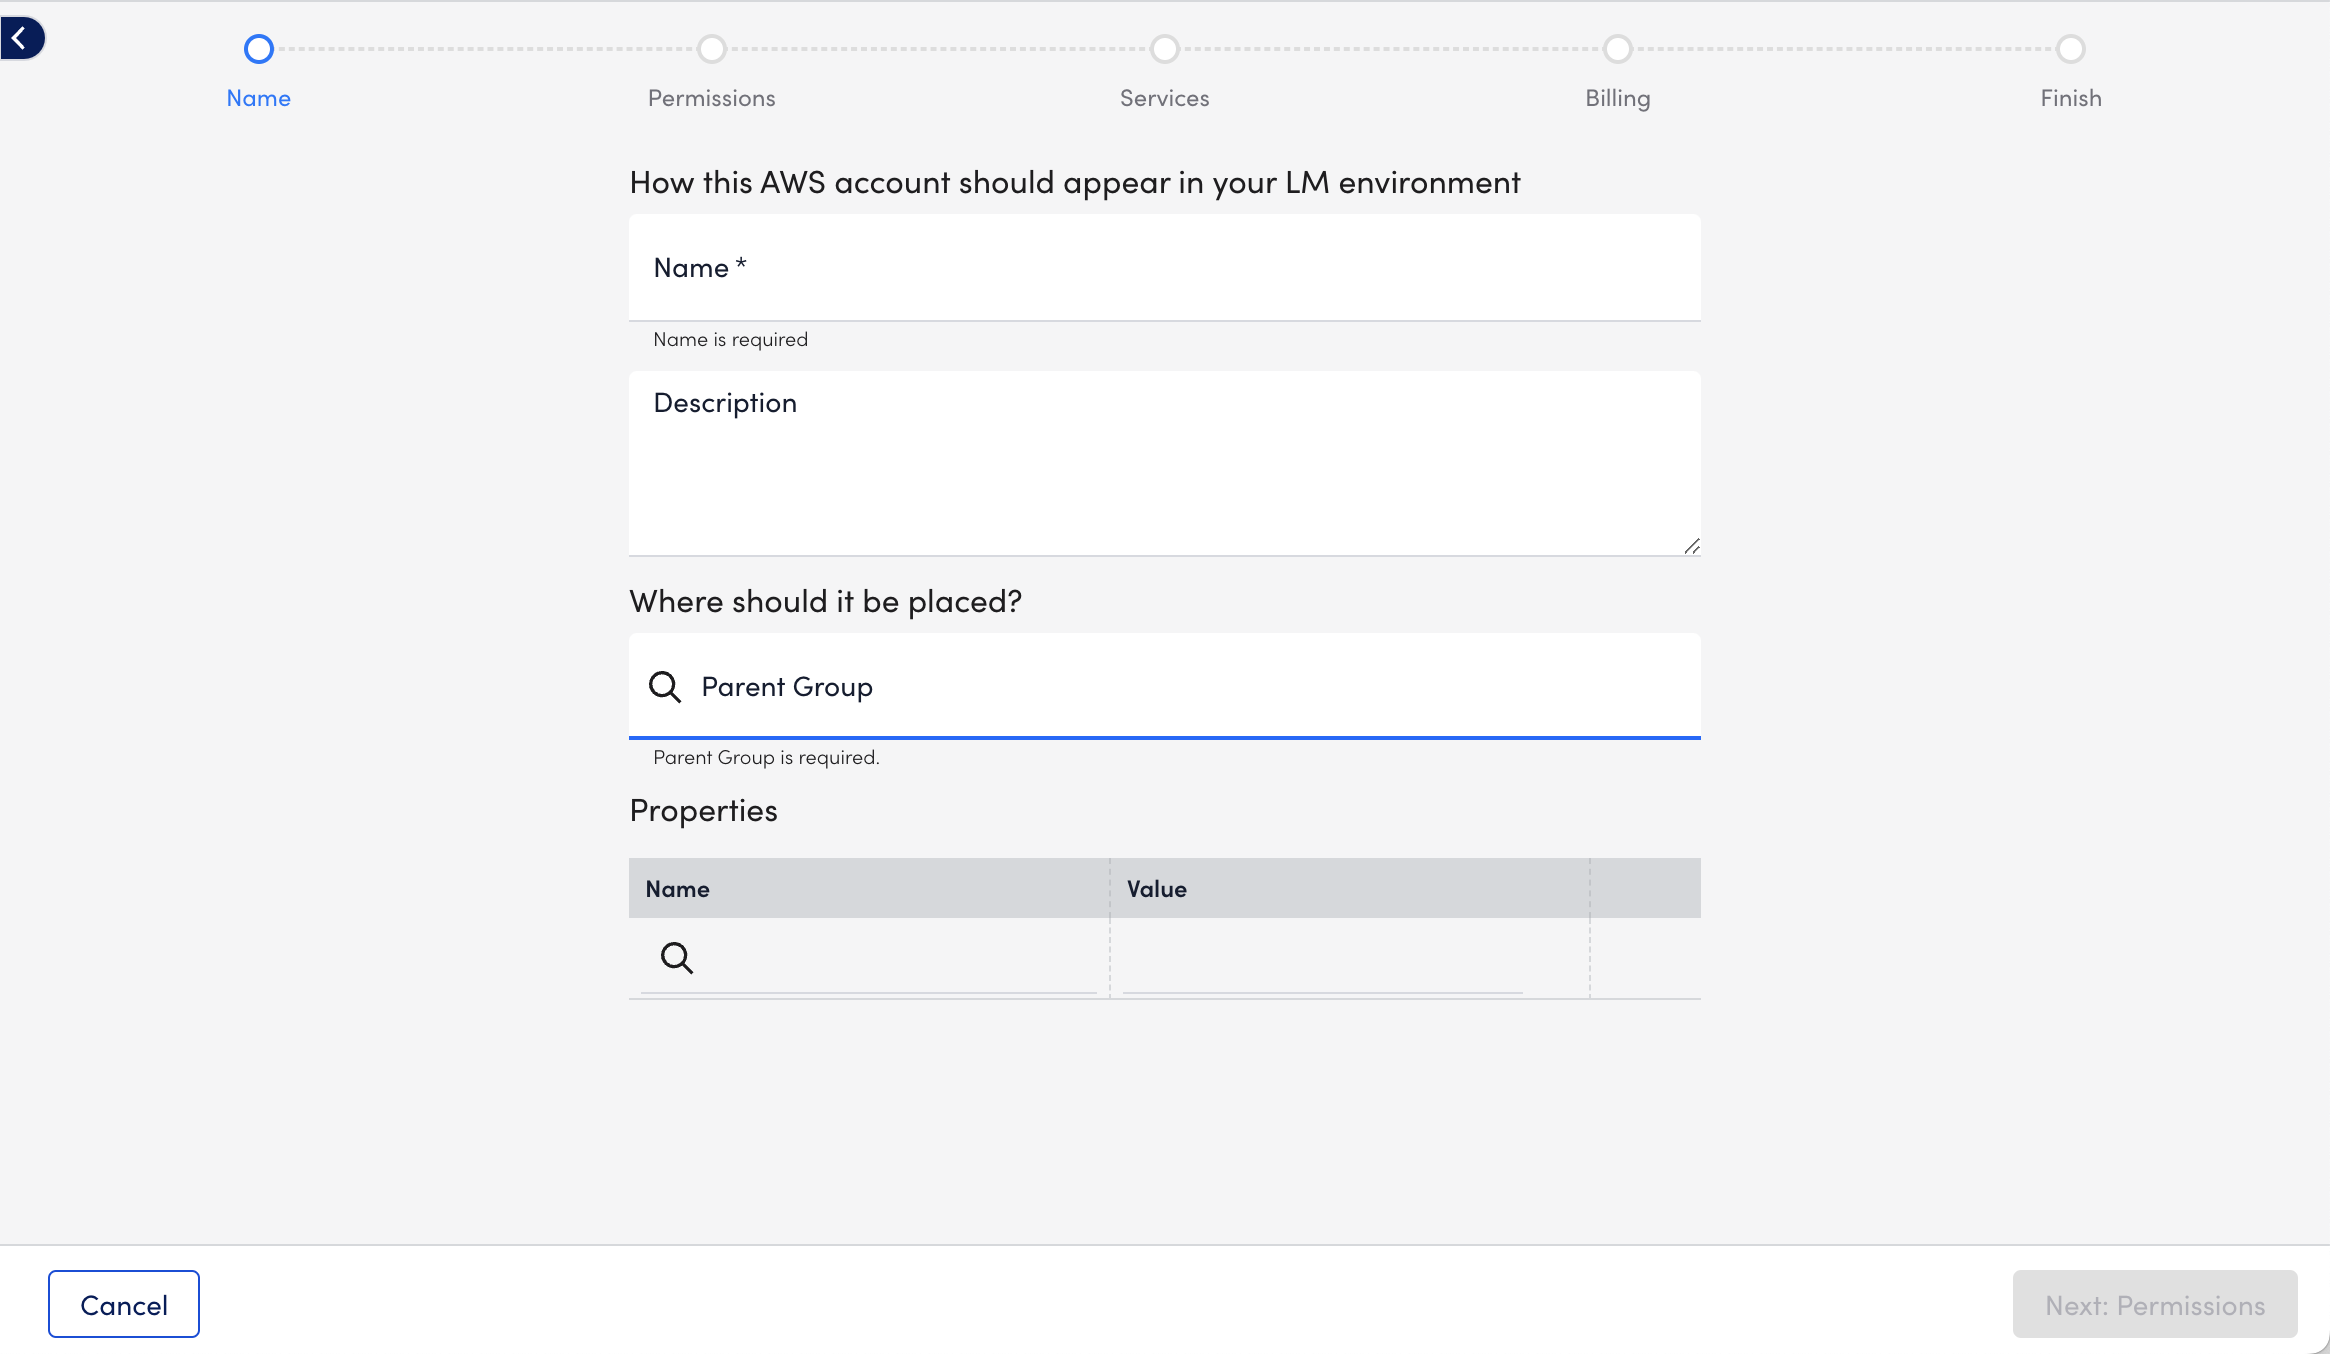
- Select Next: Permissions, and use the values that LogicMonitor generates to do the following:
- Use the values from Account ID and External ID provided by LogicMonitor to create your IAM role in your AWS Management Console. You must use the Creating a role to delegate permissions to an IAM user documentation from AWS to create your IAM role.
Adding the provided Account ID and External ID to your IAM role specifies that your LogicMonitor account uses the IAM role. - Copy the JSON from Create a new Policy and use it to create your IAM policy in AWS using the applicable Creating IAM policies documentation from AWS.
The JSON includes the minimum permissions necessary for LogicMonitor to collect data for your AWS resources. Omit permissions for services you do not monitor with LogicMonitor.
Alternatively, you can attach the default AWS ‘ReadOnlyAccess’ to your LogicMonitor role and add additional permissions for certain AWS resources as necessary. You need the ‘AWSSupportAccess’ for service limit monitoring via Trusted Advisor and ‘CostExplorer’ read access to monitor for reserved instances. For more information about ReadOnlyAccess, see AWS’s Managed policies and inline policies documentation. - In Add Role ARN to LogicMonitor, add the ARN from AWS.
The ARN is for the IAM role you created in AWS.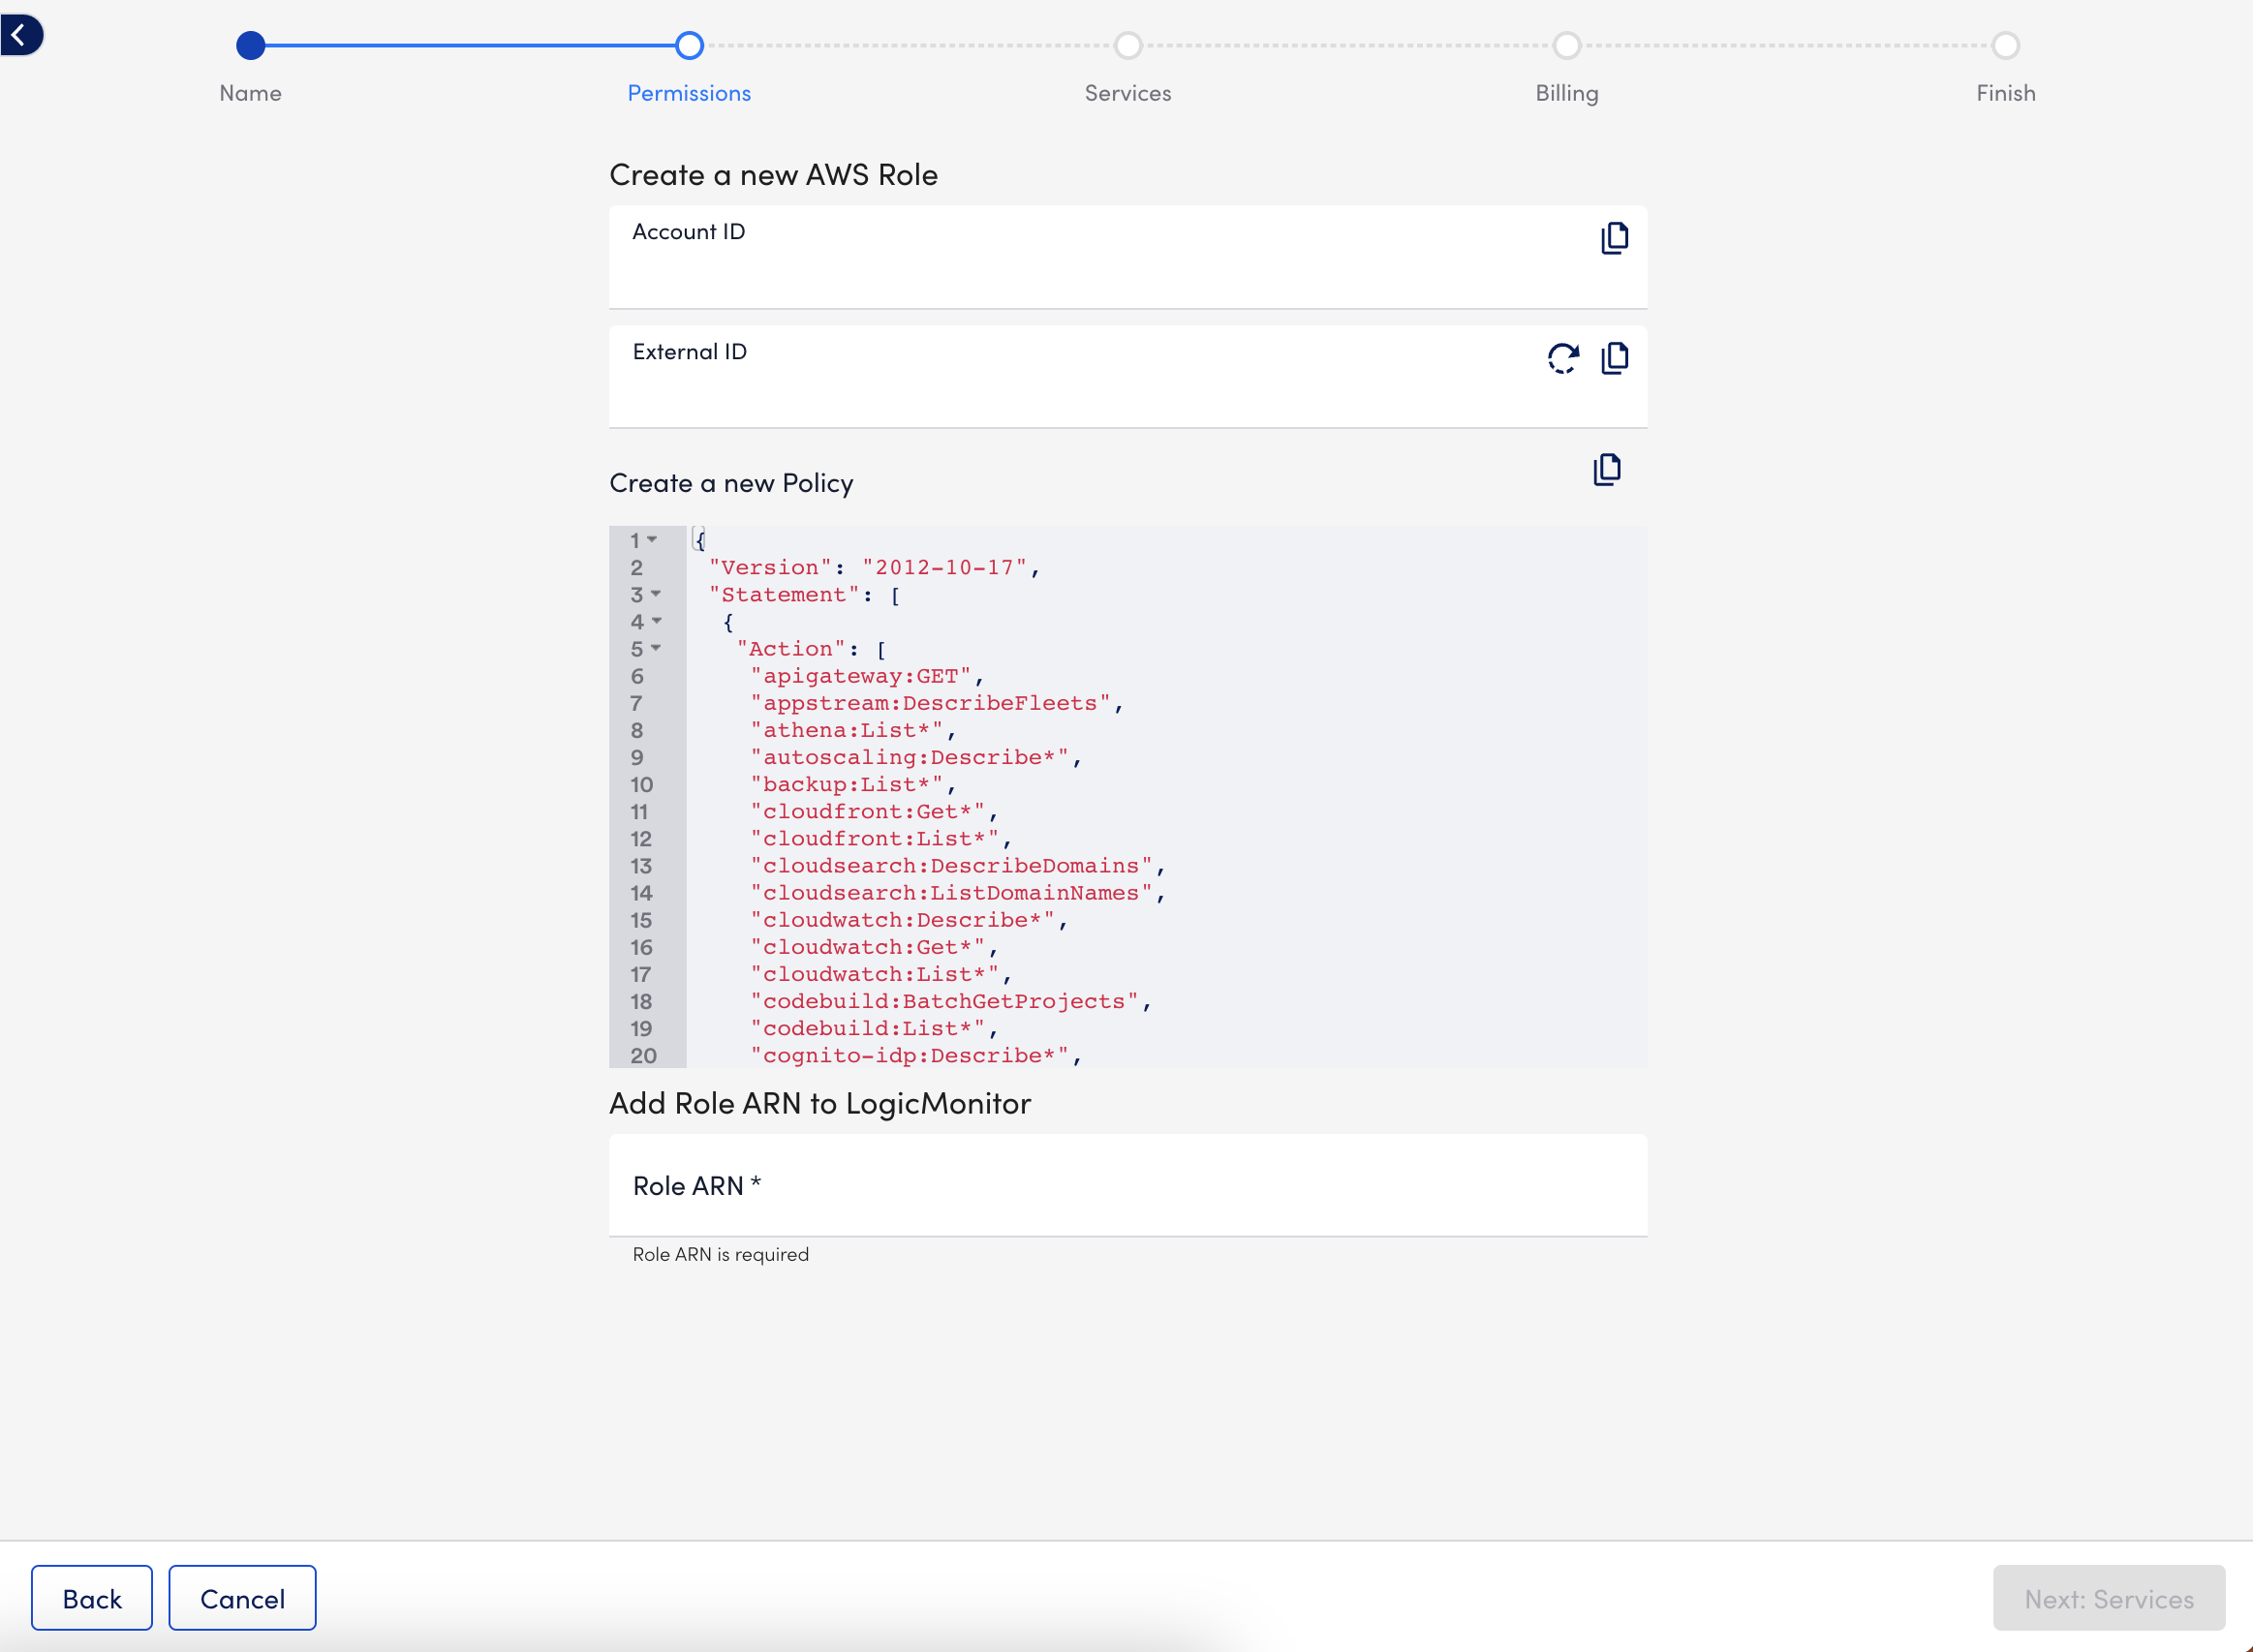
Note: The s3:GetObjects permission is needed for billing monitoring. To reduce permissions, you can modify the permission to include the s3 bucket you saved your AWS cost and usage report to.
- Use the values from Account ID and External ID provided by LogicMonitor to create your IAM role in your AWS Management Console. You must use the Creating a role to delegate permissions to an IAM user documentation from AWS to create your IAM role.
- Select Next: Services, and choose the AWS services you want to monitor.
For a list of the monitored AWS services, see Cloud Services and Resource Units.
In addition, you can configure how you want LogicMonitor to monitor the services by doing the following:- To configure monitoring preferences for all services to inherit, select Default Settings, and then do the following:
- On the Global Settings tab, you can configure the following behavior:
- To configure how often LogicMonitor automatically checks for new AWS resources in your account, select a frequency using the NetScan Frequency setting.
- To delete the resources immediately or after a time period when no data is received for the resource, toggle on Automatically delete AWS resources if they are no longer available in the cloud portal, and then choose the timeframe for deletion using the When AWS resources terminate option.
This does not remove instances stopped or terminated prior to adjusting this setting. These instances must be deleted manually. - To disable alerting after the resources are deleted, toggle on Automatically disable alerting for AWS resources if they are no longer available in the cloud portal.
- To select regions that apply to the account and where services should be discovered, choose the regions from Monitored Regions.
Note: LogicMonitor does not support Government Cloud Regions for AWS
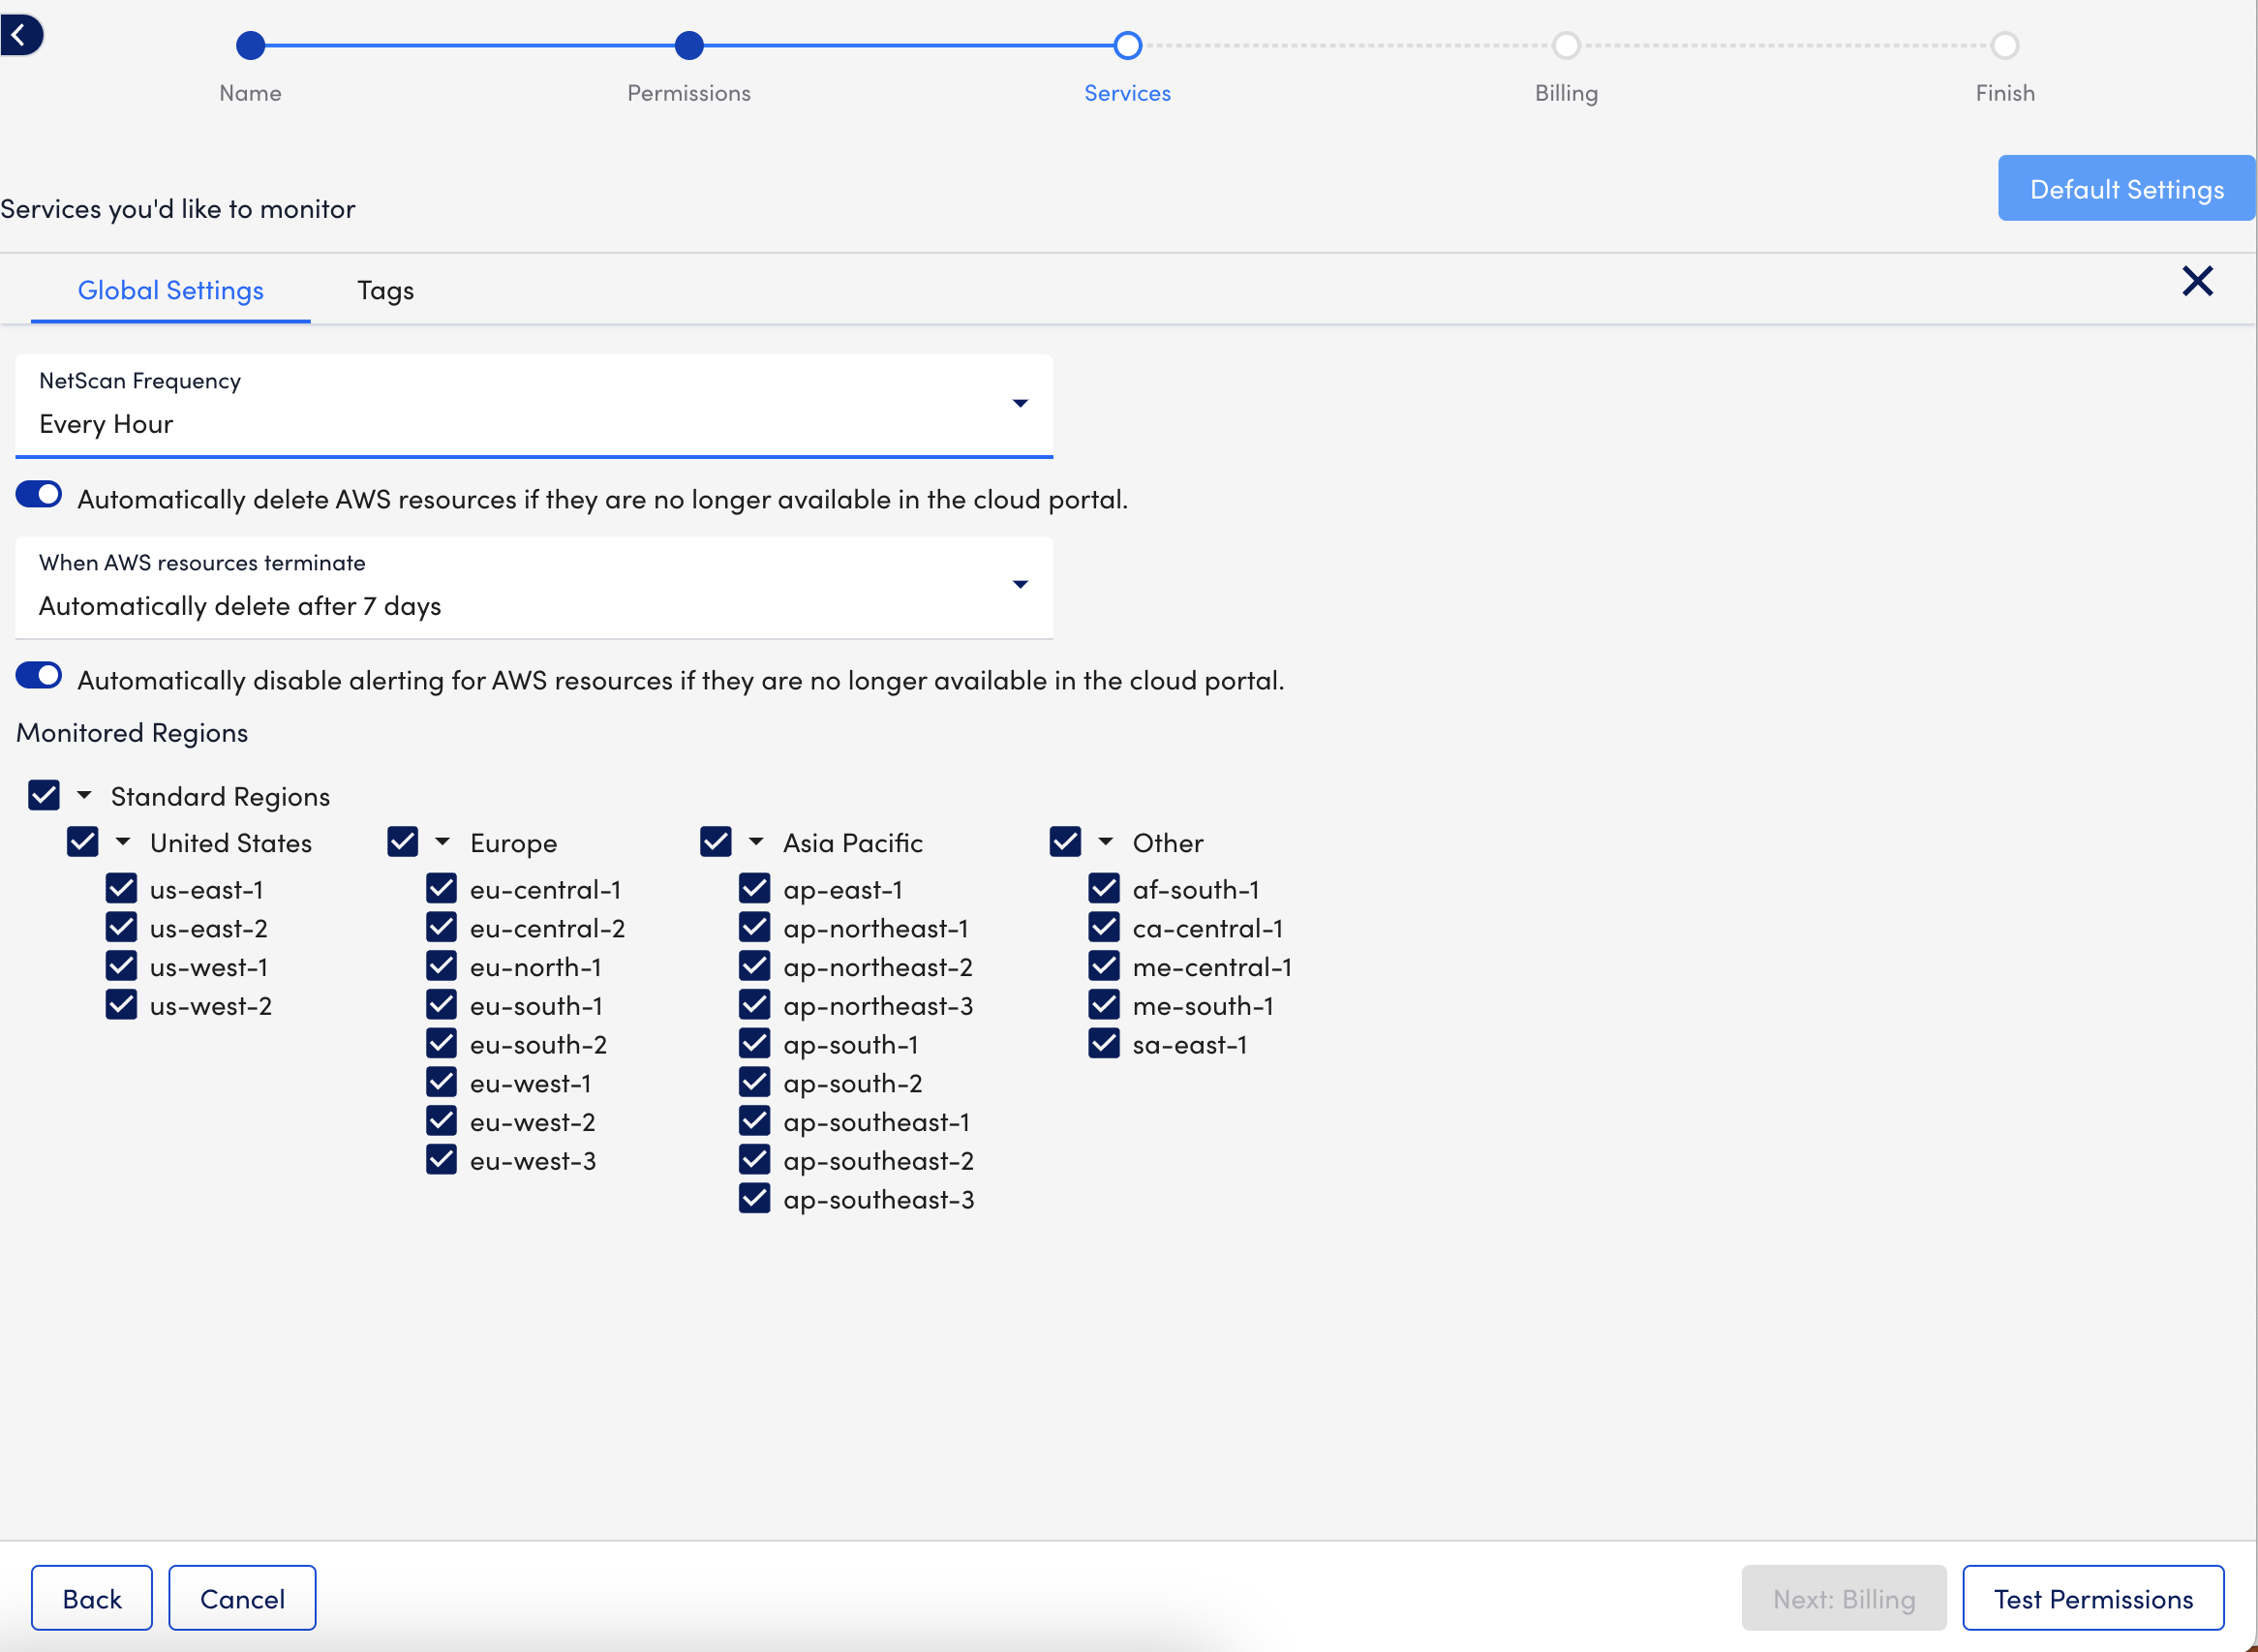
Note: Restricting us-east-1 is not supported. For more information about supporting this region, see AWS’s Deny access to AWS based on the requested AWS Region documentation.
- On the Tags tab, define filtering criteria for the AWS resources added to your account.
Consider the following when adding tags:- You can use glob expressions with the tag filter, for example:
tag value = prod* - Resources are discovered if they contain one or more tags specified with an include operation but not any of the exclude tags.
- The tag filter is case sensitive.
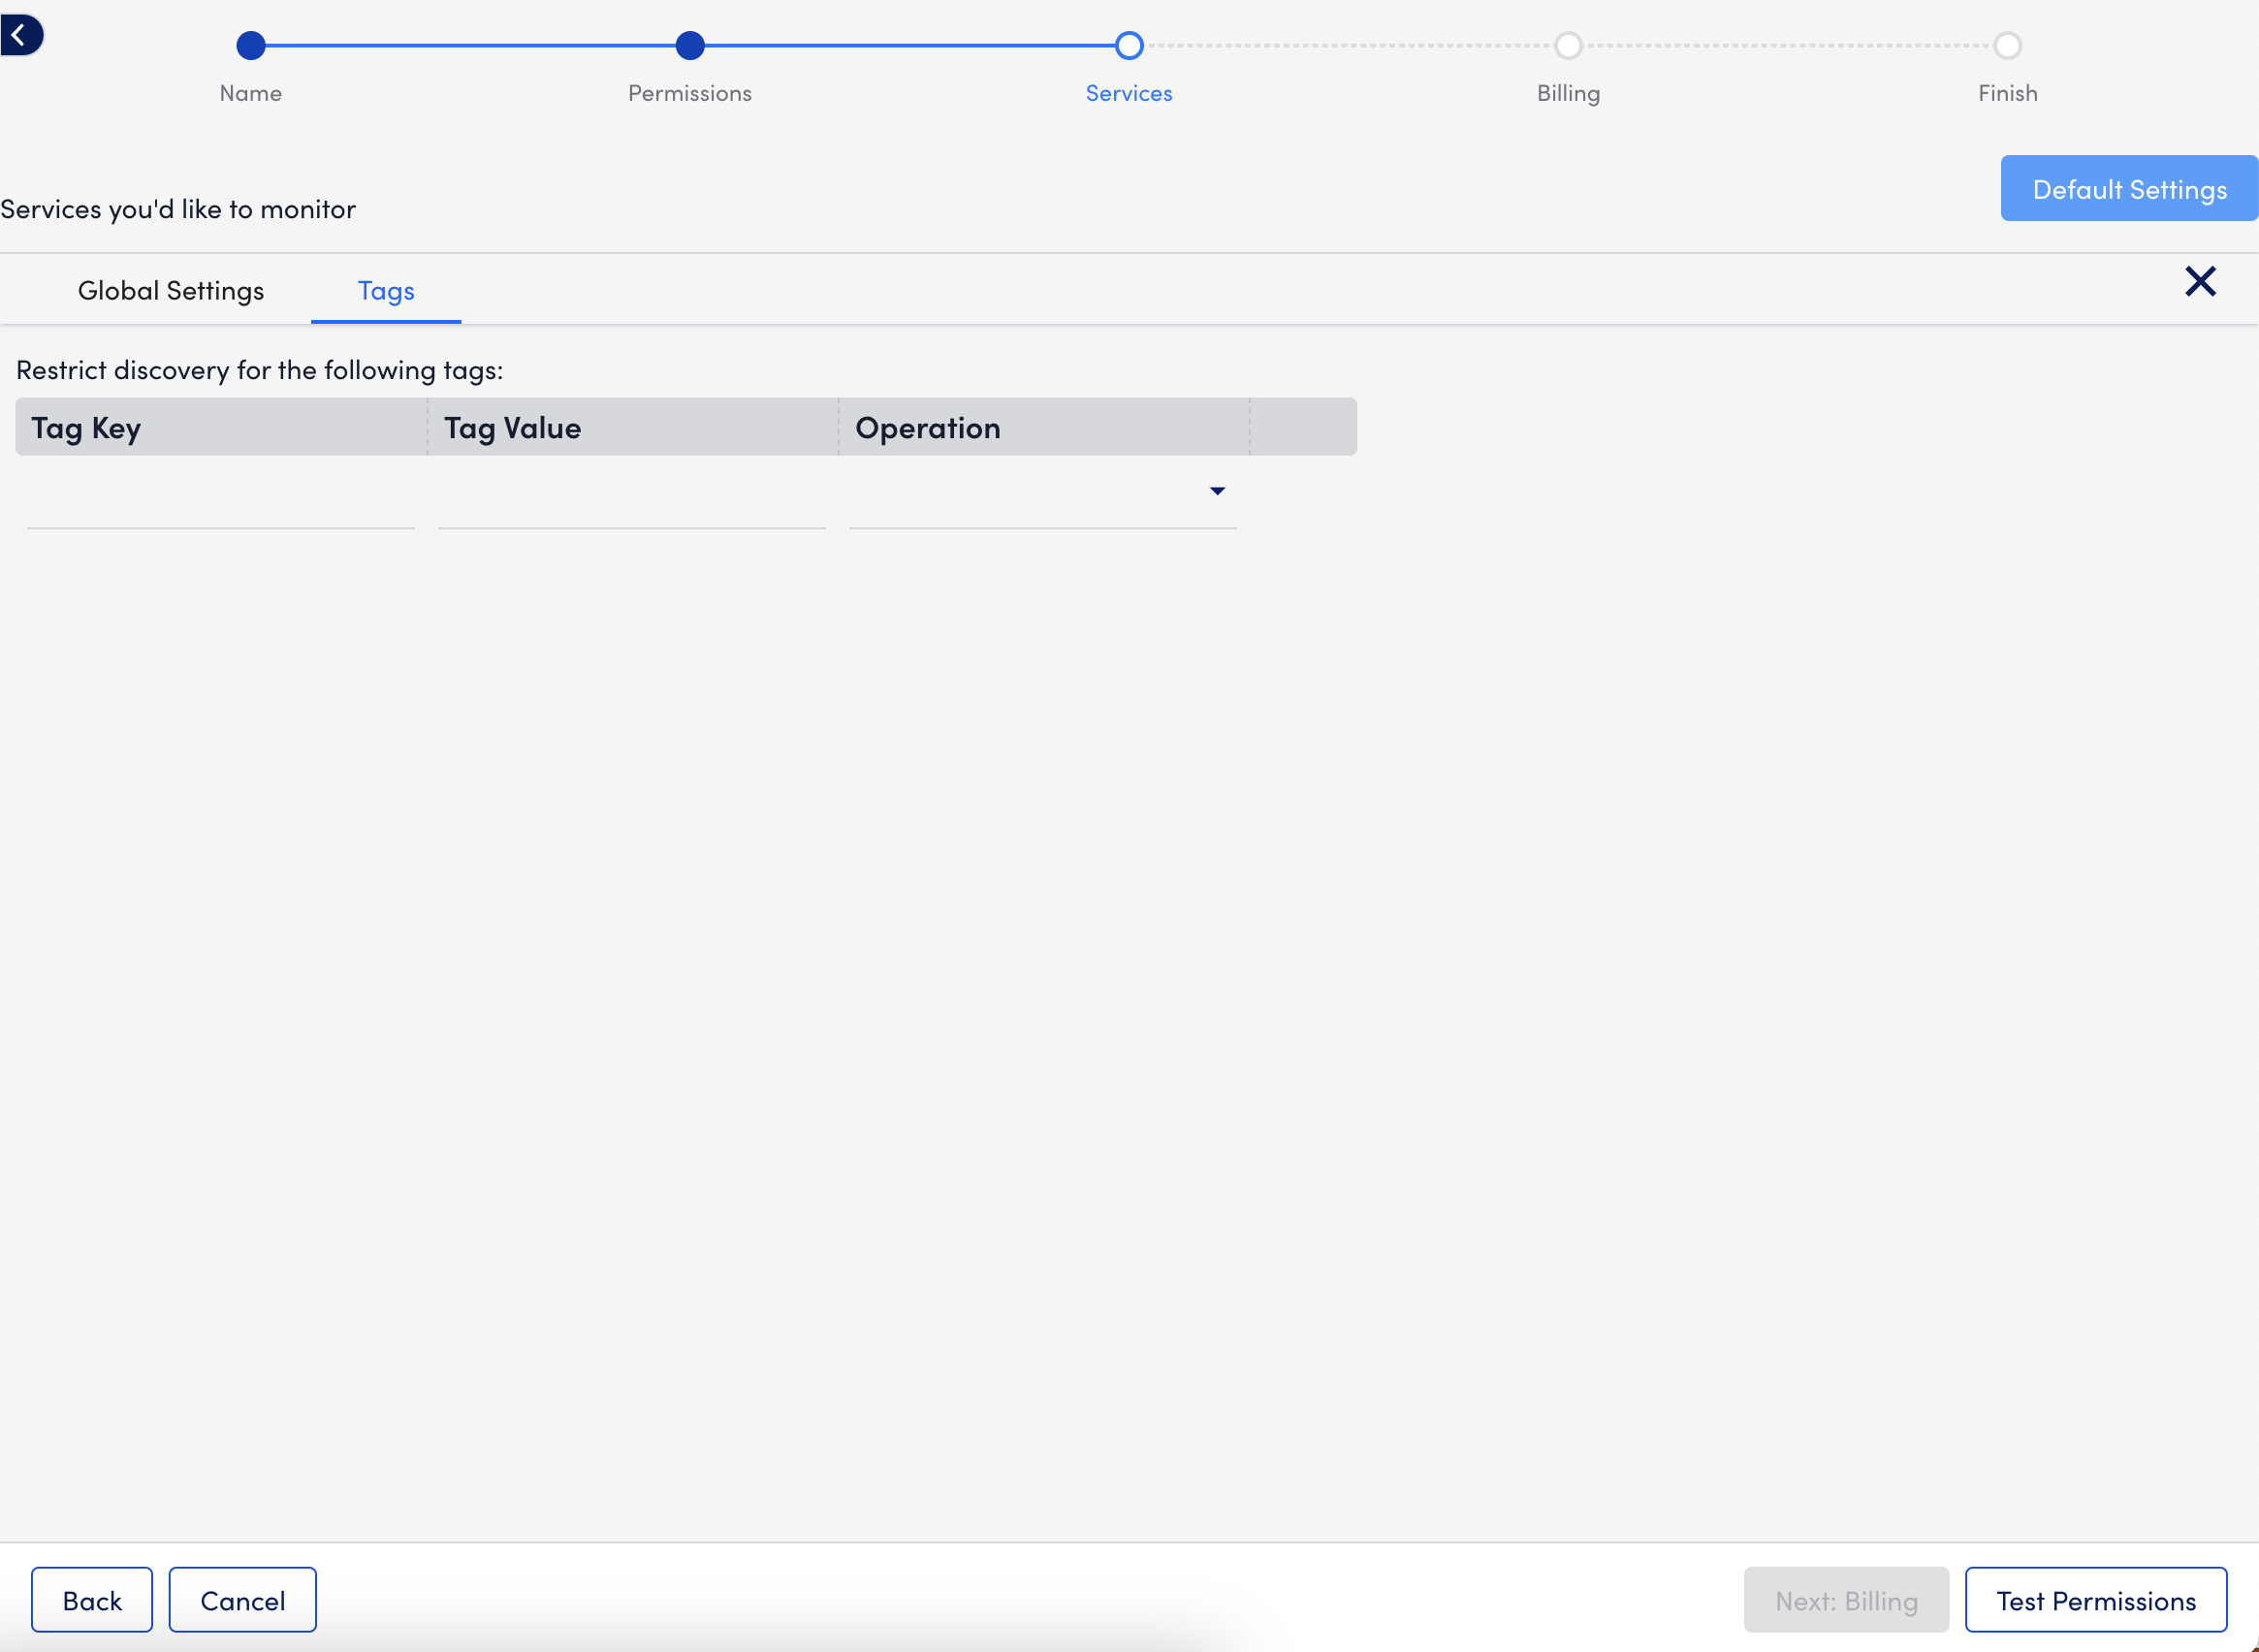
For more information, see LM Cloud Monitoring Overview and Using AWS Tags in LogicMonitor. - You can use glob expressions with the tag filter, for example:
- On the Global Settings tab, you can configure the following behavior:
- To configure monitoring preferences for an individual service, do the following:
- Select Settings.
- Switch the Inherit from Global Settings toggle, and configure the settings as needed for the individual service.
- If you are configuring monitoring preferences for the EC2 service, consider the following:
- Enable Enhanced Detection on the Discovery Settings tab to improve instance detection. You do not need to set a custom NetScan frequency if you enable this option.
- If you use Amazon EC2 Auto Scaling, select “Every 10 Minutes” from the NetScan Frequency option on the Discovery Settings tab. This enables LogicMonitor to check for new EC2 instances more frequently to accommodate the scaling of your instances in AWS.
- You can enable monitoring using a local Collector to monitor and collect more comprehensive metrics, such as the operating system and application metrics. For more information, see Enabling Monitoring via a Local Collector.
- To configure monitoring preferences for all services to inherit, select Default Settings, and then do the following:
- Select Test Permissions.
LogicMonitor tests the credentials and permissions with AWS and displays a message indicating success or error.
Note: Depending on your environment, testing permissions may take up to ten seconds.
- Do one of the following:
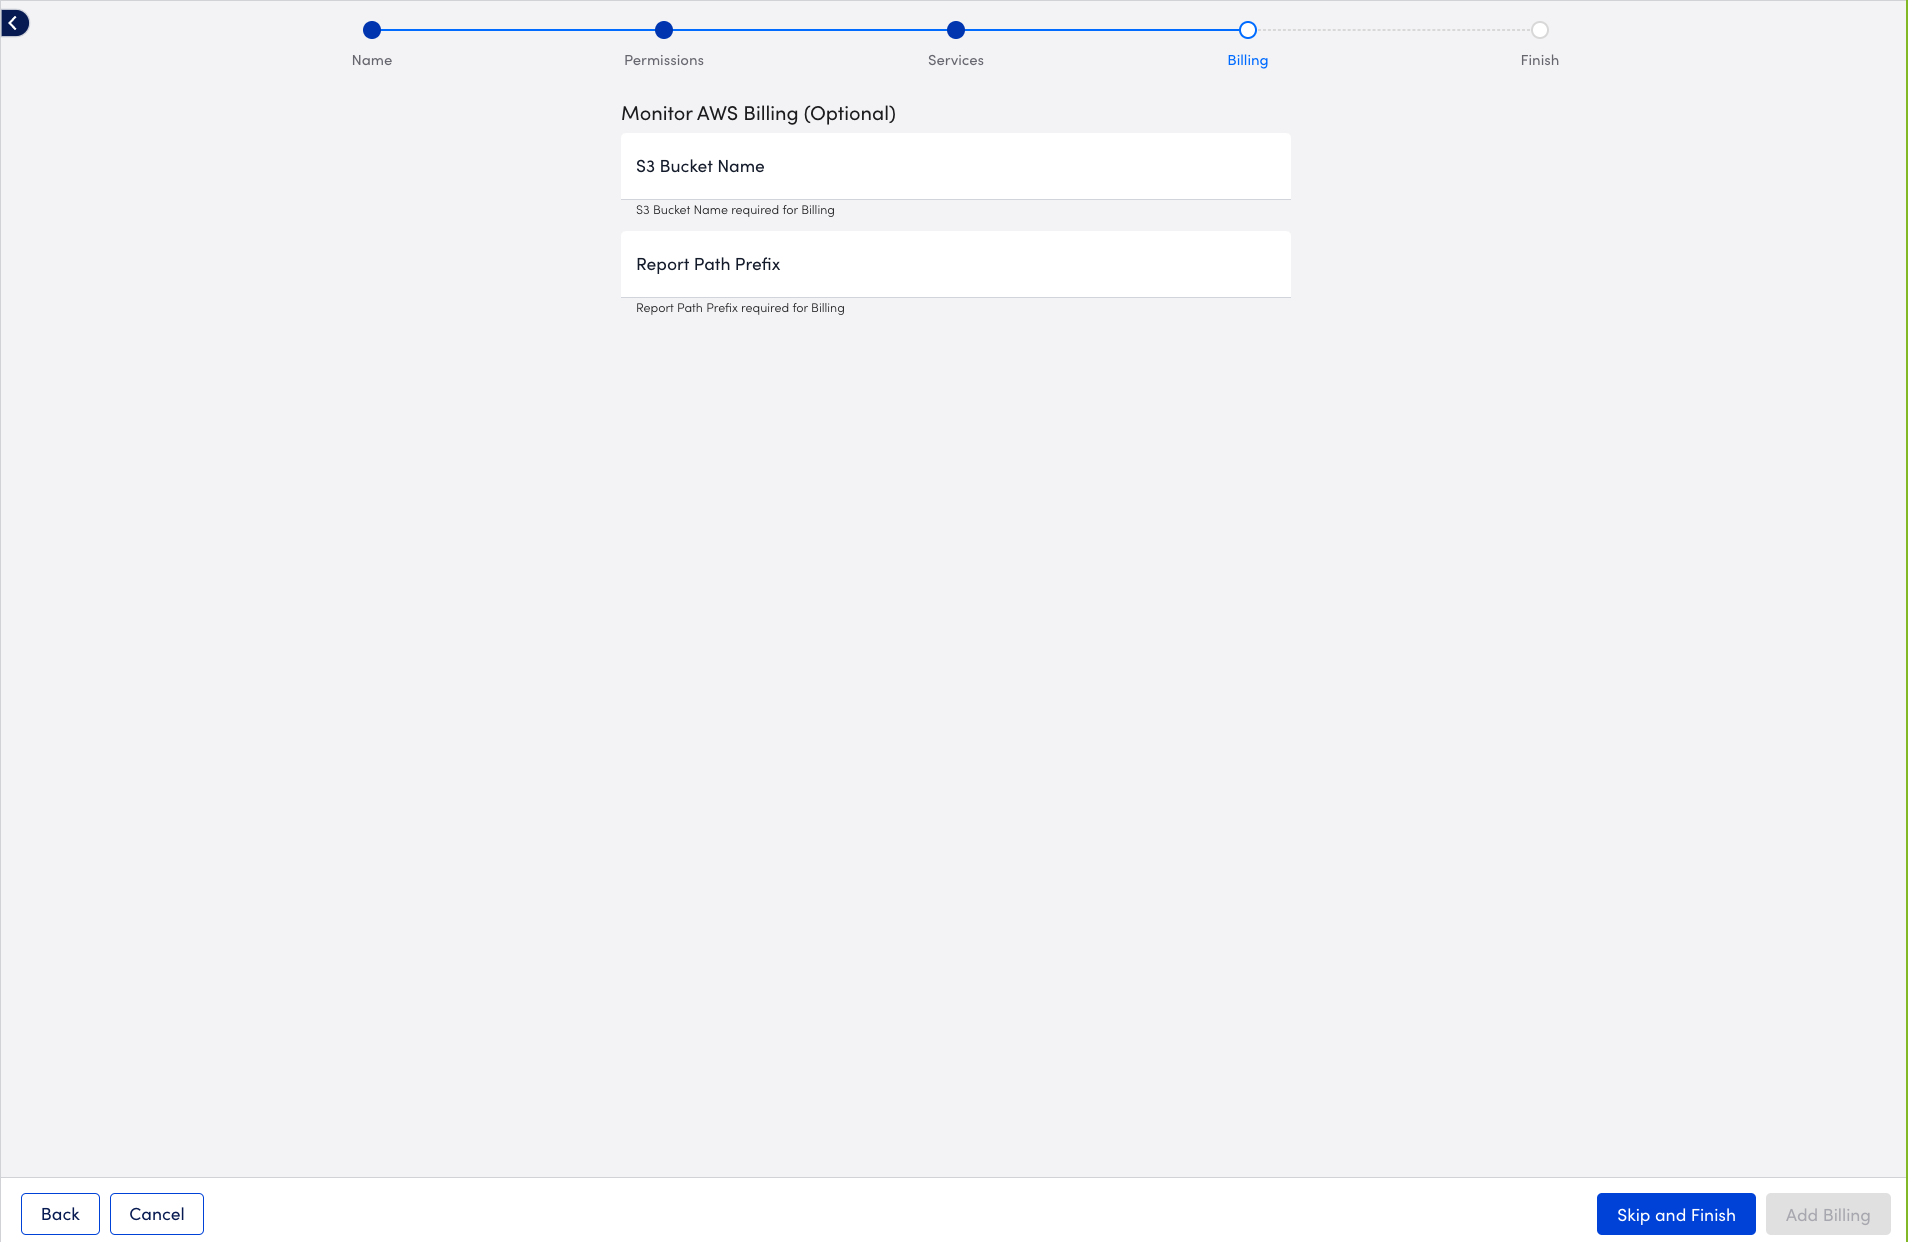
- To set up monitoring for AWS billing usage, select Next: Billing.
LogicMonitor supports monitoring of AWS billing data using AWS Cost and Usage Reports. For more information, see AWS Billing Monitoring Setup. - To finish adding the AWS account to LogicMonitor without setting up monitoring for AWS billing usage, select Skip and Finish.
- To set up monitoring for AWS billing usage, select Next: Billing.
Your AWS account is added to LogicMonitor for monitoring along with the services you want to monitor.
Additional Information
For more information, see the following: