Viewing Dashboards from a Mobile Device
Last updated - 23 July, 2025
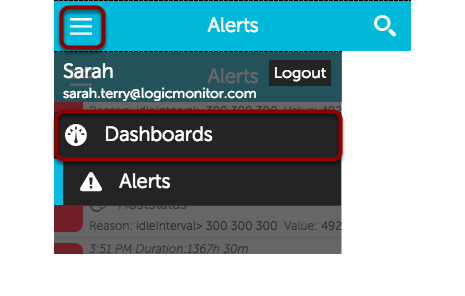
To view your dashboards, select the menu icon in the upper left corner of the alert list view, then select ‘Dashboards’:
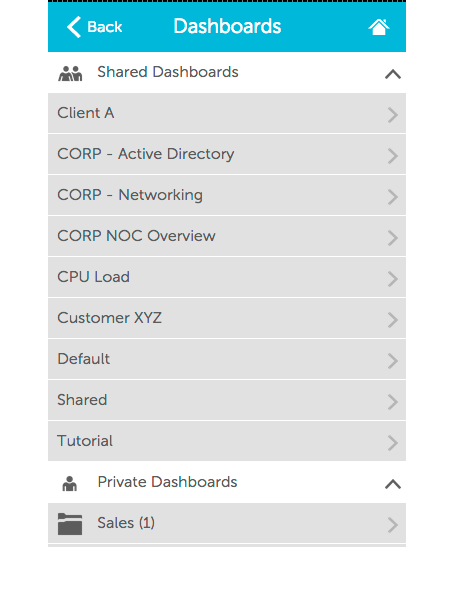
Select the dashboard you wish the view – note that only dashboards available according to your user’s role will be available for selection:
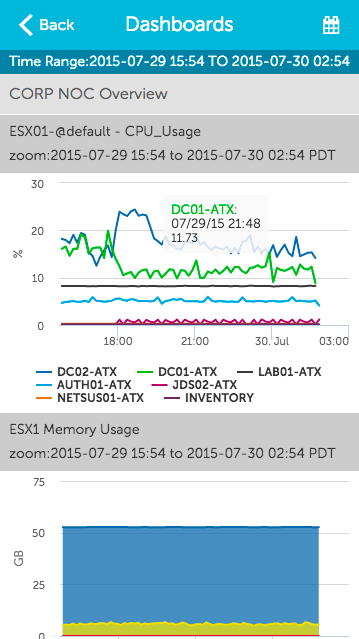
Select a point on a graph line to see the datapoint value. The widget headers display the widget names as they are configured in your account. The zoom field displays the defined time range.
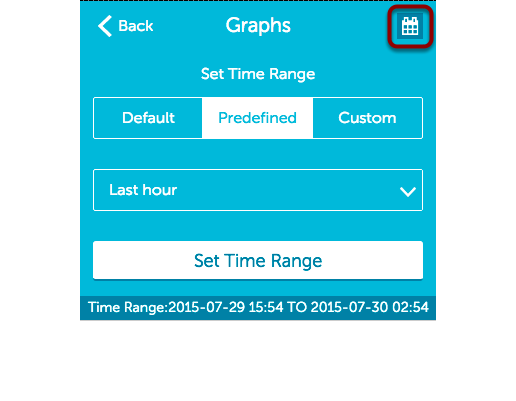
Adjusting the graph time range
To adjust the time range for the displayed graphs, select the calendar icon in the upper right hand corner and select the default time range (typically last 24 hours), choose a predefined time range, or specify a custom time range: