
Widgets Overview
Last updated – 17 March, 2026
Use widgets to display important monitoring data on dashboards. There are a variety of widget types that can display metrics, aggregate values, trends, statuses, relational values, and more.
For example, you can compare trends on multiple instances to spot anomalies, view meaningful KPIs to get an overall sense compared to status quo expectations, and view pivots of related metrics that are abnormal in their context.
Note: LogicMonitor provides a soft limit of 100 widgets per dashboard. For more information, see Limits, Quotas, and Constraints.
Widget Types
The following table lists the different types of widgets available in your LogicMonitor dashboard and different use cases for the widgets.
| Widget Type | Description |
| Alert List | Alerts based on a variety of filters. You can view status information. The Alert List widget is recommended for websites. |
| Advanced Metrics | Display an aggregation of metrics across multiple DataSources and visually represent the data similar to a Custom Graph widget, Big Number widget, Pie Chart widget, or a Gauge widget. |
| Big Number | One of four specific values which can be sum, min, max, or aggregate. |
| Custom Graph | Graph any combination of datapoints in one graph. View a single value and see how on or many values are trending. |
| Gauge | A speedometer view of individual or aggregate metric performance. Make a comparison between Custom Graph and Big Number widgets. Shows the big number value relative to a known min/max value (often 0-100, but not always). Also shows historical peak value, which provides some, but not all, of the context of the graph. |
| HTML | Embed any secure URL directly into your dashboard. Recommended for websites and for embedding external content. |
| Map | View status by location. Identify the physical location of the network device (when known) and identify root cause analysis. For example, all of the databases in Las Vegas are down but everywhere else is up, so maybe the facility lost power. |
| Netflow | Create any of the views currently visible under the Traffic tab for Netflow-enabled devices. For more information, see Viewing, Filtering, and Reporting on Netflow Data. |
| NOC | A visual representation of group, device, or application status. View status information. The NOC widget is recommended for websites. |
| Pie Chart | A useful way to display a metric in relation to other metrics. Most commonly used for network traffic. Compare multiple values in a single view. |
| Website Status | Displays the status of a website from multiple testing locations. You can view status information. Recommendation: Use the Website Status widget for websites. |
| SLA | Displays the percentage of time available for one or more devices per widget. This widget is recommended for websites. |
| Table | Displays datapoint values across multiple devices for performance and capacity comparison. Alert forecasting is enabled within the Table widget. For more information, see Alert forecasting. You can compare multiple values in a single view. |
| Text | Displays HTML text or images on your dashboard. Embed external content. |
| Topology Map | Reflects the relationships among resources in your network environment. |
Similar Widget Types
The following widgets take the same sampling data and display it in the following different ways:
- Big Number
- Custom Graph
- Gauge
- Pie Chart
- Table
Tokens in Widgets
The tokens defined in your Manage Dashboard form act as filters for each of the widgets added to the dashboard. For more information, see Dashboard Tokens. As a result, if you specify a resource group as the value for ##defaultResourceGroup##, only devices or cloud resources in that group will appear in the Resource lookup when configuring your widgets. To help add default or custom tokens, an Insert Token dropdown displays next to applicable widget fields containing all the tokens you’ve defined for this dashboard, its parent group, or any group in its lineage in the dashboard tree.
Note: When entering dashboard tokens into a widget field, keep in mind they are case sensitive. Entries not matching the token’s case result in a widget error.
Viewing Widgets
Expand widgets to view more information on the widget data and zoom in on important details. You can expand any widget by clicking the fullscreen icon in the upper right corner of the widget to get a more detailed view.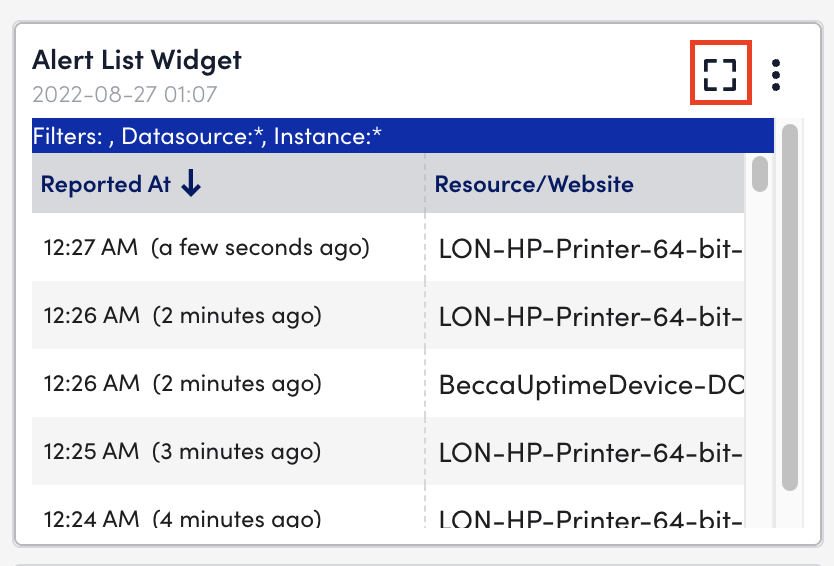
When graphs are expanded, you can view the underlying data. Hovering over a point in the graph will auto-scroll the data table and highlight the corresponding datapoint.
Auto Zoom in on Widgets
Highlight an area on a graph to automatically zoom in on graph details. You can do this on the standard or expanded widget view. After zooming, you can reset to the default. Zooming also freezes the time range, so the graph no longer receives updates to new data until you zoom out.
Widget Access URLs
Widgets can be shared externally to the LogicMonitor platform using widget access URLs. These launch from any LogicMonitor-supported browser version and display read-only versions of the shared widgets. Unliked shared dashboards, which only support a snapshot in time, shared widgets always reflect current conditions.
Your user account must have the appropriate dashboard permissions assigned in order to generate and manage widget access URLs. For more information, see Roles and Sharing Widgets and Widget Access URLs.
Note: Widget access URLs cannot be accessed by unauthorized external viewers. If the viewer of the widget access URL is logged into the portal from which the URL originated and has the appropriate permissions, actions (for example, following links to devices or topology maps) can be taken.
Widget access URLs can be disabled or deleted from a widget’s configurations, in the same dialog as originally generated. Deleting or disabling an embedded widget URL will not break any embedded links elsewhere. For more information, see Managing Widget Access URLs.
Additionally, you can view all generated widget access URLs across all shared widgets by navigating to Settings > User Access > Users & Roles > Widget Tokens. The Widget Tokens management page allows you to view details, sort, search, disable or enable, delete, and update the notes for existing widget access URLs.
