


With brand new monitoring for Azure Application Insights along with several enhancements to AWS, Azure, and GCP monitoring, LM Cloud users are going to love our v.115 release! Rolling out through February, v.115 also brings REST API, dashboard, and reporting improvements.
Read on to learn more about the enhancements that v.115 brings, as well as review two new major product features that LogicMonitor announced mid-January: LM Service Insight and Kubernetes Monitoring.
LM Service Insight
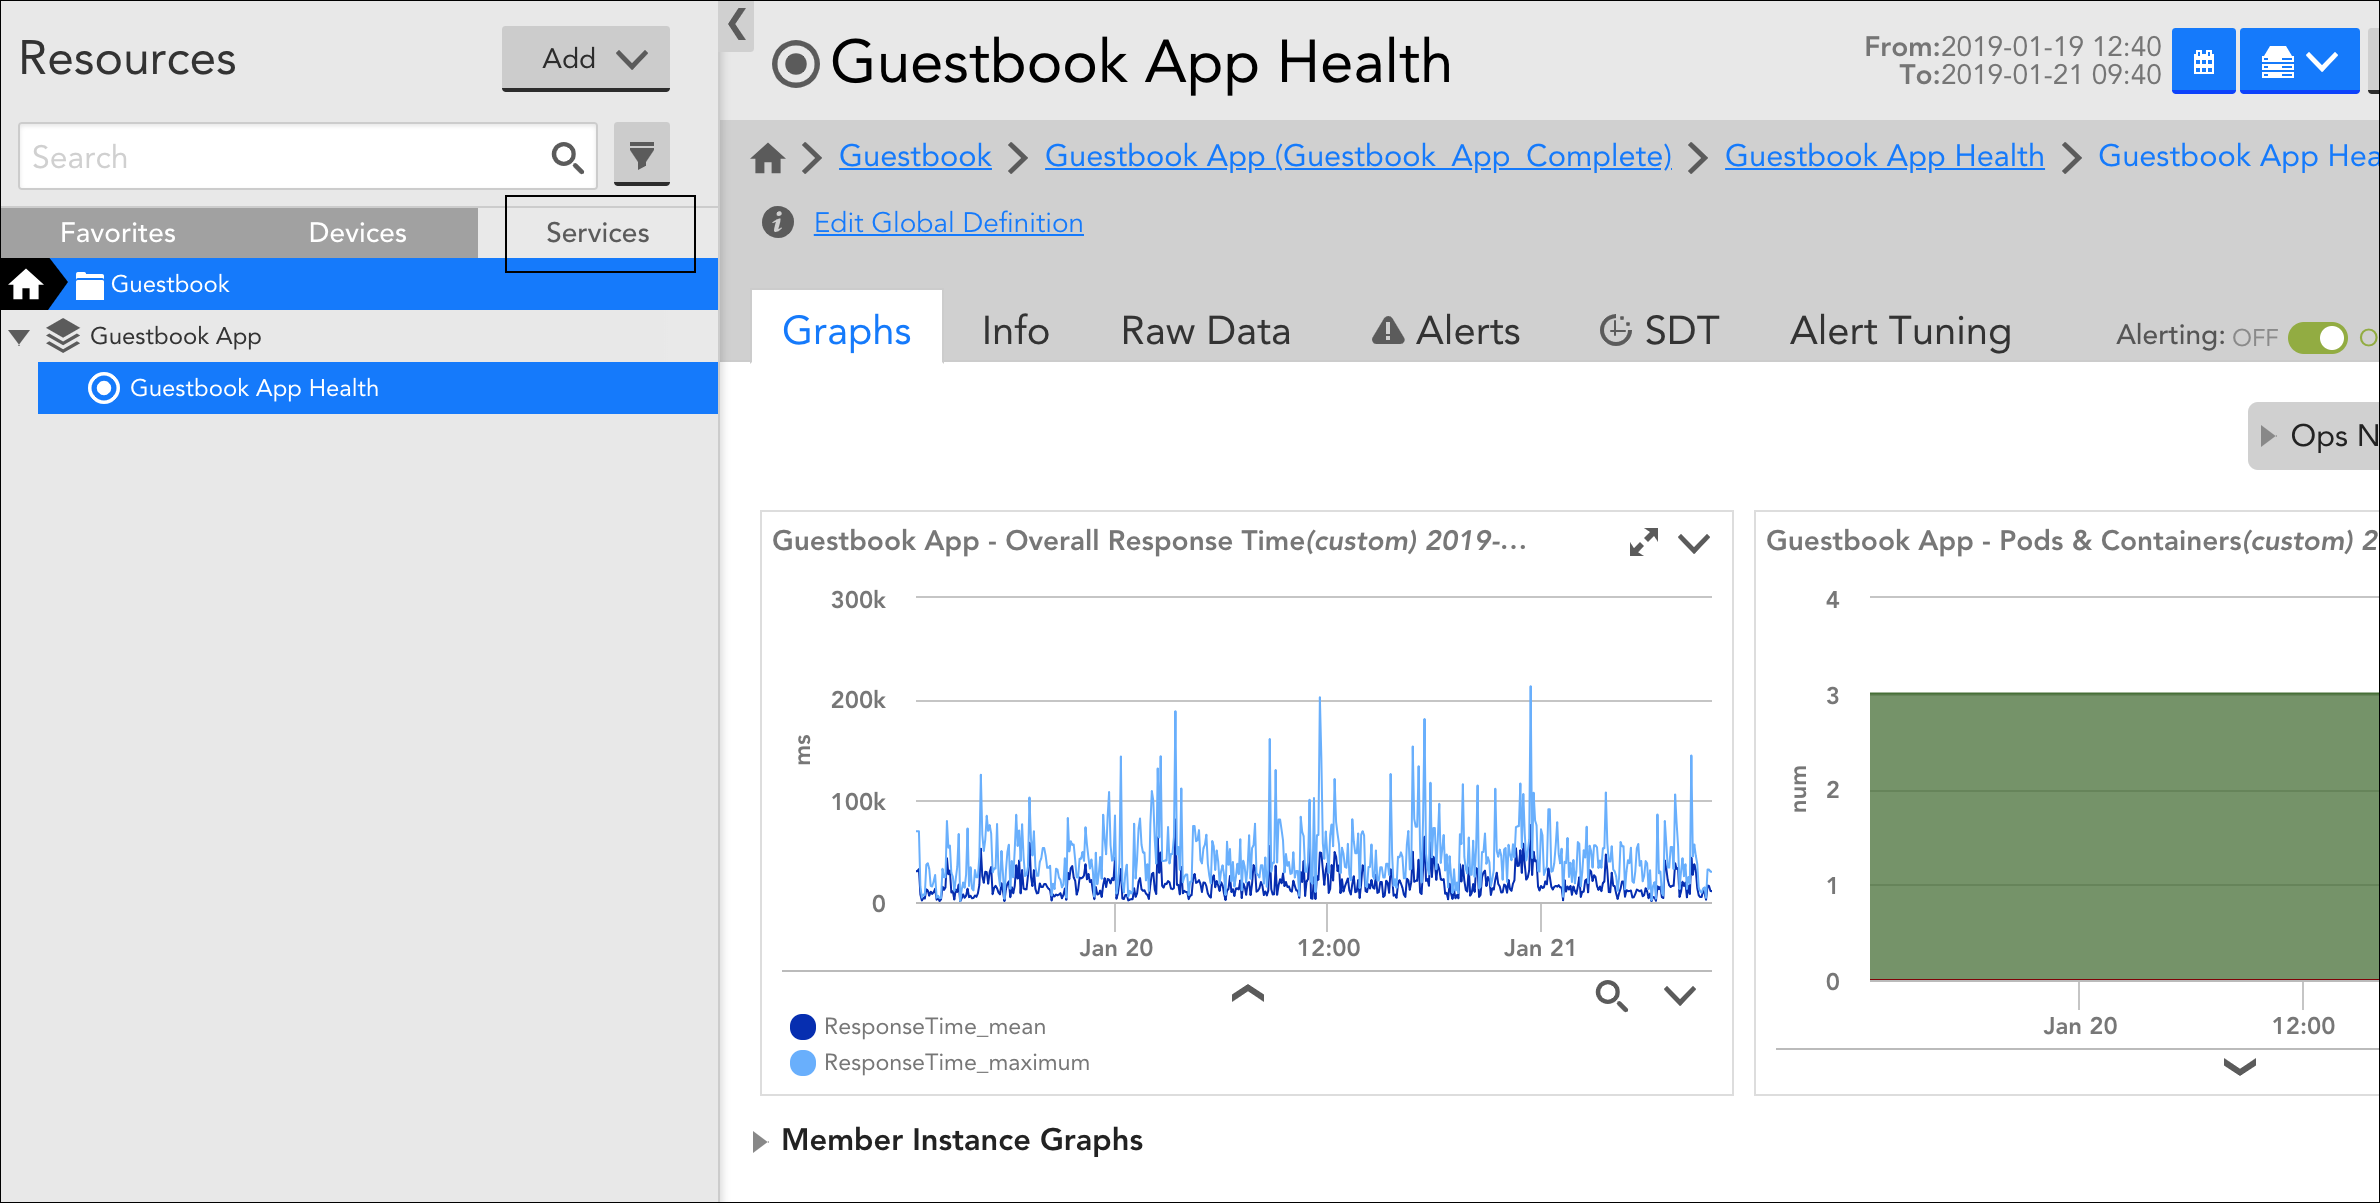
On January 15, we released LM Service Insight. LM Service Insight allows you to group together instances across one or more monitored resources (e.g. devices) into a logical “Service”; aggregate service level indicators across these instances to obtain service level data; and monitor, visualize, and alert on this service level data. You may find this service-level monitoring and alerting useful when the health of overall services is a higher priority than the health of individual monitored devices.
Kubernetes Monitoring
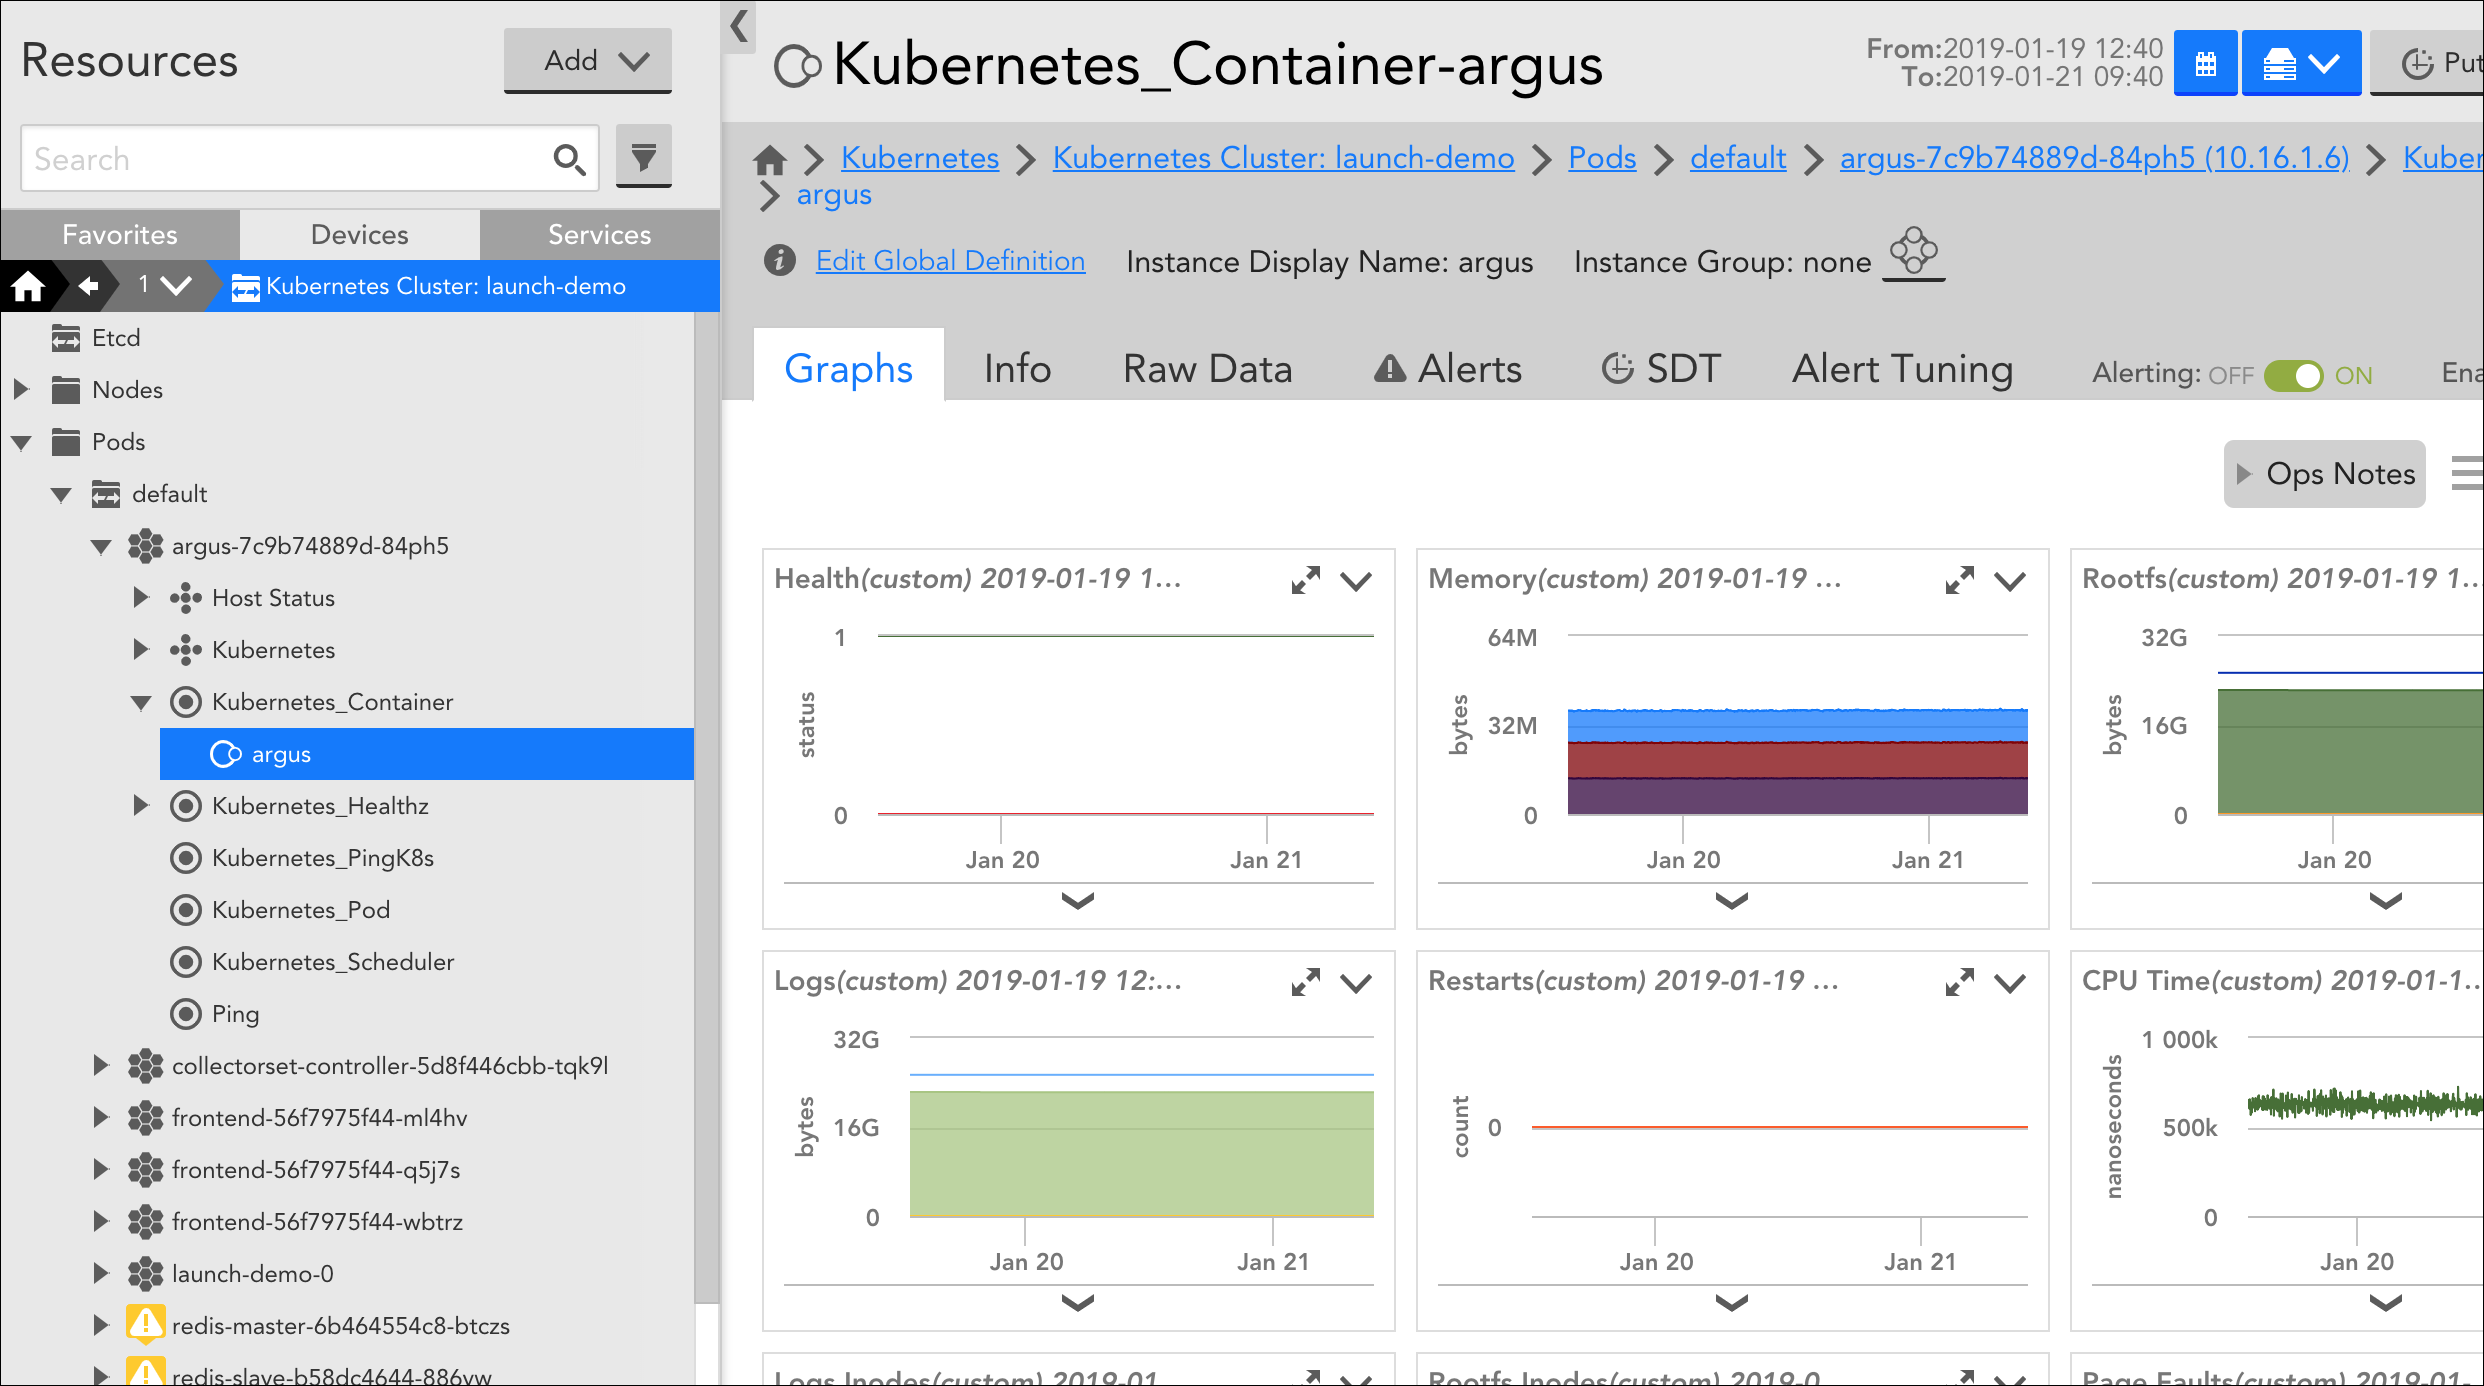
Also released on January 15, LogicMonitor’s new Kubernetes Monitoring integration provides comprehensive monitoring for Kubernetes clusters and the applications running within.
v.115 Improvements
LM Cloud
- Amazon Web Services (AWS) monitoring improvements
- AWS VPN tunnels. AWS VPN tunnels are now discovered as instances for the AWS_VPN DataSource. This enhancement enables you to get performance metrics per tunnel.
- Azure monitoring improvements
- NEW! Azure Application Insights monitoring. LogicMonitor now discovers Azure Application Insights components, and collects performance data for each component via Azure Monitor.
- Master SQL database no longer discovered for Azure’s Logical SQL service. LogicMonitor no longer discovers the master SQL database that resides behind the scenes of Azure’s Logical SQL service. Previously, this master SQL database was discovered and monitored, even though it wasn’t visible in the Azure UI.
- Google Cloud Platform (GCP) monitoring improvements
- New ILPs for GCP App Engine services. Environment and runtime instance-level properties (ILPs) are now automatically added for every version of GCP App Engine services.
- Reducer selection for Stackdriver data collection. Added the option to select a ‘reducer’ for Stackdriver data collection. This allows you to get metrics such as overall memory for App Engine Service versions, where there is a memory metric for each underlying VM.
- Counting cloud resources monitored via local LogicMonitor Collectors as devices. The count of cloud resources monitored via a local LogicMonitor Collector (e.g. AWS EC2 instances, Azure VMs, GCP Compute Engine instances) is now displayed as a sub-count in the overall ‘Devices’ count found under Settings | Account Information. Similarly, cloud resource counts are also now part of the standard device count that displays in the header of the resource tree (e.g. “(261 devices / 211 cloud resources)”). These changes were made to better align LogicMonitor’s in-application counts with its billing practices.
- DataSource removal when removing local Collector monitoring for cloud resources. When removing local Collector monitoring for cloud resources (e.g. AWS EC2 instances, Azure VMs, GCP Compute Engine instances), LogicMonitor didn’t always remove DataSources that applied based on system.sysinfo properties. This has been corrected.
REST API
- NetFlow DNS mapping support. LogicMonitor has published the ability to programmatically upload NetFlow DNS mappings in a CSV format via the LogicMonitor REST API v2.
- JSON templates available for dashboard groups. The LogicMonitor REST API v2 now provides JSON templates for dashboard groups. These are identical to the templates available via UI export.
Dashboards
- Dashboard widget sharing URL enhancement. The embedded sharing URL for dashboard widgets now uses token authentication. Widget tokens can be managed from the Configurations tab of individual widget’s settings or from the new Widget Tokens tab found in LogicMonitor’s user access settings (Settings | Users & Roles | Widget Tokens). For granular control, manage and view access for widget tokens is determined by role. Tokens can be disabled and reenabled, affecting their visibility in embedded areas or to other shared parties.
- NOC widget properly showing SDT status for subgroups. When grouping items in the NOC widget by group level, LogicMonitor now shows a status of SDT for subgroups whose parent groups are in SDT. Previously, in this context, SDT status didn’t properly cascade from parent groups to subgroups.
Reports
- New sorting options for Alerts report. When indicating sorting for the Alerts report, you now can additionally configure ascending or descending order. Also, piggybacking on the new secondary sorting for alert lists feature that was released in v.114, when you choose to sort the Alerts report by severity, secondary sorting by time began (in descending order) will automatically enable. For more information on configuring parameters for the Alerts report, see Alerts Report.
User Interface
- New position for alert icons in resources tree. The alert icons (as well as SDT icons with underlying alert severities) that display for resources have been moved to the far right-hand column of the resources tree. Previously, the alert icon would cover up the resource icon, making it more difficult for users to determine what type of resource was being alerted on.
- Status icons no longer propagate to parent nodes when groups are expanded. In the resources tree, status icons (e.g. collector dead, SDT, alert disabled, etc.) will no longer “bubble up” to the parent level when the group is expanded, unless the status is originating from that node. Status icons will continue to bubble up, however, when groups are collapsed.
- Search limited to 100 characters for Alerts, Audit Log, Collector Upgrade History, Collector Events, and Ops Notes, to ensure that a complex search does not impact User Interface performance.
Websites
- We’ve improved asynchronous Website read time reporting in the case where page redirection or authentication is invoked. Website performance graphs will now accurately reflect the time to read the first byte of the initial response to the last byte of the final response. Previously, only the time to read the first byte to the last byte of the first response was measured, even if redirection occurred after the initial step.
LogicModule Releases
Listed below are the new and improved LogicModules that were implemented since our last release.
New Monitoring Coverage
- Apache Solr & Eclipse Jetty – 19 DataSources, 4 PropertySources
- Supports versions 6.4 and newer
- Linux Chrony – 1 DataSource, 1 PropertySource
- Kubernetes Mapping & Topology – 10 DataSources, 3 PropertySources
Monitoring Improvements
- GCP Compute App Engine Versions – 1 DataSource
- Added memory usage datapoints and associated graphs.
- GCP Cloud SQL Database – 1 DataSource
- Added datapoints and graphs for database connection usage
- DataDomain Disks – 1 DataSource
- Improved alerting thresholds, alert message and graphs
- GCP Service Health – 1 EventSource
- Updated collection method
