Release Note


PRODUCT DOCUMENTATION
-
LogicMonitor Platform
- Introduction to LogicMonitor
- In-App Resources
-
Account Information
- Portal Information
- Portal Settings
- Financial
-
Usage Reporting
- Usage Reporting Overview
-
Product-Specific Usage Reporting
- Usage Reporting for APM Metrics
- Usage Reporting for LM Logs
- Usage Reporting for LM Uptime
- Usage Reporting for SaaS Monitoring
- Usage Reporting for IaaS Monitoring
- Usage Reporting for PaaS Monitoring
- Usage Reporting for APM Traces
- Usage Reporting for APM Synthetics
- Usage Reporting for Devices
- Usage Reporting for Websites
- Usage Reporting for Wireless Access Points
- Audit Logs
- Ops Notes
- Security Settings
- User Access
- Collectors
-
Dashboards
- Dashboards Overview
- Dashboard Creation
- Modern Dashboards
- Adding Dashboard Groups
- Finding Dashboards and Dashboard Groups
-
Widgets
- Widgets Overview
- Widgets Creation
- Widget Datapoint Configurations
-
Widget Types
- Alert List Widget
- Big Number Widget
- Netflow Widget
- NOC Widget
- Log Query Widget
- Pie Chart Widget
- Table Widget
- Text Widget
- Website Status Widget
- Custom Graph Widget
- SLA Widget
- Topology Map Widget
- Gauge Widget
- HTML Widget
- Job Monitor Widget
- Map Widget
- Resource Explorer Widget
- Recommendations Widget
- Billing Widget
- Widget Management
- Standard Widget Configurations
- Enabling Dashboard Text Widget Script Security
- Dashboard Management
- Dashboard Distribution
-
Resource Tree
- Navigating the Resources Page
- Changing the Time Range
- Remote Session
- Using Ops Notes
- Resources Details
- Resource Groups
- Resource Management
- NetScans
- Resource Explorer
- Services
- LM Uptime
-
Websites
- Data Monitored for Websites
- Websites Page Overview
- Alerting on Websites Data
- Trace Route for Websites
-
Websites Management
- Websites Default Settings
- Web Check
- Ping Check
- Testing the Steps of a Web Check
- Creating a Website Dashboard
- Website Properties
- Website Management
- Executing Internal Web Checks using Groovy Scripts
- Web Checks with Form-Based Authentication
- Websites SDT
- Disabling External Website Testing Location Across your Account
- Understanding Website Status Codes
- Websites Groups
- Mappings
- Alerts
-
Reports
- Choosing a Report Type
- Creating a Report Group
- Shared Report Access
-
Report Types
- Alert Forecast Report
- Alert SLA Report
- Alert HealthCheck Report
- Alert Thresholds Report
- Alert Trends Report
- Alerts Report
- Audit Log Report
- Dashboard Report
- Interface Bandwidth Report
- Log Query Report
- NetFlow Resource Metric Report
- Resource Group Inventory Report
- Resource Inventory Report
- Resource Metric Trends Report
- Role Report
- SDT Inventory Report
- Server CPU Report
- Service Level Agreement Report
- User Report
- Website Overview Report
-
Modules
- Modules Overview
- Modules Installation
- Custom Module Creation
- Tokens Available in LogicModule Alert Messages
- Deprecated LogicModules
- Data Collection Methods
- Active Discovery
- Groovy Support
-
Module Configurations
- Types of Modules
- DataSource
- PropertySource
- AppliesTo
- SNMP SysOID Map Configuration
- JobMonitor
- ConfigSource
- TopologySource
- EventSource
-
LogSource
- LogSource Overview
- Configuring a LogSource
- Kubernetes Event Logging LogSource Configuration
- Kubernetes Pods LogSource Configuration
- Log Files LogSource Configuration
- Script Logs LogSource Configuration
- SNMP Traps LogSource Configuration
- Supported MIBs for SNMP Trap Translation
- SNMP Trap MIBs
- Troubleshooting MIBs to JSON Converter Utility Issues
- Troubleshooting SNMP Traps Issues
- Modules Management
- Access Groups for Modules
- Security
-
LM Logs
- LM Logs Overview
- Log Ingestion
- Log Processing
- Logs Partition
- Log Anomaly Detection
- Log Analysis
- Viewing Logs and Log Anomalies
- Reset Log Anomaly Detection
- Log Patterns
- Log Query Language
- Log Processing Pipelines
- Log Alert Conditions
- Logs Roles and Permissions
- LM Logs Usage Data
- Troubleshooting Logs
-
Cloud Monitoring
- Introduction to Cloud Monitoring
- Cloud Services and Resource Units
- Monitored Locations for Cloud Monitoring
- Cloud Monitoring using a Collector for Existing Cloud Resources
- Monitoring Utilized Cloud Service Limits
- Custom Event Integrations Setup
-
Amazon Web Services Monitoring
- AWS Monitoring Setup
- AWS Organizational Unit Monitoring Setup
- Using StackSets to Automate Role and Policy Creation
- AWS Billing Monitoring Setup
- CloudWatch Costs Associated with Monitoring
- Managing your AWS devices in LogicMonitor
- AWS Tag Usage in LogicMonitor
- AWS Cost by Tag Monitoring
- Active Discovery and AWS CloudWatch Metrics
- Customizing AWS CloudWatch DataSources
- Troubleshooting Custom AWS CloudWatch DataSources
- Microsoft Azure Monitoring
- Google Cloud Platform Monitoring
- MongoDB Atlas Monitoring
- Cost Optimization
- Cloud Data Collection with Poll Now
- SaaS Monitoring
-
Edwin AI
- Introduction to Edwin AI
- Key Concepts in Edwin AI
- Edwin AI Roles and Users
- Configure Edwin AI Dashboard
- Edwin AI Models
- Configure Edwin AI Actions
- Edwin AI Rules
- Working with Edwin AI
- Export and Import Edwin AI Configuration
-
Edwin AI Integrations
- Edwin AI Integrations Overview
- Edwin AI Integration YAML File
- Edwin AI Custom Integrations
- Edwin AI Monitoring Integrations
-
Edwin AI IT Service Management Integrations
- LogicMonitor Data Exchange (LMDX)
- Edwin AI Microsoft Dynamics Integration
- Edwin AI PagerDuty Integration
- Edwin AI Jira Server Integration
-
LM Integrations
- LogicMonitor Integrations Overview
- Navigating the Integration Page
- Communications Integrations
- Workflow Integrations
- Automation Integrations
- Custom Integrations for LogicMonitor
- Logs for LM Integrations
-
Container Monitoring
- About LogicMonitor Container Monitoring
-
Kubernetes Monitoring
- Support Matrix for Kubernetes Monitoring
- Kubernetes and LM Containers Key Concepts and Terms
- Kubernetes Monitoring Considerations and Required Permissions
- Resource Sizing for Performance Optimization and Tuning Recommendations
- LM Container Installation
- LM Container Upgrade
- LM Container Uninstallation
- Existing Configuration Migration
- Kubernetes Events and Pod Logs Collection
-
Resource Monitoring
- Monitoring Helm Charts Releases
- Kubernetes Core Components Monitoring
- Monitoring Kubernetes Clusters with kube-state-metrics
- Filtering Kubernetes Resources for Monitoring
- NGINX Ingress Controller Monitoring
- Kubernetes Certificates and cert-manager Monitoring
- Disabling Alerts on Kubernetes Resources
- Default Filtering for Kubernetes Resources
- Filtering Kubernetes Resources using Labels, Annotations, and Selectors
- Disabling Resources from Monitoring
- Retention of Deleted Kubernetes Resources using LM Containers
- Retaining Deleted Kubernetes Resources
- Advanced Configuration
- Monitor Supported Resources
- Topology for Kubernetes Cluster
- Kubernetes Cluster Monitoring as Non-Admin User
- Troubleshooting Kubernetes Monitoring
- Docker Monitoring
-
LM APM
- LM APM Overview
- Quick Steps to Setup LogicMonitor APM
-
Push Metrics
- Getting Started with Push Metrics
- Use Cases for Push Metrics
- About the Push Metrics REST API
- Ingesting Metrics with the Push Metrics REST API
- Python SDK for Push Metrics API
- .NET SDK for Push Metrics API
- Managing Resources that Ingest Push Metrics
- Rate Limiting for Push Metrics
- Updating Instance Properties with the Push Metrics REST API
- Updating Resource Properties with the Push Metrics REST API
- OpenMetrics Integration
-
Distributed Tracing
- Distributed Tracing Overview
- Application Authentication Overview
- Traces Page
- Application Instrumentation for LogicMonitor
- Trace Data Forwarding to LogicMonitor
- OpenTelemetry Collector for LogicMonitor Overview
- Synthetics
-
Monitoring Solutions
- Apache
- APC
- AI Monitoring
- Atlassian
- AWS
- Azure
- Broadcom
- Cato Networks
- Checkpoint
-
Cisco
- Cisco APIC Monitoring
- Cisco ASA/ASR
- Cisco Catalyst Center
- Cisco Catalyst SD-WAN Monitoring
- Cisco CUCM API Monitoring
- Cisco Device SNMP and NTP Configuration
- Cisco Firepower Chassis Manager Monitoring
- Cisco Firepower Threat Defense Monitoring
- Cisco Hyperflex Monitoring
- Cisco Intersight Monitoring
- Cisco IP SLA Monitoring
- Cisco ISE Monitoring
- Cisco Meraki Monitoring
- Cisco UCCX Monitoring
- Cisco UCS Monitoring
- Cisco UCS X Monitoring
- Cisco Unified Call Manager (CUCM) Monitoring
- Cisco VoIP Monitoring
- Cisco Wireless Monitoring
- Citrix
- Cohesity
- Common Config
- CommVault
- ConnectWise
- Couchbase Server
- Dell Technologies
- Email Service
- Extreme Networks
- F5
- FreeBSD
- Fortinet
- HPE
- IBM
- IMPI
- Infinidat
- Infoblox
- Java
- Jenkins
- Juniper
- Kemp
- Kubernetes
- Linux
- LogicMonitor
- LSI MegaRAID Controller
- Microsoft
- MongoDB
- NetApp
- Network Traffic Monitoring
- NTP
- Nutanix Systems
- OpenAI
- Oracle
- Palo Alto Networks
- Panzura
- Perfmon Access
- Pick
- Puppet
- Pure Storage
- Quantum
- RabbitMQ
- Redis
- Rubrik
- Ruckus
- SAP
- Slack
- SSL
- SNMP
- Sonicwall
- SumoLogic
- SwiftStack
- Ubiquiti
- Unomaly
- Varnish
- Veeam
- Versa SD-WAN
- Mobile
-
Developer
-
LogicMonitor REST API
-
REST API Overview
- Using LogicMonitor's REST API
- Migration to LogicMonitor REST API v3
- REST API Change Log
- REST API Authentication
- REST API Status Codes
- REST API Error Codes
- REST API Rate Limit
- REST API Troubleshooting
-
REST API v3
- REST API v3 Swagger Documentation
- LogicMonitor v3 SDK
- REST API Basic Filters
- REST API Advanced Filters
- Creating Services Using LogicMonitor REST API v3
- Delta Support for device/devices API
- Best Practices for Migrating to LogicMonitor v3 SDK
-
REST API v3 Endpoints
- Managing Alerts
- Managing Alert Rules
- Managing Cost Optimization Recommendations
- Managing Recipient Groups
- Managing Roles
- Managing Ops Notes
- Managing Report Groups
- Managing Dashboard Groups
- Managing Collector Groups
- Managing ConfigSources
- Managing EventSources
- Managing Collector Debug Command
- Managing Collector Version
- Managing NetScan
- Managing PropertySources
- Viewing Metrics
- Viewing Integration Audit Logs
- Viewing External APIs
- Managing AppliesToFunction
- Managing Devices
- Managing DataSources
- Managing Escalation Chains
- Managing API Tokens
- Managing DataSource Instances
- Managing Dashboards
- Managing Users
- Managing Audit Logs
- Managing Data
- Managing Access Group
- Managing OIDs
- Managing Device Groups
- REST API v2
-
REST API v1
- REST API v1 Overview
- Getting Data with the REST API
-
REST API v1 Endpoints
- Managing Alert Rules
- Managing Alerts
- Managing API Tokens
- Accessing Audit Logs
- Managing Collectors
- Managing Collector Groups
- Managing Dashboards and Widgets
- Managing Dashboard Groups
- Managing DataSources
- Managing DataSource Instances
- Managing Devices
-
Managing Device Groups
- About the Device Group Resource
- Add a Device Group
- Add Device Group Properties
- AWS Device Groups
- Azure Device Groups
- Delete Device Group Properties
- Delete a Device Group
- GCP Device Groups
- Get all alerts for a Device Group
- Get all SDTs for a Device Group
- Get Device Group Properties
- Get Device Groups
- Get devices for a particular device group
- Update a Device Group
- Update Device Group Properties
- Managing Escalation Chains
- Managing Ops Notes
- Managing Reports
- Managing Report Groups
- Managing Roles
- Managing SDTs
- Managing Websites
- Managing Website Groups
- Getting Websites Test Locations
- Managing Thresholds
- Managing Users
-
REST API Overview
- Scripting Support
- HAR File in LogicMonitor
-
LogicMonitor REST API
- Policies and Compliance
- Training and Education
-
Legacy UI
- Getting Started
- Devices
- Dashboards and Widgets
- AIOps
- LM Service Insights
- LogicModules
- Terminology and Syntax
- LM APM
-
Cloud Monitoring
-
Getting Started with LM Cloud
- LM Cloud Monitoring Overview
- Enabling Cloud Monitoring using Local Collector
- Visualizing your cloud environment with auto dashboards and reports
- Setting up custom event integrations
- Monitoring Cloud Service Limit Utilization
- Optimizing your Cloud Spend
- Cloud Data Collection
- Amazon Web Services Monitoring
- Google Cloud Platform Monitoring
- MongoDB Atlas Monitoring
-
Getting Started with LM Cloud
- Container Monitoring
- Monitoring Solutions
The v.72 release will be rolled out through mid February. Among the expected ongoing improvements and bug fixes, it brings you Collector Groups and an in product integration with ServiceNow. As of this release, the Alerts page will no longer be available in the old UI.
Collector Groups
Collector group functionality brings a variety of benefits, from streamlining account management to more flexible end user permissions.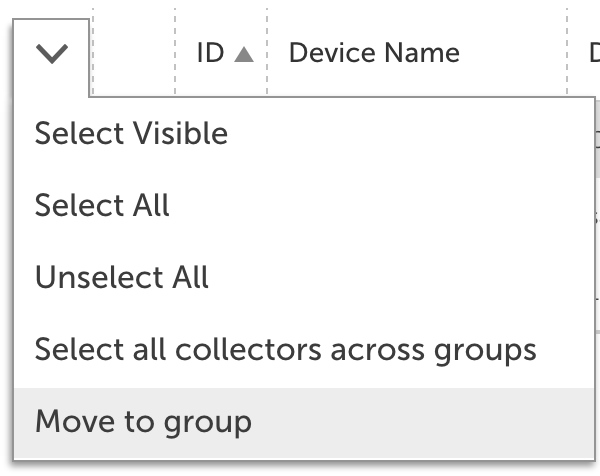
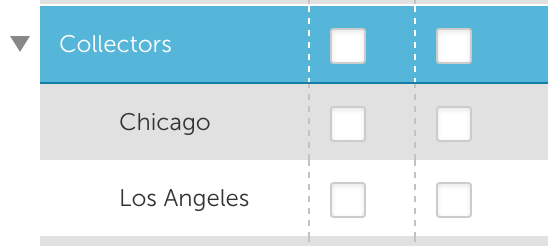
To add a collector group, navigate to Settings | Collectors and select Add | Collector Group. Once a group has been added, you can add collectors by selecting the checkbox next to existing collectors and selecting Move to Group from the collector management dropdown.
 Once your collectors have been organized by group, you can assign roles specific view and manage permissions. A combination of the collector group permissions and device permissions will effect how a user can interact with collectors within the account.
Permissions summary:
- Users with manage rights to a collector group can add devices to a collector, update collectors, and perform actions associated with the collectors within the Settings page. A user must have manage rights to a group to add a new collector, or move an existing collector into a group.
- Users with view rights to a collector group can see the associated collectors within the Settings page, but cannot make any changes or updates. If the user has rights to manage devices, the associated collectors will be available in the manage device window.
- To give a user permission to assign devices to a set of collectors but not to view the collectors themselves, assign view rights to the collector group and disable the Settings page from the user account.
- When viewing or managing collectors from Settings | Collectors, the device list will only include devices the user has rights to view.
Collector Groups and Devices:
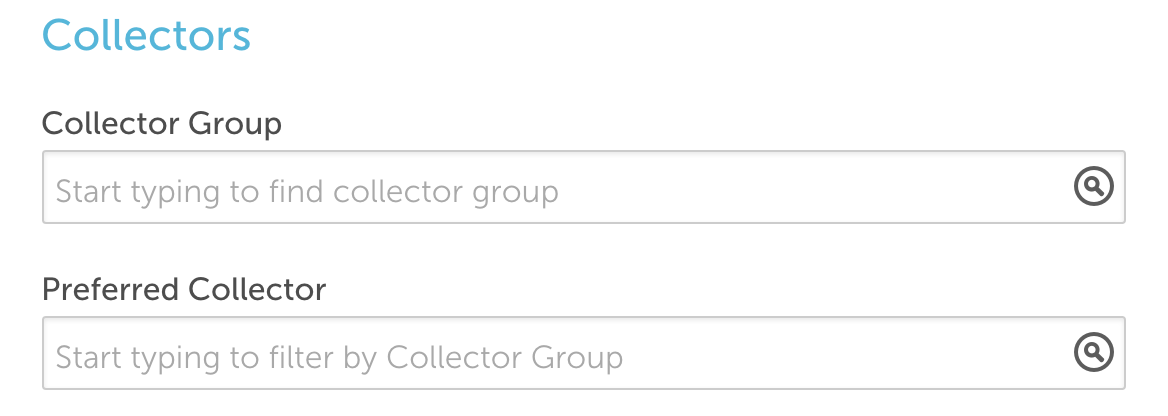
Collector groups can be used to filter the list of available collectors when adding or managing a device. Users will only see the collector groups if their role has view permissions.
If a user does not have view permissions to the collector that is currently assigned, the collector will display in the manage window. The collector can be updated based on collector groups the user has rights to, however the user will not be able to change it back to a collector where view permissions are not assigned.
New Services Testing Location – Australia
A new testing location is available for Services checks, Australia – Sydney. This will be disabled by default, to avoid the generation of unexpected alerts. To enable it for your account, click on your account name in the Services tree and select Manage. Check the Australia option, which will make it a configuration option for your defaults and specific Services settings.
ServiceNow Integration
While we have offered an API based ServiceNow integration for some time, this release brings the integration directly into the product, simplifying configuration and allowing for customization of real time updates of ServiceNow incidents based on device and alert status. See our documentation for more details.
Multiple Integrations per Ticketing System
The initial rollout of our ConnectWise, AutoTask, and other workflow systems only allowed for one integration for each type. You can now create multiple integrations, allowing for different alert configuration for each company or by alert type.
Pre-Filter Network Traffic Data on your Dashboard
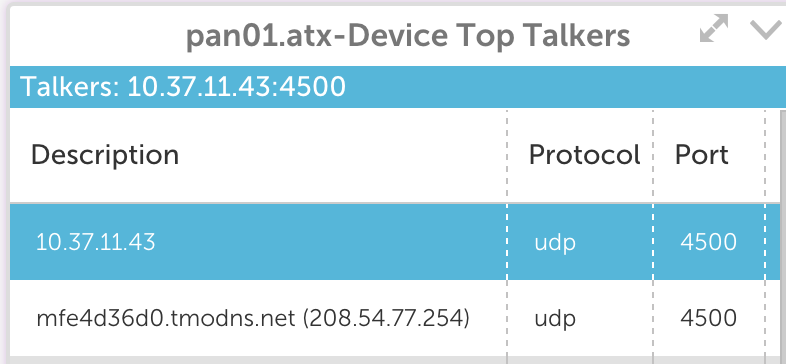
If there are common filters you apply when looking at Network Traffic data, you can now pin these directly to a dashboard. Once a filter is set in the Traffic Tab, select add to Dashboard from the widget dropdown. Make sure Apply current filters is checked, and the applied filter will display in the header of your dashboard widget.
Website Overview Report
We’ve added some extremely useful configuration options for the website overview report. Rather than sift through a plethora of graphs and data, you can select if you are interested in Overall or Overall & Individual details, along with limiting it to Alerts, Availability, or Graph data.
Other Improvements:
- The Instances tab is available at the Instance Group level. It has also been updated to always reference instance value.
- An instance group can be created directly from the device tree by dragging one instance on top of another.
- A new time zone selector is available in the Account Information page. Not only do we think it looks cool, it provides the foundation for more time zone specific functionality going forward.
- AWS resources in the Seoul zone (ap-northeast-2) can now be discovered and monitored.
- Current password is required if a user updates their password from the edit profile link.
- An effective interval has been added to batch job alerts, allowing users to auto-clear alerts based on time or condition.
- Increased the allowable length of the description field for widgets.
- The company name displayed throughout your account can now be set from Settings | Account Information. We previously displayed the name in the account URL as the company name, which didn’t work well for company names that are long and/or contain spaces.
- Improved error messaging for virtual and complex datapoint configuration and for failures when adding a device via the API.
- Acknowledged by and acknowledged on columns can be resized in the alerts table.
- Legend status (open vs. collapsed) is preserved during page refresh.
- When creating roles, existing roles can be cloned to simplify the configuration process.
- Alert severity can now be defined directly in a script eventsource, and will continue to use the default severity if one is not assigned. This requires EA collector 20.0074 and higher.
- The alerts table was updated to focus the device tree on the specific LogicModule when a link is selected from a batchjob or eventsource alert.
- The global option for suppress alert clears has been removed, as it predated the option to configure alert clears per alert rule and resulted in unnecessary confusion.
- A dashboard widget that does not reference any active instances will now display “No Active Instances” in place of the general widget error.
- A time range filter is available for collector logs, which isn’t valuable often – but is extremely valuable when it matters.
- Additional restrictions added to graph line and datapoint name configuration, such as RRD, to avoid conflicts in the API
- In the devices page, added total alert count to the alerts tab for the Account and Group levels.
- The examples provided in the collector debug window have been updated.
- The ping datasource has been updated to always send 10 packets. This is to avoid any issues with tasks frequently scheduled by the application.
- Validation has been added to the cron scheduler for batchjobs.
- Severity, Alert Rule, and Escalation chain filters are available in the alert report
- Performance optimizations for dashboards, the users page, and the group graphs tab.
- There is a new option to ignore SSL errors in Services configuration, which is on by default for existing services. An upcoming update to the testing locations will have enhanced SSL monitoring, this option avoids any unexpected new alerts.
- Minor updates to printed reports, device tree functionality, instance group display, table widget configuration, and alert severity icons.
- The SSO / SAML configuration has been updated to work in conjunction with the whitelist.
Bugs Fixed:
- In Settings | Datasources,when viewing associated devices the count did not update if the filter for devices with active instances was applied.
- Alert clears were not delivered via the new HTTP integrations.
- If an aggregation method is selected for a datapoint, an aggregate method is required. If no aggregation method was assigned, the data point would not display.
- Sorting alerts on the Alerts Page by Cleared On date was not working correctly for Eventsource alerts. This has been corrected.
- Device subgroup permissions were not saved correctly on role refresh.
- The collector fail back process has been fixed to account for a large number of devices needing to be reassigned to a primary collector.
- The Alerts Page Datapoint filter was previously not providing suggested results for Log File Eventsources. Monitored log files are now included in the suggested results for this filter.
- Some datasource and instance tokens were not displaying the token value in graph legends.
- AWS CloudWatch API requests were not always throttled correctly, resulting in potential gaps in graphs for large AWS groups.
- If a report was created with a duplicate report name, the user had to start over. Configuration details are now preserved.
- Creating a datasource with the TCP collection method was not returning the expected raw data due to an internal issue with the datapoint configuration. This also requires EA collector 20.074 or higher.
- Custom HTTP integrations would send a request to LogicMonitor even if the method was set as Get. This could result in configuration issues, and has been updated.
- Correction to the display of NetAppVolPerf active discovery parameters.
- The SDT time displayed in the Device header did not always respect the account time zone.
- A handful of configuration issues related to how tables were displayed and refreshed have been improved, including refreshing to page 1 when tuning alerts for datasources with many datapoints.
- Selecting an instance from device search without updating the tree resulted in the manage device selection not working correctly.
- Importing script eventsources from XML occasionally failed due to an XML parsing error.
- Adding a note to an active alert would also acknowledge the alert. This has been corrected, and an entry is added in the access log when the note is updated.
- The alert report did not include alerts generated by services in a subgroup if the subgroup was not explicitly included, and did not save the In SDT filter setting.
- Special characters in a services step URL resulted in the inability to edit the step.
- The alert widget only displayed top 30 alerts, the limit has been removed.
- The EC2 and CloudWatch device dashboard depended on the All Datasources device dashboard to be present. It now is derived directly from the devices.
- Custom HTTP integrations were defaulting back to different alert post data per alert type, even if same was selected.
- Instance groups were not displayed correctly on the Group | Graphs tab. All instances were displayed under each group.
- Users with permission to manage some device groups were unable to Force Datasource Re-Match
- Disabling certain collector logging components would result in an error that prohibited saving
- Multiple netflow widgets could not be added to a dashboard from the same device.
- The CPU Usage graph for the Xen Host CPU datasource was incorrectly displaying no data for certain time ranges.
- Virtual datapoints were not being calculated correctly in a few rare cases with EA collector 20.074.
