v.98 Release: Overhauled Support Flow and Improved AWS Billing Monitoring
Last updated on 14 September, 2022We made it! The end of 2017 is upon us, as is the last release of the year. We are finishing 2017 on a high note with several major improvements to our platform. Among the changes are an overhauled in-app support flow as well as [even more] cloud monitoring coverage, specifically for AWS Billing.
v.98 will be rolled out through mid-December.
Improved AWS Billing Monitoring
We have added support for AWS billing monitoring via the AWS Cost & Usage report. Although we have monitored AWS billing data for a long time via the AWS Detailed Billing Report, this new method is more dynamic and comprehensive. We have released a new set of multi-instance DataSources for this feature which monitor cost by account, region, service and operation by default. All instances are auto-discovered. A new multi-instance “Cost By Tag” DataSource has also been published. You will find these new DataSources useful for tracking cost per account for consolidated billing setups, cost by region and service, and to see what operations (across services) are requiring the most spend.
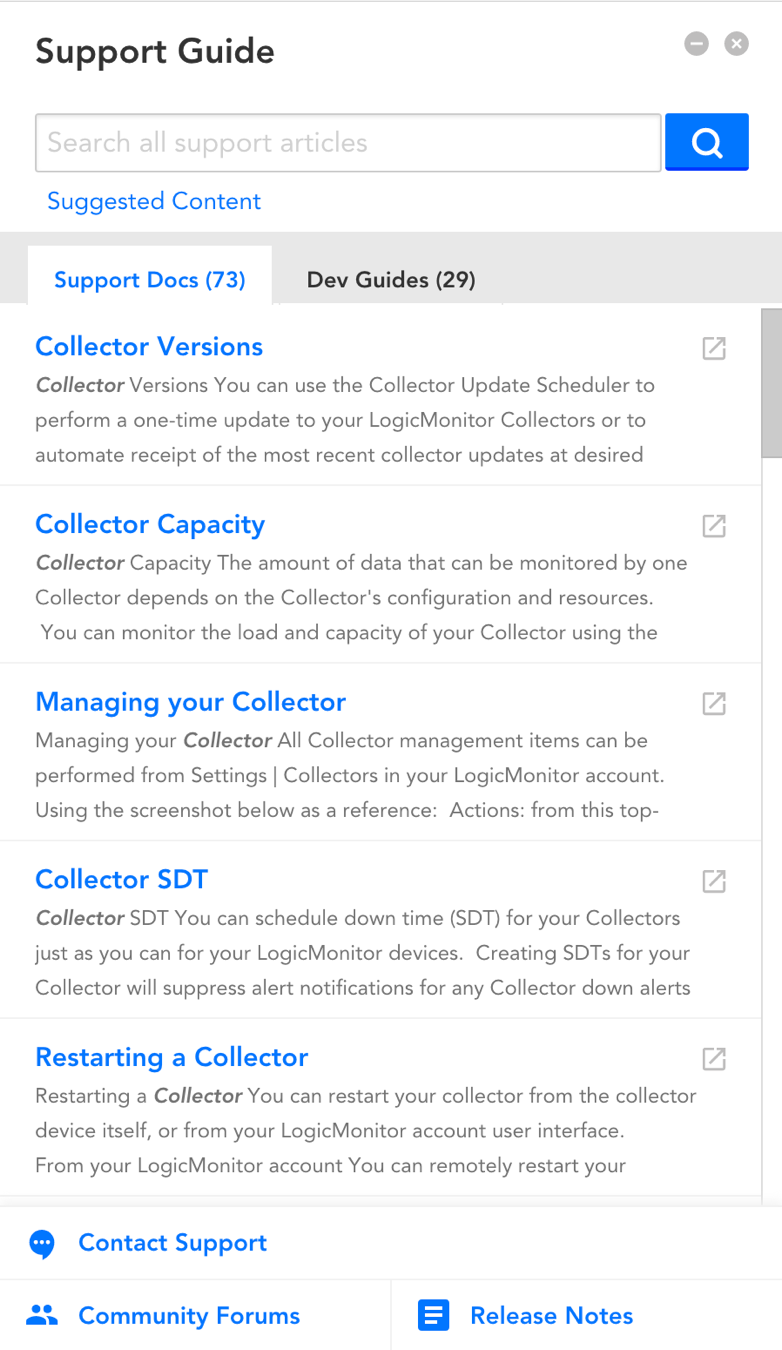
We have implemented a brand new support flow in our platform! The new design is more consistent with the rest of our UI and includes several key functionality improvements, including:
- Auto-suggested resources: we will display suggested support articles based on one’s location in the UI at the time of clicking “Support.” The screenshot to the right was taken from Settings | Collectors.
- View articles in-app: clicking the article’s preview will display the full document in the support dialog. If desired, one can click the
 icon in the article preview to view a document on our support site.
 - Article Feedback: at the base of each article is a feedback section, which enables users to provide comments if an article requires updating.
- Centralized “Contact Support” section: Chat with an Engineer, Feedback, and Submit a Support Ticket are all located under the “Contact Support” button within the Support Dialog. We will be removing the old “Feedback” button located at the bottom right of our platform.
- Full accessibility: “Support” is now accessible from everywhere within our platform. One can open the Support Dialog from all configuration dialogs, lightboxes, and pages within our platform.
Other Improvements:
Alerts
- The Alert message for SSL Certificate Expiration messages has been refined.
- Escalation Chains can now be Cloned to save time when creating many complex chains.
- When a device is moved between groups it will properly alert (or clear alerts) based on new effective alert thresholds.
Collector
- When adding a Collector, we will remember your preferred platform, version, and size settings for future Collector Adds.
- Minor changes to the Add Collector dialog to streamline the workflow for new users.
- Buttons on Add Collector screen now have useful PowerShell command and download URL. PowerShell can save time by bypassing cumbersome steps and prompts in Internet Explorer.
Dashboards
- Links will be disabled in the NOC and Alerts widgets if the user doesn’t have viewing permission to view the link destination (service or device).
- Dashboard tokens can no longer have empty values. To remove a dashboard token, simply delete it from the Token Table.
- There is now an option to use comma separators to format numbers on the Big Number Widget for improved readability of large numbers.
- We have added the option to hide items at 0% from the Pie Chart Widget. If this option is selected, we’ll hide datapoints with a value of 0 from the pie chart and the legend.
- We have added more granular control over widget sizes! You can now fit four equal-width widgets across a Dashboard.
- We removed the checkbox to “Show Dashboard title & navigation” in full screen mode, and added a more intuitive display control arrow when full screen mode is active. You can click this arrow to dynamically show/hide the header.
Devices
- You can now manually add instance level properties (ILPs)! We previously restricted ILP creation to be via Active Discovery in a DataSource. ILPs can now be added manually from the Instances Tab for a multi-instance DataSource (via Manage Instance) or from the Info Tab for any instance (via the Manage icon on the custom properties table). You may find this useful for configuring instance-specific metadata where the metadata isn’t available programmatically – e.g. a custom bandwidth or speed on an interface.
- IP addresses now sort numerically instead of alphabetically.
- Forecast graphs now have an additional method for ‘line of best fit’ and increase the forecast from 3 months to 12 months.
- Columns were added/changed on “Unmonitored devices” list including “Detected type” and “Manufacturer of network” to help determine if and where you want to add them to monitoring.
- New accounts come with a dynamic Device Group titled “Devices by Type”. Many of our new Auto-Dashboards will rely on these groups.
Integrations
- Improved Error message when trying to delete Integrations that are still in use on Escalation Chains.
LM Cloud
- Added support for monitoring and discovering AWS WorkSpace Directories. Monitored WorkSpaces will be auto-grouped under their associated directory.
- We’ll now add instance level properties (ILPs) to discovered EC2 reserved instance offers. These ILPs contain information about the offer payment option, term, start time, expire time, offering class and platform. You may find this useful for reporting across EC2 reserved instance offers (e.g. with the Device Inventory Report).
- Cloud devices scheduled for deletion will now have a property system.cloud.autodeleteon that displays the time at which the device will be deleted. You may find this useful for identifying and keeping track of when devices are scheduled for deletion.
- Stopped and terminated resource counts are displayed in the Account Information table. You can use this information to keep an eye on unmonitored resources and potentially change how resources are automatically deleted from your account
*Note that we previously announced an LM Cloud feature that allowed users to choose to continue data collection for stopped and terminated cloud resources, which enables more comprehensive status monitoring. Due to performance concerns and other unforeseen complications, this feature has been removed from v98 and will be re-introduced in a future release.
Reports
- Website Overview Report now supports Internal Service Checks.
Users and Roles
- When assigning permissions within the Manage Role dialog, device subgroups will be sorted in alphabetical order.
Settings
- Previously, logged-in users that did not check “Reme
mber me” were not logged out after 30 minutes if they left their account on a page with an auto-refresh. Sessions are now logged out properly if there is no user interaction on the page. To keep a session logged in (ie. for dashboard slideshows) please be sure to click “Keep me signed in” (this button has replaced “Remember me”).
Bugs Fixed
- Certain properties (state, public IP, private IP) were not always being discovered for Azure VMs without diagnostics enabled.
- We previously didn’t stop data collection when tag filters were changed and a cloud device was marked dead as a result of being filtered out. Data is no longer collected for such instances.
- In some cases, ElastiCache and Redis nodes weren’t being deleted from LogicMonitor. This was due to a bug in the script-based Active Discovery method for AWS Redis and ElastiCache DataSources. With the v98 release, we’ll be publishing a new set of AWS Redis and ElastiCache DataSources that rely on a LogicMonitor maintained Cloud Collector for discovery.
- The Remote Session option was previously only displaying at the LogicModule level for cloud devices, and now displays at the device level as well.
- Adding other monitoring (processes and services) wasn’t always working for cloud devices. This was a result of the hostname not being sent to the Collector, and has been corrected.
- ACK emails sent from certain versions of the Outlook Desktop client were not properly acknowledging alerts.
- When clicking “logout,” the sessionID will now be cleared properly.
- Changes to usernames were previously breaking escalation chains in some cases.
- Disabling local Collector monitoring for EC2 instances or VMs wasn’t always dissociating DataSources in alert. To correct for this, disabling local Collector monitoring will now result in the removal of any custom system.categories values assigned at the cloud device level.
- A request to get alerts for a non-existent device (GET /device/devices/{id}/alerts) wasn’t returning an error code consistent with other resources. Requests for non-existent resources now result in an error of 1069 – “no such resource”.
LogicModule Releases
Below is a list of new and improved LogicModules that were implemented since our last release:
New Monitoring Coverage
- AWS WorkSpaces – 1 DataSource
- Azure VM Resource Health – 1 DataSource
- AWS Cost by (Region, Tag, Service, Operation, Account) – 5 DataSources
- Azure Analysis Services – 1 DataSource
- Azure Blob Storage – 1 DataSource
- Azure File Storage – 1 DataSource
- AWS Direct Connect – 1 DataSource
- Azure Storage Account – 1 DataSource
- Azure Queue Storage – 1 DataSource
- Azure Table Storage – 1 DataSource
- AWS IAM Service Limits – 1 DataSource
- Microsoft Windows DHCP – 2 DataSource + 1 PropertySource
- Meraki Teleworker Gateways (Z) – 2 DataSources
Monitoring Improvements
EMC Storage Pools
- Fixed datapoint alert message and thresholds.
AWS Cost by Service
- Fixed ‘rdsCost’ datapoint JSON path
VMware vSphere Hardware Sensors
- Fixed typo in alert message that broke a token
WinPhysicalDrive
- Improved descriptions, graphs and alerting
HPE ConfigSource
- Improved prompt detection routines
AWS SQS
- Datapoint and graph improvements
WinLogicalDrive
- Graph and datapoint improvements
MongoDB and MongoDB Replication
- Solved issue where repeated script failures could exhaust inodes on the Collector
Meraki
- Added support for SNMP V3
- Fixed missing instances bug
- Various datapoint and graph improvements.