Release Note


-
LogicMonitor Platform
- Introduction to LogicMonitor
- In-App Resources
-
Account Information
- Portal Information
- Portal Settings
- Financial
-
Usage Reporting
- Usage Reporting Overview
-
Product-Specific Usage Reporting
- Usage Reporting for APM Metrics
- Usage Reporting for LM Logs
- Usage Reporting for LM Uptime
- Usage Reporting for SaaS Monitoring
- Usage Reporting for IaaS Monitoring
- Usage Reporting for PaaS Monitoring
- Usage Reporting for APM Traces
- Usage Reporting for APM Synthetics
- Usage Reporting for Devices
- Usage Reporting for Websites
- Usage Reporting for Wireless Access Points
- Audit Logs
- Ops Notes
- Security Settings
- User Access
- Collectors
-
Dashboards
- Dashboards Overview
- Dashboard Creation
- Modern Dashboards
- Adding Dashboard Groups
- Finding Dashboards and Dashboard Groups
-
Widgets
- Widgets Overview
- Widgets Creation
- Widget Datapoint Configurations
-
Widget Types
- Alert List Widget
- Big Number Widget
- Netflow Widget
- NOC Widget
- Log Query Widget
- Pie Chart Widget
- Table Widget
- Text Widget
- Website Status Widget
- Custom Graph Widget
- SLA Widget
- Topology Map Widget
- Gauge Widget
- HTML Widget
- Job Monitor Widget
- Map Widget
- Resource Explorer Widget
- Recommendations Widget
- Billing Widget
- Widget Management
- Standard Widget Configurations
- Enabling Dashboard Text Widget Script Security
- Dashboard Management
- Dashboard Distribution
-
Resource Tree
- Navigating the Resources Page
- Changing the Time Range
- Remote Session
- Using Ops Notes
- Resources Details
- Resource Groups
- Resource Management
- NetScans
- Resource Explorer
- Services
- LM Uptime
-
Websites
- Data Monitored for Websites
- Websites Page Overview
- Alerting on Websites Data
- Trace Route for Websites
-
Websites Management
- Websites Default Settings
- Web Check
- Ping Check
- Testing the Steps of a Web Check
- Creating a Website Dashboard
- Website Properties
- Website Management
- Executing Internal Web Checks using Groovy Scripts
- Web Checks with Form-Based Authentication
- Websites SDT
- Disabling External Website Testing Location Across your Account
- Understanding Website Status Codes
- Websites Groups
- Mappings
- Alerts
-
Reports
- Choosing a Report Type
- Creating a Report Group
- Shared Report Access
-
Report Types
- Alert Forecast Report
- Alert SLA Report
- Alert HealthCheck Report
- Alert Thresholds Report
- Alert Trends Report
- Alerts Report
- Audit Log Report
- Dashboard Report
- Interface Bandwidth Report
- Log Query Report
- NetFlow Resource Metric Report
- Resource Group Inventory Report
- Resource Inventory Report
- Resource Metric Trends Report
- Role Report
- SDT Inventory Report
- Server CPU Report
- Service Level Agreement Report
- User Report
- Website Overview Report
-
Modules
- Modules Overview
- Modules Installation
- Custom Module Creation
- Tokens Available in LogicModule Alert Messages
- Deprecated LogicModules
- Data Collection Methods
- Active Discovery
- Groovy Support
-
Module Configurations
- Types of Modules
- DataSource
- PropertySource
- AppliesTo
- SNMP SysOID Map Configuration
- JobMonitor
- ConfigSource
- TopologySource
- EventSource
-
LogSource
- LogSource Overview
- Configuring a LogSource
- Kubernetes Event Logging LogSource Configuration
- Kubernetes Pods LogSource Configuration
- Log Files LogSource Configuration
- Script Logs LogSource Configuration
- SNMP Traps LogSource Configuration
- Supported MIBs for SNMP Trap Translation
- SNMP Trap MIBs
- Troubleshooting MIBs to JSON Converter Utility Issues
- Troubleshooting SNMP Traps Issues
- Modules Management
- Access Groups for Modules
- Security
-
LM Logs
- LM Logs Overview
- Log Ingestion
- Log Processing
- Logs Partition
- Log Anomaly Detection
- Log Analysis
- Viewing Logs and Log Anomalies
- Reset Log Anomaly Detection
- Log Patterns
- Log Query Language
- Log Processing Pipelines
- Log Alert Conditions
- Logs Roles and Permissions
- LM Logs Usage Data
- Troubleshooting Logs
-
Cloud Monitoring
- Introduction to Cloud Monitoring
- Cloud Services and Resource Units
- Monitored Locations for Cloud Monitoring
- Cloud Monitoring using a Collector for Existing Cloud Resources
- Monitoring Utilized Cloud Service Limits
- Custom Event Integrations Setup
-
Amazon Web Services Monitoring
- AWS Monitoring Setup
- AWS Organizational Unit Monitoring Setup
- Using StackSets to Automate Role and Policy Creation
- AWS Billing Monitoring Setup
- CloudWatch Costs Associated with Monitoring
- Managing your AWS devices in LogicMonitor
- AWS Tag Usage in LogicMonitor
- AWS Cost by Tag Monitoring
- Active Discovery and AWS CloudWatch Metrics
- Customizing AWS CloudWatch DataSources
- Troubleshooting Custom AWS CloudWatch DataSources
- Microsoft Azure Monitoring
- Google Cloud Platform Monitoring
- MongoDB Atlas Monitoring
- Cost Optimization
- Cloud Data Collection with Poll Now
- SaaS Monitoring
-
Edwin AI
- Introduction to Edwin AI
- Key Concepts in Edwin AI
- Edwin AI Roles and Users
- Configure Edwin AI Dashboard
- Edwin AI Models
- Configure Edwin AI Actions
- Edwin AI Rules
- Working with Edwin AI
- Export and Import Edwin AI Configuration
-
Edwin AI Integrations
- Edwin AI Integrations Overview
- Edwin AI Integration YAML File
- Edwin AI Custom Integrations
- Edwin AI Monitoring Integrations
-
Edwin AI IT Service Management Integrations
- LogicMonitor Data Exchange (LMDX)
- Edwin AI Microsoft Dynamics Integration
- Edwin AI PagerDuty Integration
- Edwin AI Jira Server Integration
-
LM Integrations
- LogicMonitor Integrations Overview
- Navigating the Integration Page
- Communications Integrations
- Workflow Integrations
- Automation Integrations
- Custom Integrations for LogicMonitor
- Logs for LM Integrations
-
Container Monitoring
- About LogicMonitor Container Monitoring
-
Kubernetes Monitoring
- Support Matrix for Kubernetes Monitoring
- Kubernetes and LM Containers Key Concepts and Terms
- Kubernetes Monitoring Considerations and Required Permissions
- Resource Sizing for Performance Optimization and Tuning Recommendations
- LM Container Installation
- LM Container Upgrade
- LM Container Uninstallation
- Existing Configuration Migration
- Kubernetes Events and Pod Logs Collection
-
Resource Monitoring
- Monitoring Helm Charts Releases
- Kubernetes Core Components Monitoring
- Monitoring Kubernetes Clusters with kube-state-metrics
- Filtering Kubernetes Resources for Monitoring
- NGINX Ingress Controller Monitoring
- Kubernetes Certificates and cert-manager Monitoring
- Disabling Alerts on Kubernetes Resources
- Default Filtering for Kubernetes Resources
- Filtering Kubernetes Resources using Labels, Annotations, and Selectors
- Disabling Resources from Monitoring
- Retention of Deleted Kubernetes Resources using LM Containers
- Retaining Deleted Kubernetes Resources
- Advanced Configuration
- Monitor Supported Resources
- Topology for Kubernetes Cluster
- Kubernetes Cluster Monitoring as Non-Admin User
- Troubleshooting Kubernetes Monitoring
- Docker Monitoring
-
LM APM
- LM APM Overview
- Quick Steps to Setup LogicMonitor APM
-
Push Metrics
- Getting Started with Push Metrics
- Use Cases for Push Metrics
- About the Push Metrics REST API
- Ingesting Metrics with the Push Metrics REST API
- Python SDK for Push Metrics API
- .NET SDK for Push Metrics API
- Managing Resources that Ingest Push Metrics
- Rate Limiting for Push Metrics
- Updating Instance Properties with the Push Metrics REST API
- Updating Resource Properties with the Push Metrics REST API
- OpenMetrics Integration
-
Distributed Tracing
- Distributed Tracing Overview
- Application Authentication Overview
- Traces Page
- Application Instrumentation for LogicMonitor
- Trace Data Forwarding to LogicMonitor
- OpenTelemetry Collector for LogicMonitor Overview
- Synthetics
-
Monitoring Solutions
- Apache
- APC
- AI Monitoring
- Atlassian
- AWS
- Azure
- Broadcom
- Cato Networks
- Checkpoint
-
Cisco
- Cisco APIC Monitoring
- Cisco ASA/ASR
- Cisco Catalyst Center
- Cisco Catalyst SD-WAN Monitoring
- Cisco CUCM API Monitoring
- Cisco Device SNMP and NTP Configuration
- Cisco Firepower Chassis Manager Monitoring
- Cisco Firepower Threat Defense Monitoring
- Cisco Hyperflex Monitoring
- Cisco Intersight Monitoring
- Cisco IP SLA Monitoring
- Cisco ISE Monitoring
- Cisco Meraki Monitoring
- Cisco UCCX Monitoring
- Cisco UCS Monitoring
- Cisco UCS X Monitoring
- Cisco Unified Call Manager (CUCM) Monitoring
- Cisco VoIP Monitoring
- Cisco Wireless Monitoring
- Citrix
- Cohesity
- Common Config
- CommVault
- ConnectWise
- Couchbase Server
- Dell Technologies
- Email Service
- Extreme Networks
- F5
- FreeBSD
- Fortinet
- HPE
- IBM
- IMPI
- Infinidat
- Infoblox
- Java
- Jenkins
- Juniper
- Kemp
- Kubernetes
- Linux
- LogicMonitor
- LSI MegaRAID Controller
- Microsoft
- MongoDB
- NetApp
- Network Traffic Monitoring
- NTP
- Nutanix Systems
- OpenAI
- Oracle
- Palo Alto Networks
- Panzura
- Perfmon Access
- Pick
- Puppet
- Pure Storage
- Quantum
- RabbitMQ
- Redis
- Rubrik
- Ruckus
- SAP
- Slack
- SSL
- SNMP
- Sonicwall
- SumoLogic
- SwiftStack
- Ubiquiti
- Unomaly
- Varnish
- Veeam
- Versa SD-WAN
- Mobile
-
Developer
-
LogicMonitor REST API
-
REST API Overview
- Using LogicMonitor's REST API
- Migration to LogicMonitor REST API v3
- REST API Change Log
- REST API Authentication
- REST API Status Codes
- REST API Error Codes
- REST API Rate Limit
- REST API Troubleshooting
-
REST API v3
- REST API v3 Swagger Documentation
- LogicMonitor v3 SDK
- REST API Basic Filters
- REST API Advanced Filters
- Creating Services Using LogicMonitor REST API v3
- Delta Support for device/devices API
- Best Practices for Migrating to LogicMonitor v3 SDK
-
REST API v3 Endpoints
- Managing Alerts
- Managing Alert Rules
- Managing Cost Optimization Recommendations
- Managing Recipient Groups
- Managing Roles
- Managing Ops Notes
- Managing Report Groups
- Managing Dashboard Groups
- Managing Collector Groups
- Managing ConfigSources
- Managing EventSources
- Managing Collector Debug Command
- Managing Collector Version
- Managing NetScan
- Managing PropertySources
- Viewing Metrics
- Viewing Integration Audit Logs
- Viewing External APIs
- Managing AppliesToFunction
- Managing Devices
- Managing DataSources
- Managing Escalation Chains
- Managing API Tokens
- Managing DataSource Instances
- Managing Dashboards
- Managing Users
- Managing Audit Logs
- Managing Data
- Managing Access Group
- Managing OIDs
- Managing Device Groups
- REST API v2
-
REST API v1
- REST API v1 Overview
- Getting Data with the REST API
-
REST API v1 Endpoints
- Managing Alert Rules
- Managing Alerts
- Managing API Tokens
- Accessing Audit Logs
- Managing Collectors
- Managing Collector Groups
- Managing Dashboards and Widgets
- Managing Dashboard Groups
- Managing DataSources
- Managing DataSource Instances
- Managing Devices
-
Managing Device Groups
- About the Device Group Resource
- Add a Device Group
- Add Device Group Properties
- AWS Device Groups
- Azure Device Groups
- Delete Device Group Properties
- Delete a Device Group
- GCP Device Groups
- Get all alerts for a Device Group
- Get all SDTs for a Device Group
- Get Device Group Properties
- Get Device Groups
- Get devices for a particular device group
- Update a Device Group
- Update Device Group Properties
- Managing Escalation Chains
- Managing Ops Notes
- Managing Reports
- Managing Report Groups
- Managing Roles
- Managing SDTs
- Managing Websites
- Managing Website Groups
- Getting Websites Test Locations
- Managing Thresholds
- Managing Users
-
REST API Overview
- Scripting Support
- HAR File in LogicMonitor
-
LogicMonitor REST API
- Policies and Compliance
- Training and Education
-
Legacy UI
- Getting Started
- Devices
- Dashboards and Widgets
- AIOps
- LM Service Insights
- LogicModules
- Terminology and Syntax
- LM APM
-
Cloud Monitoring
-
Getting Started with LM Cloud
- LM Cloud Monitoring Overview
- Enabling Cloud Monitoring using Local Collector
- Visualizing your cloud environment with auto dashboards and reports
- Setting up custom event integrations
- Monitoring Cloud Service Limit Utilization
- Optimizing your Cloud Spend
- Cloud Data Collection
- Amazon Web Services Monitoring
- Google Cloud Platform Monitoring
- MongoDB Atlas Monitoring
-
Getting Started with LM Cloud
- Container Monitoring
- Monitoring Solutions
We’re very excited to announce the arrival of API Tokens. Although they’re only available for the limited number of Rest API calls currently available, they were a necessary obstacle before we published the full REST suite – which is scheduled for this year. We’ve also added the ability to view and manage previously run reports, access invoice history, and the expected slew of improvements and bug fixes.
Please Note: We are on track to fully disable access to the old UI in the next few months. Settings will be disabled in v.76 and Dashboards in v.77 (pending a few remaining speed improvements, in addition to those made in this release). Devices will follow shortly thereafter, we need your feedback if there is any reason you rely on the old view.
API Tokens
We recently started publishing v1 of our REST API, which we think you’ll find to be a vast improvement over our RPC API. This release introduces API Tokens and a new REST API token authentication method. This API token authentication method is more secure than Basic Authentication and will enable you to control and monitor which users in your account are using LogicMonitor’s REST API.
You’ll notice a new API Tokens section for Users that enables you to add and manage API Tokens for that user, and a new Role permission for the ability to create API Tokens. Additionally, a new API Tokens tab will now be displayed in the Users & Roles section, allowing you to see information about all API Tokens used in your account. API Tokens will assume the role of the user they were created for, and can be disabled, but not deleted.
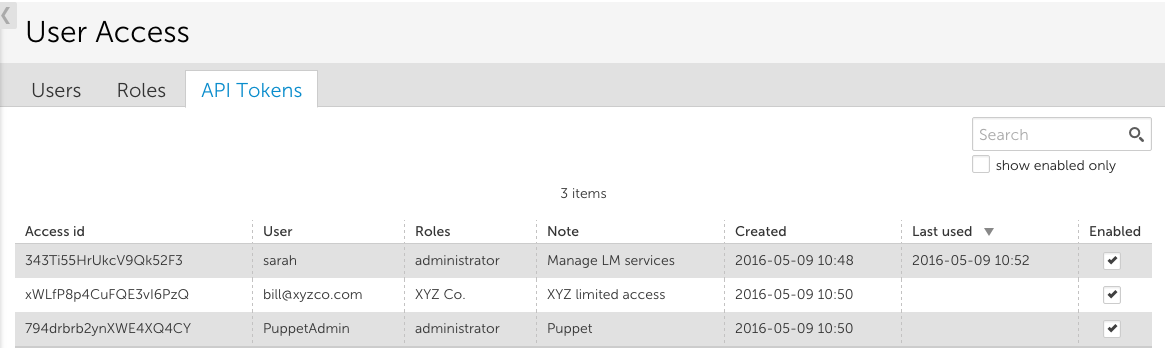
Given that the token authentication is more secure, it is also a bit more complicated to use, so you’ll want to read our detailed documentation before trying it out. We plan on completing the v1 rollout of our REST API by the end of the year – stay tuned for resources published over the next couple of releases.
Note: we will continue to support Basic Authentication with username and password for now, but it will likely be deprecated sometime after a complete v1 of our REST API is published. As such, we highly recommend using API Tokens to authenticate REST requests where possible.
Manage Report Links
We recently introduced hosted reports, by which we store generated reports for 30 days. This included the ability to generate reports that exceed standard email server size limits, and to easily share reports with a link.
We’ve added the ability to view, share, and delete previously generated reports from the Reports page.
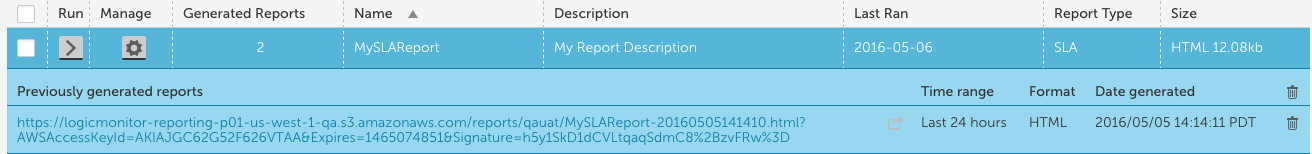
After running a report, the Generated Reports count will increment, and can be selected to view links to previously run reports. The link can be selected to display the report inline, copied to be shared with other users, or the arrow can be selected to view the report in a new window. Deleting the link will remove the report from the list and from the LogicMonitor repository.
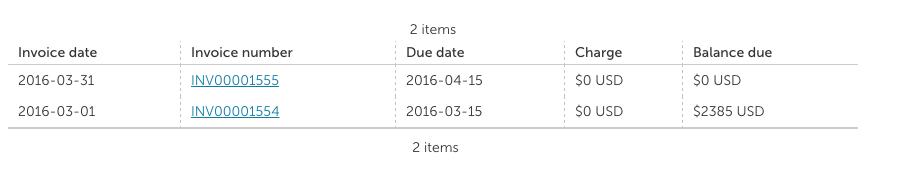
Invoice History
The details available in Settings | Account Information have been split into three pages, Contact Information, Portal Settings, and Financial. From the Financial section you can update payment information as well as access your last 12 invoices.
Virtual Datapoint
There has been some inconsistency about how virtual datapoints can be used throughout the application. The functionality has been unified, guaranteeing a virtual datapoint can now refer to any previously defined datapoint (virtual or otherwise). This will be available for everything from widget configurations to datasource graphs.
Other Improvements
- General
- Manual entries allowed for SDT start and end times.
- The Datasource | datapoints table was reformatted, to ensure the most relevant information is displayed at a glance. This includes displaying the Post Processor detail and raw metric information for all datapoints.
- Alert throttle messages have been rewritten for clarity.
- Alert Table
- Added the ability to copy text from the alerts page, without immediately opening the alert details
- A new column is available for “full path”, if you want to display the parent and all subgroups.
- The entire row will be highlighted on check, emphasizing what has been selected.
- Clicking within the checkbox column will not open alert details
- Selecting a device from the table navigates the user to the device with the alerting instance and graphs selected.
- The full date has been added for the current day, to ensure all details are available in screenshots or copied rows.
- A two second delay has been added to the alert table refresh after an alert is acknowledged or a note has been updated, to ensure the update happens after the data has been written to the alert table.
- Added the ability to sort by datasource, acknowledged by, and acknowledged on for alerts table.
- Collectors
- Can search devices associated with a collector from Settings | Collectors | Devices.
- Collector group was added as a filter for collectors in the device wizard, netscan policy, and manage collector screen.
- Datasources & Eventsources
- Information, FailureAudit and SuccessAudit have been removed as options for the Windows Eventsource Level filter. Level filters set to these values always had to be used in conjunction with an event ID, making them superfluous.
- Event alert history has always been kept for 30 days, subject to a rolling maximum of 51,200 events per account. We’ve decreased the number of events removed when the 51,200 limit is reached.
- A more helpful error message is displayed if you try and add a datasource via an invalid XML file.
- Datasource search results are ‘sticky’, allowing you to click between results to find exactly what you’re looking for. A focus icon to update the tree is coming soon.
- Devices
- A warning will display when () are added to a group or device name. While they are allowed, they require additional care when used in glob expressions.
- The Device Tree now preserves scroll position on refresh.
- Removed ‘saved’ column from raw data tab displayed in the instance detail pane.
- Dashboards
- Speed, speed, speed. Still not fast enough? Tell us more with the feedback button.
- Dashboard management pane status will be preserved when a dashboard is deleted.
- Updating dashboard description will automatically be reflected.
- Reports
- The SLA report now includes a column for Outage (or datapoint not available). This gives users the option to determine how to calculate unreachable time in comparison to time the datapoint did not meet the report threshold.
- Custom Reports: Previously, variables passed into custom report macro functions had to be concatena
ted to an empty string. This is no longer the case. See our detailed documentation for more info. - Device metric trends report takes advantage of the new multi glob lookup (select a mix of glob and distinct values), allowing for easier customization of device groups and devices to include.
- Can download the word.doc from a custom report template.
- Services
- The ##URL## token could previously be used to display URLs in web service alerts. Because ping and web services share the same service message template, we’ve updated this token to also display host names and IP addresses for ping service alerts.
- Widgets
- Top level (account) groups have been removed from the Device and Service NOC widgets when glob is used. The top level group always reflects the most severe status of it’s child groups. It can still be explicitly included.
- Added redirect for device groups or devices pinned on google map widget.
- The Google Map widget respects both device specific or inherited location properties for devices in a device group. Note: There is a maximum of 100 distinct locations allowed per map widget, and once the widget is edited in the current UI it will not work in the old view.
- Service graph widgets pinned to a dashboard will include the location in the widget name.
- Satellite or map view preserved between expanded / minimized, and across sessions.
- Minor Clean Up:
- Single Sign On confirmations only display when necessary.
- Collector group filter can be set to all, allowing for display of all collectors.
- Alert failback message templates were updated for grammatical accuracy.
- Display of devices in the unmonitored table (ungrouped, added by Netscan) has been simplified, including displaying the DNS name and allowing for the table to be easily sorted.
- Removed the default threshold when adding a new datapoint.
Bugs Fixed:
- Custom Reports:
- Datasource arguments for Custom Report graph macros are no longer case sensitive.
- Services:
- Testing services locations merged both California testing locations. The underlying map tool has been upgraded to address this issue.
- Alerts Filters:
- SDT Filter: Setting an SDT filter on the Alerts Page or in an Alerts Report previously restricted the displayed alerts to active alerts, regardless of the clear filter. Now, filtering by SDT=no when Cleared=All returns relevant active and historical alerts.
- Time Range Filter: Alerts for deleted devices, datasources and instances were incorrectly appearing on the Alerts Page and in Alerts Reports as a result of the end time not being set.
- Graphs and Widgets
- Negative values in graphs were displayed in scientific notation.
- Devices with a % in the name did not display correctly in the google map widget.
- Pie and Gauge widgets were taking too long to load
- Roles and Users
- Status filter did not work for the Users table
- In multi tiered device subgroups, the subgroup did not always assign parent view permissions as expected.
- Selections on multiple page tables were not always respecting values on non-visible pages, specifically in regards to assigning roles to users.
- Other Bugs
- When editing an alert rule that used * for device or services, clicking manage defaulted the device field to blank. This didn’t affect routing, but was misleading.
- A timeout occasionally occurred when trying to save device group thresholds.
- When a browser was zoomed out, a bug was encountered that prevented a device from being dragged and dropped into the account (root) group.
- The message icon relocated unexpectedly when expanding a row in the alert message management table.
- Datasource names containing the ampersand character (&) were resulting in data collection issues.
- For EC2 netscan policies, alerting defaulted to enabled each time the policy was reopened.
- Dashboard js error when selecting certain dashboards from the manage dashboard list
- Corrected a few issues with autocomplete not behaving as expected on filter fields.