
Alert Rules
Last updated - 03 November, 2025
Alert rules determine which alerts are routed as alert notifications, as well as how they are routed. An incoming alert is filtered through all rules, in priority order (starting with the lowest number), until it matches a rule’s filters based on alert level, resource attributes (name or group or property), and LogicModule/datapoint attributes. When a match occurs, rule processing stops and the alert is routed to the specified escalation chain, proceeding through the stages of the escalation chain until it is acknowledged or cleared.
An alert that does not match an alert rule is not routed, but still displays in your LogicMonitor portal.
Note: It is possible that an alert could match an alert rule, but still not be routed. This scenario occurs if alert notification suppression is enabled using one of LogicMonitor’s AIOps features that serve to intelligently reduce alert noise. For more information, see Enabling Dynamic Thresholds for Datapoints and Enabling Dependent Alert Mapping.
You can use the settings in your LogicMonitor portal to add, edit, or delete an alert rule. These settings determine which alerts the alert rule apply to, as well as how the alert is routed and managed after the alert rule is applied. In addition, you can customize how LogicMonitor displays the alert rules in the table.
Adding an Alert Rule
- In LogicMonitor, navigate to Settings > Alert > Alert Rules.
- Select
 Add Alert Rules.
 - Enter a unique name in the Name field.
Recommendation: You cannot use special characters such as * ? [ ] ( ) ! | \ ” in the Name field. - In the Priority field, enter a numeric value to determine the priority order the alert rule is evaluated against other rules.
A value of “1” represents the highest priority. Values can consist of up to ten digits. The default value is “100”.
When a triggered alert matches an alert rule, no further alert rules are evaluated.
Recommendations:
- Modify the default value to avoid multiple rules having the same priority. If two or more alert rules have the same priority, the rule is applied nondeterministic.
- Number your original set of alert priorities in intervals (for example, intervals of 10, 20, and 50) so that new alert rules can be inserted without having to renumber existing alert rules.
- From the Level dropdown menu, choose a level that corresponds to the severity levels you assigned when creating alert conditions.
Alerts with severity levels that correspond to the level specified match this alert rule.
Recommendation: If your environment leverages a third-party integration that relies on alerts, configure the alert to match all potential alert level severities.
- (Optional) Enter values for the following settings that a triggered alert must match to have the alert rule apply to it:
- Group—Specify one or more device or website groups that a resource must belong to.
- Resource/Website—Specify one or more resources or websites that the alert must be triggered by.
You can use glob expressions and wildcard matching for both settings. For more information, see Glob expressions.
Notes:
- Group-level cluster alerts use a pseudo-device “cluster”.
- A wildcard value (*) is automatically appended to the values if no value is entered. This allows alerts on any resources with matching properties to be considered by the alert rule.
- Use the Resource Property Filters settings to specify one or more property values that a resource or website must have for an alert to match the alert rule by doing the following:
- Enter a property name in the Name field.
You can enter a maximum of five properties.
LogicMonitor attempts to auto-complete matching results for device properties only. Website property names must be manually entered.
Important: Property names are case-sensitive and must be entered fully. - Enter the required value for the property in the Value field.
Property values support glob expressions and wildcard matching. For more information, see Glob expressions.
- Enter a property name in the Name field.
- In the LogicModule field, specify which LogicModules the alert must be triggered by to match the alert rule.
Alternatively, you can enter a wildcard (*) to indicate all LogicModules.
You can use glob expressions and wildcard matching. For more information, see Glob expressions.
The search option for looking up a LogicModule returns the value of the Displayed as field in the LogicModule record. For more information, see Introduction to LogicModules.
- In the Instance field, specify which instances the alert must be triggered by to match the alert rule.
Alternatively, you can enter a wildcard (*) to indicate all instances.
You can use glob expressions and wildcard matching. For more information, see Glob expressions.
Notes:
- Instances are identified by DataSource-Instance name, not by instance name alone for glob expressions. For example, if an instance of the Interfaces (64 bit) DataSource displays in the Resources tree as “enp2s0”, in an alert rule it is identified as “snmp64_If-enp2s0”. To match the instances, you must use the glob expression “*enp*”, not “enp*”. Select the instance in the Resources tree and look at the title of details pane for the DataSource-Instance name.
- Any instance filters established here are ignored by EventSource and JobMonitor alerts, as they are not tied to instances, only devices.
- In the Datapoint field, specify which datapoints the alert must be triggered by to match the alert rule.
Alternatively, you can enter a wildcard (*) to indicate all datapoints.
You can use glob expressions and wildcard matching. For more information, see Glob expressions.
Any datapoint filters established here are ignored by EventSource and JobMonitor alerts, as these types of alerts are not triggered by datapoint conditions.
- Toggle the Send notification when alerts clear switch to allow any recipient of the initial alert notification to also receive a notification when an alert clears. This option also ensures alert notifications are delivered if SDT (scheduled downtime) is subsequently activated to temporarily suppress other routed alert notifications for the issue.
Note: Receiving a notification when an alert clears regardless of SDT status only applies to alerts triggered by DataSources. Notifications for EventSources are not delivered if the triggering instance or resource is put in SDT.
Important: If your environment leverages a third-party integration that relies on alerts, enable this option to ensure that LogicMonitor can route alerts to your third-party tool. This applies regardless of whether the alert has an SDT status. This setting also ensures that LogicMonitor can close incidents in your third-party integration when an alert clears.
- Toggle the Send status notifications for Acknowledge or SDT switch to allow any recipient of the initial alert notification to receive a notification when an alert is acknowledged or put in SDT.
- In the Escalation Interval (min) field, enter a value for the amount of time in minutes that should elapse before an alert is escalated to the next stage in your escalation chain. Escalation stops when the alert is acknowledged or cleared.
If there is only one stage in the escalation chain, the alert notification is repeatedly sent to that stage until it is acknowledged or cleared. Similarly, if the notification reaches the end of a multi-stage escalation chain, the alert is repeatedly sent to the final stage until it is acknowledged or cleared.
Important: If your environment leverages a third-party integration that relies on alerts, enter “0”. This routes the alert notification to the first stage of the escalation chain once, and does not resend unless you manually escalate the alert. Repeatedly sending an alert notification to an integration can result in duplicate behavior in your third-party tool.
- From the Escalation Chain drop-down menu, select the escalation chain you want to route alerts to. For more information, see Escalation Chains.
- Select Save.
Customizing Table Settings
- Navigate to Settings > Alert > Alert Rules.
- Select
 .
. - Do the following:
- To order the columns, select
 and drag to the order you want
 - To hide or show columns, select
 .
.
- To order the columns, select
Best Practices for Configuring Alert Rules
Configuring your alert rules is highly dependent on your environment. For example, if your environment leverages LM Integrations, you should consider the alert lifecycle when configuring an alert rule. Use the following best practices for configuring your alert rules:
- Only route alerts that require immediate attention—Alert routing works well for alerts that require immediate attention, such as critical level alerts. Some alerts don’t require immediate attention, such as warning alerts, and as such are better viewed in reports. Instead of having “catch all” rules that are sending every single alert to a certain group of people, you can set up your alert rules such that only specific alerts are going to be routed. Make sure, however, that you’re not ignoring any alerts; you should still review alerts that are not being routed in a report.
LogicMonitor also offers AIOps features that suppress alert notifications on a very targeted basis with the aim of intelligently reducing alert noise. For more information, see Enabling Dynamic Thresholds for Datapoints and Enabling Dependent Alert Mapping.
If you do want to route all alerts, consider creating a rule with an escalation interval of “0” for warning alerts. This filters out all warning alerts and send them only once to the first stage of the specified escalation chain. Then you can set up other rules that route only error and critical alerts to people within your organization. - Give specific rules higher priorities—Organize your rules so specific rules have higher priorities (lower numbers), and general rules have lower priorities (higher numbers). Any alerts that do not meet the criteria of your specific rules are caught by the general rules.
- Index your priorities—For a large deployment, you can index your priorities to correspond to groups within your organization. For example, you could set dev related rules to have priorities in the 100s, production related rules to have priorities in the 200s, and QA related rules to have priorities in the 300s. Ensuring that every rule is set to only match alerts from a specific device group, each department can work within their range of priorities to customize routing for their group, without affecting alerts for any other department.
- Leave large gaps between priority levels—If your priority levels are too close together sequentially, you may need to edit the priorities for your existing rules to make room for new rules.
- Test alert rules—Test alert delivery to ensure that alerts are routing as intended. For more information, see Testing Alert Delivery.
- (For LM Integrations) Use a single alert rule for the entire alert lifecycle—If an alert rule references delivery to an alert integration as part of its escalation chain, that rule should be configured to match all potential alert level severities. This prevents duplicate behavior or orphaned incidents in your third-party tool.
When LogicMonitor delivers alert information to a third-party tool, LogicMonitor looks for an external reference (for example, a ticket ID number) for that alert. This reference is returned to LogicMonitor by the third-party tool. LogicMonitor captures this reference, and associates it with the alert using a key that consists of the alert rule ID and integration ID. This key is then used to tie all future activity for that alert back to the original target integration object.
If an external reference is not found for an alert, the integration creates a new object. If an external reference is found, the integration updates the existing object.
Example Alert Rule Setup
The following screenshot depicts a sample set of alert rules:
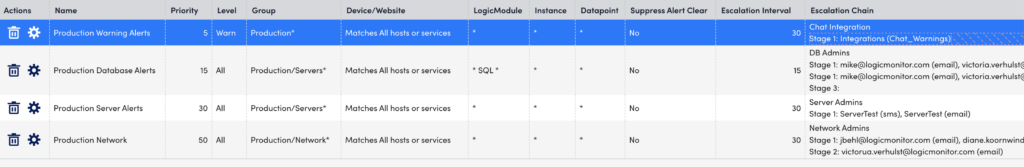
The highest priority rule is “Production Warning Alerts”. It filters out all alerts with a severity level of “Warn” in the child groups under production. This rule posts alert notifications to a messaging tool (using LM Integrations) every 30 minutes, until the alert is acknowledged or cleared.
The second highest priority rule is “Production Database Alerts.” It only matches alerts on DataSources that have the term “SQL” somewhere in the name for devices in the child groups under the servers group. Since the “Warn” alerts are filtered out by the first rule, this rule only picks up database alerts with severity levels of “Error” or “Critical.” The stage one recipients of the “DB Admins” escalation chain is notified first, and if they do not acknowledge the alert and it does not clear within 15 minutes, it is sent to the stage two recipients. After 15 minutes, if nobody has acknowledged the alert and it has not cleared, the alert escalates to stage three. Stage three does not have recipients, so no one is notified. Since alert notifications are repeatedly sent to stage three until the alert is acknowledged or cleared, having an empty last stage is essentially ensuring that nobody is notified after the alert escalates past stage two.
Note: When sending alert notifications to a ticketing system in one of your stages, ensure that you have either a zero resend interval or a subsequent stage with a different delivery method. This prevents multiple tickets for the same condition.
The next highest priority rule is “Production Server Alerts”. It matches any alerts with a severity level of “Error” or “Critical” for any resource in any child group under the servers group. Since this rule has a lower priority (that is, a higher number) than the “Production Database Alerts” rule, any error or critical alerts that do not originate from a SQL DataSource match this rule instead. This alert rule catches the overflow—anything that is not going to the database team is picked up by the server team.
The fourth rule routes all alerts with a severity level of “Error” or “Critical” for resources in the child groups of the network group. All alerts with a severity level of “Warn” are filtered out so this rule is catches error and critical alerts that are not routed to the database or server teams.
