
Disclaimer: This content applies to the legacy UI and is no longer maintained. It will be removed at a future time. For up-to-date content, see Active Discovery. At the time of removal, you will automatically be redirected to the up-to-date content.
What Is Active Discovery?
Last updated – 24 July, 2025
Active Discovery is the process by which LogicMonitor determines all of the similar components of a particular type on a given system. The output of an Active Discovery process is one or more instances for which LogicMonitor can collect a particular type of data.
Instances are organized under their parent DataSources in the Resources tree.
Active Discovery is extremely valuable for ensuring that monitoring remains up to date with changes in your environment. For example, Active Discovery ensures that each new VM created on your virtualization stack is discovered and monitored, or that each new volume added to your storage system is discovered and monitored. Without Active Discovery, you would have to remember to manually update your monitoring instances every time you make a change to your production environment.
Active Discovery Execution
DataSources with Active Discovery enabled have a discovery schedule that defines the time between Active Discovery executions. This discovery schedule is configured from the DataSource definition (as discussed in the Configuring Active Discovery section of this support article) and varies per DataSource. For example, objects that typically change less frequently (e.g. the number of fans or CPUs in a system) are assigned discovery schedules of once a day by LogicMonitor. Objects that are likely to change more frequently (e.g. volumes on a NetApp disk array), however, are assigned discovery schedule of several times per hour.
In addition to executing according to the schedule defined in the DataSource definition, Auto Discovery additionally runs when:
- A device (or DataSource) is added into monitoring.
- A device or DataSource’s properties/configurations are changed.
- It is manually initiated from the Resources page. The ability to manually execute Active Discovery is useful when you have added a new object onto a device and want to be sure LogicMonitor picks it up immediately for monitoring without having to wait for the scheduled Active Discovery execution. For more information on manually executing Active Discovery, see Adding Instances.
Note: When you disable DataSource monitoring for a particular resource or group of resources (as discussed in Disabling Monitoring for a DataSource or Instance), Active Discovery is also disabled for that DataSource. This means that instances will not be discovered, updated, or deleted for those impacted resources.
Information Gathered by Active Discovery
Active Discovery retrieves the following information for each instance it finds:
- Instance name. The descriptive name of the instance (e.g. Fastethernet0), also known as the “ALIAS” as displayed in the Resources tree. This value must be unique for the device/DataSource combination.
- Instance ID. The unique ID of the instance, used as the variable to identify this instance when querying the device for data (e.g. the variable part of an SNMP OID tree, or the volume ID in a storage system). This is also known as the “WILDVALUE”.
- Instance description. An optional description of the instance, which is displayed along with the instance name in the Resources tree.
- Instance properties. Optional sets of key-value pairs that provide static data about the instance. These are analogous to resource properties, but are collected on a per-instance basis. Once collected, instance properties are stored (and displayed in the UI), and can be used as keys to group instances together, or as part of complex datapoint calculations. The following properties are commonly collected as instance properties:
- Serial numbers for each FRU discovered in a switch chassis, or drives in a storage system.
- Metadata for each VM hosted by a Hypervisor (CPU count, memory allocation, virtual NIC count, guest OS, etc.).
- Port speed for each network interface.
Note: Instance property collection is available only with Active Discovery processes that use script, SNMP, or WMI query methods.
Note: In addition to gathering instance properties via Active Discovery, you can also manually assign properties to instances, as discussed in Resource and Instance Properties.
Configuring Active Discovery
Active Discovery is configured on a per-DataSource basis. Therefore, it is configured from the DataSource definition. DataSource definitions control many configurations related to monitoring and are discussed in detail in Creating a DataSource.
To configure Active Discovery for a DataSource, navigate to Settings | LogicModules | DataSources and open the DataSource. Scroll down to (and expand) the Active Discovery heading to display all available Active Discovery settings. Each is discussed next.
Note: A DataSource must be multi instance (i.e. its Multi-instance option must be checked under the General Information heading) in order for Active Discovery to be configured.
Enable Active Discovery
Check the Enable Active Discovery option to enable Active Discovery. When enabled, LogicMonitor will automatically find a DataSource’s instances on the devices that the DataSource applies to.
Disable Discovered Instances
If the Disable Discovered Instances option is checked, instances are initially placed in a disabled state upon discovery and automatically moved into the dynamic “Unmonitored” instance group (see Instance Groups for more information on instance groups). Monitoring will have to be manually enabled on these instances.
Checking this option is helpful if you would like to fine tune your instances’ datapoint thresholds prior to enabling monitoring. This ensures you do not receive a flood of unwanted alerts as soon as new instances are discovered.
Automatically Delete Instance
If the Automatically Delete Instance option is checked, LogicMonitor will automatically remove an instance from monitoring if a future Active Discovery iteration reports that it is no longer present on a device.
As a best practice, uncheck this option if you would like to receive alerts for instances even if they are not present. For example, you would likely not want this option checked if Active Discovery detects that a service should be monitored by finding a listening TCP port. This is because, if the service were to fail, the port would stop responding, Active Discovery would report the instance as no longer present, it would be removed from monitoring, and you would no longer receive alerts for it—at precisely the time you would want to receive alerts for it.
When automatically removing instances from monitoring, you can choose how long the monitoring history will remain in LogicMonitor:
- Delete Immediately. An instance (and all of its monitoring history) will be immediately removed from LogicMonitor upon the instance being determined not present.
- Delete After 30 Days. While the instance will immediately disappear from the Resources tree upon being determined not present, its monitoring history will remain in LogicMonitor for 30 days before being removed. If the instance is rediscovered within this 30-day window, the prior monitoring history will be reassociated upon rediscovery. This grace period is useful in use cases such as the replacement of a failed network card, where you would want the old history visible once the new card is active. (You would not want the history kept if the new instance is not related to the old.)
Discovery Schedule
As discussed in the Active Discovery Execution section of this support article, Active Discovery can be configured to execute on a schedule of every 15 minutes, every hour, or once every day. Or, it can be configured to execute only when the DataSource is initially applied to a device, or when the Datasource (or the device it applies to) is updated in some way.
Discovery Method
The Discovery method field defines the method (SNMP, WMI, script, etc.) employed by Active Discovery to find instances. LogicMonitor’s Active Discovery process supports a variety of methods for querying a device or system about the objects it has available for monitoring. These include:
- CIM. Queries a Common Information Model class and property.
- COLLECTOR. Discovers Collectors as instances.
- HTTP. Queries an HTTP/HTTPS URL.
- JDBC. Actuates a database query.
- JMX. Queries a specific Java Management Extensions path.
- PERFMON. queries a Windows Perfmon class.
- PORT. Connects to specific TCP port(s).
- SCRIPT. Uses the output of a script.
- SNMP. Actuates an SNMP query.
- WMI. Queries a Windows WMI class.
- Various APIs. For some systems and applications, LogicMonitor supports Active Discovery via direct query of proprietary APIs including the Citrix XenServer API, MongoDB API, NetApp API, and VMware ESX API.
- Various public cloud resources. For public cloud resources, LogicMonitor supports Active Discovery via direct query of proprietary cloud systems including those hosted by Amazon Web Services (AWS), Google Cloud Platform (GCP), and Microsoft Azure.
Parameters
The options available under the “Parameters” heading dynamically update depending upon the discovery method chosen. For more information on setting the unique parameters required for the various discovery methods, see their individual support articles.
Filters
Filters allow you to restrict which instances are added into monitoring via Active Discovery. If one or more filters are in place, instances must match the filter criteria in order to be discovered.
To create a filter, click the plus sign (+) icon and designate the conditions a particular attribute must meet. Attributes can represent instance-level properties, SNMP OIDs, or attributes found in WMI query outputs.
Note: When building filter statements, several standard operation types such as Equal, NotEqual, LessThan, Contain, and RegexMatch (to name a few) are available. Although most of these are self explanatory, one common point of confusion we see is the use of Contain to filter for values such as “A|B” where the assumption is that instances with A or B in the string will be discovered. However, because values paired with the Contain operation are searched as a single string (“A|B” must literally be present), a RegexMatch operation should be used when OR statements are desired.
See the Understanding Active Discovery Filters section of this support article for several real-world use case scenarios for Active Discovery filters.
Group Method
The Group Method field determines how instances will be organized upon discovery. You can choose “Manual” as the group method to manually organize instances into groups after discovery (or leave them permanently ungrouped), or you can choose one of the auto grouping methods available from the dropdown. For detailed information on automating the management of instance groups, see Instance Groups.
Understanding Active Discovery Filters
Active Discovery filters control what objects are allowed to populate as instances on a device level. These filters are used to preserve the desired alerting and data collection, but prevent alerting on non-critical infrastructure. When filters are in place, every object discovered via the Active Discovery process must satisfy the filter criteria in order to be added into monitoring.
Note: Multiple filter lines are joined using the logical AND operator; a discovered instance must satisfy the criteria of ALL filters in order to be added into monitoring.
Note: When building filter statements, several standard operation types such as Equal, NotEqual, LessThan, Contain, and RegexMatch (to name a few) are available. Although most of these are self explanatory, one common point of confusion we see is the use of Contain to filter for values such as “A|B” where the assumption is that instances with A or B in the string will be discovered. However, because values paired with the Contain operation are searched as a single string (“A|B” must literally be present), a RegexMatch operation should be used when OR statements are desired.
In the following sections, we’ve highlighted several common use cases for Active Discovery filters.
- Excluding down interfaces from monitoring
- Assigning different datapoint thresholds to different types of instances
- Filtering via instance-level properties
- Troubleshooting SNMP filtering
Use Case: Excluding Down Interfaces from Monitoring
Often, our customers are not interested in monitoring down interfaces. So, to exclude down interfaces, the following filter could be added to a DataSource that monitors interfaces.
When walking the table of interfaces via SNMP, each discovered interface has the interface status OID queried. When this filter is in place, that status must be a “1” in order for the interface to meet the filter criteria and get added into monitoring. If the interface is down or in testing, it will not be added into monitoring and thus won’t clutter the Resources tree with inactive interfaces. And, because Active Discovery runs periodically, if the interface is brought up later, it will pass the filter and go into monitoring.
Use Case: Assigning Differing Datapoint Thresholds to Different Types of Instances
Auto Discovery filters can be used to exclude instances for the purpose of applying different datapoint thresholds to different types of instances. For example, consider you have a Cisco switch with uplink ports that are consistently labeled “Uplink” in their switch port descriptions and edge ports that are not labeled. You’re primarily concerned with alerts related to uplink ports, but are still interested in monitoring some aspects of the edge ports.
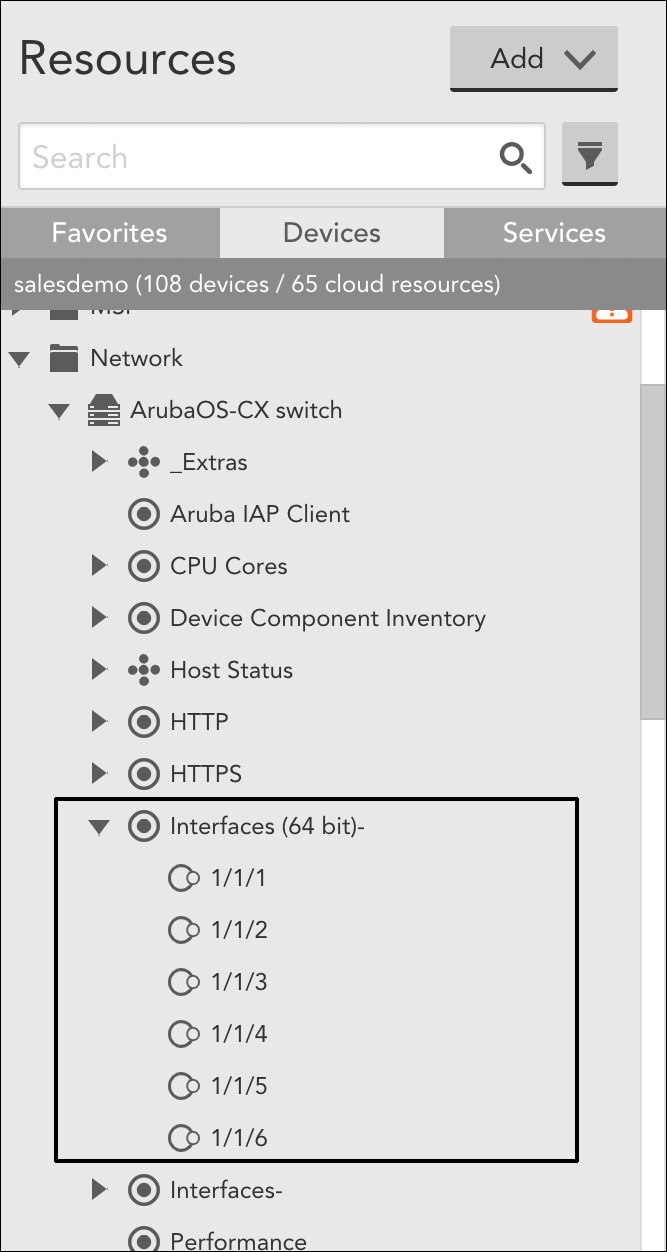
Accomplishing this requires cloning and modifying various aspects (including the filters) of LogicMonitor’s out-of-the-box Interfaces (64 bit)- DataSource. Ultimately, you’ll end up with three versions of the DataSource: one that applies only to Cisco devices and only monitors uplink ports; one that applies only to Cisco devices and monitors everything that is not an uplink; and one that applies to everything except Cisco devices. The following set of steps outline the process you need to follow to achieve this use case:
- Clone the Interfaces (64 bit)- DataSource for the purpose of creating a new DataSource that applies only to Cisco uplink ports. Give the cloned DataSource a descriptive name (e.g. “Interfaces (64 bit) Cisco Uplinks”). For more information on cloning DataSources, see Cloning a LogicModule.
- Update the Applies To field for the cloned DataSource to isCisco() so that it only applies to Cisco devices.
- Add an Active Discovery filter that restricts instance monitoring to uplink ports.
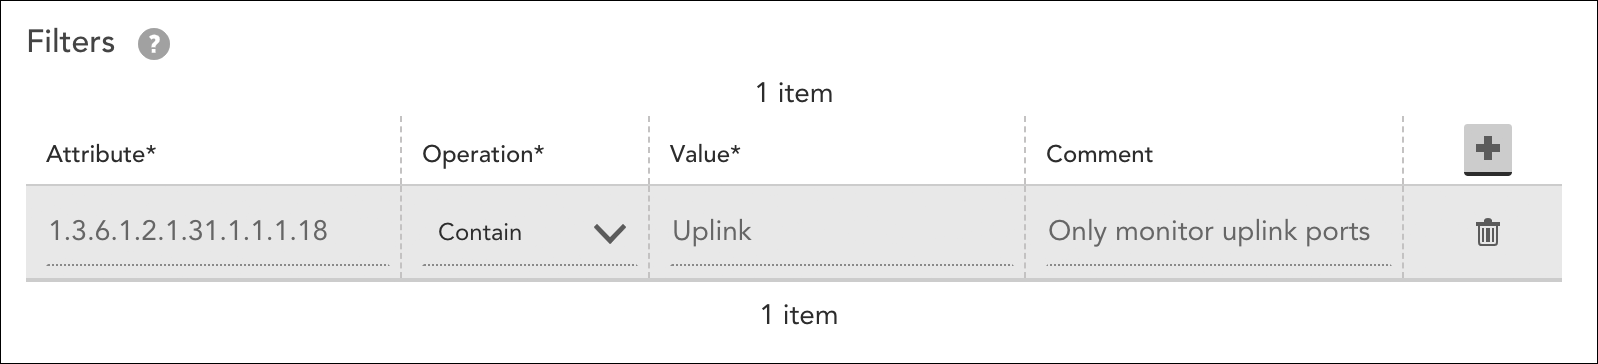
This filter assumes the presence of “Uplink” in the interface description (OID 1.3.6.1.2.1.31.1.1.1.18), but there are many other ways to accomplish this same restriction. - Now that we have a DataSource that monitors only uplink ports, it’s time to create one that monitors non-uplinks. To do this:
- Clone the new DataSource you just created.
- Inverse the filter (i.e. use the “NotContain” operator instead of the “Contain” operator).
- Remove the static thresholds on the Status and StatusFlap datapoints to reduce alerting for non-uplink Cisco gear. For more information on updating static datapoint thresholds, see Tuning Static Thresholds for Datapoints.
- To prevent the original DataSource from monitoring Cisco interfaces, set its Applies To field to hasCategory(“snmp”)&& !isWindows() && !isCisco(). This applies the DataSource to all devices that support SNMP, except Windows devices and Cisco devices).
Use Case: Filtering via Instance-Level Properties
Instance-level properties can also be used as filters to determine which instances instances should (and should not) go into monitoring. These properties are created and assigned during Active Discovery.
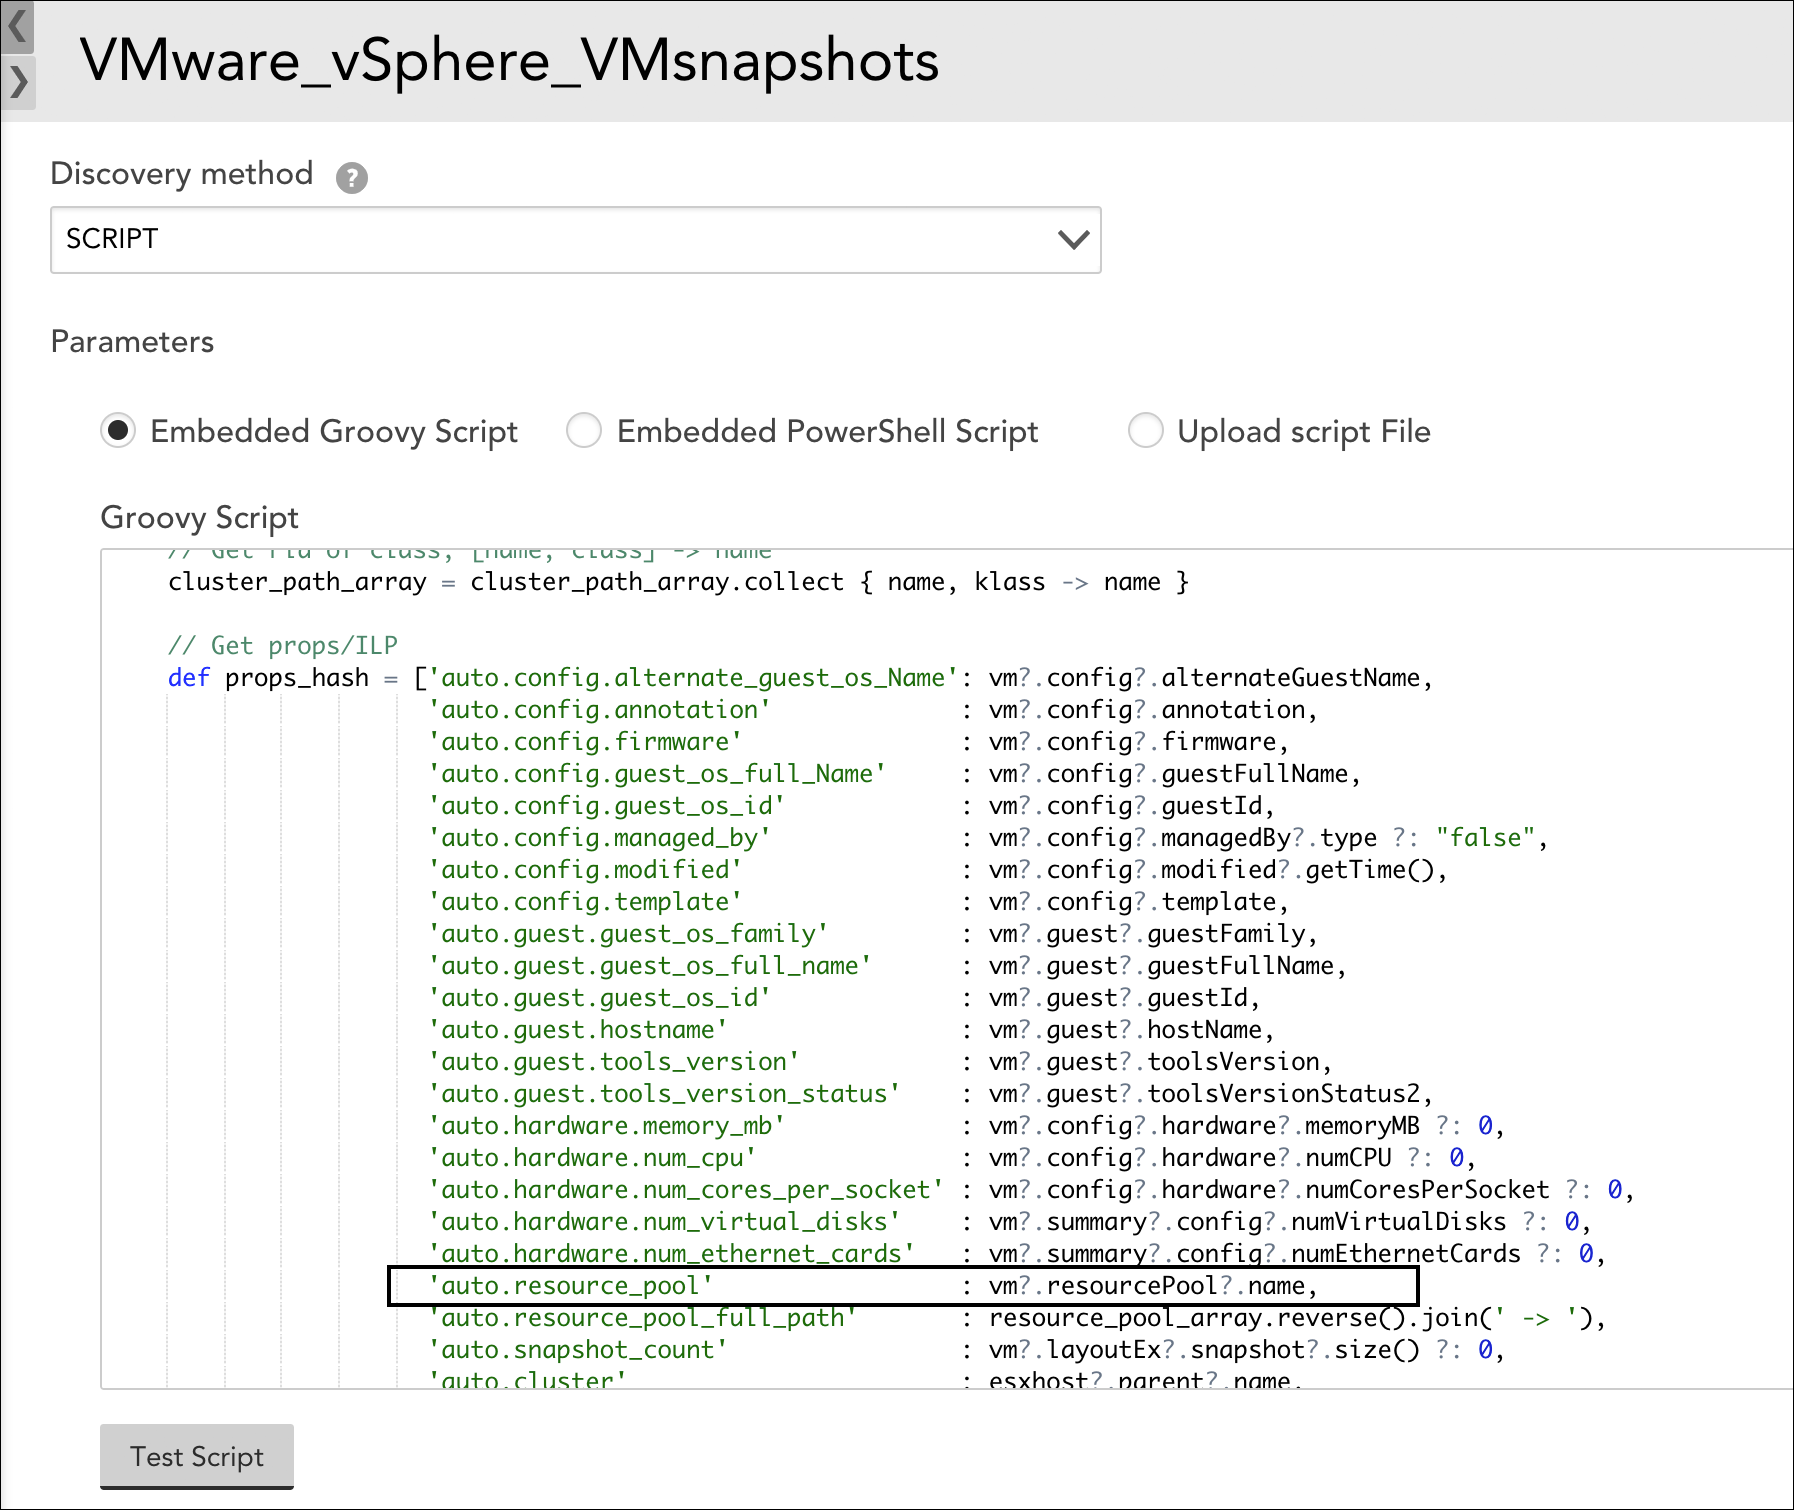
For example, LogicMonitor’s out-of-the-box VMware_vSphere_VMsnapshots DataSource performs Auto Discovery via an embedded Groovy script. As shown next, this script assigns a large number of properties to resulting instances, one of these properties being auto.resource_pool, which captures the name of the virtual machine’s resource pool.
If you wanted to exclude instances from certain pools (e.g. lab or test environment pools that don’t require alerting), you could create a filter based on this instance property.
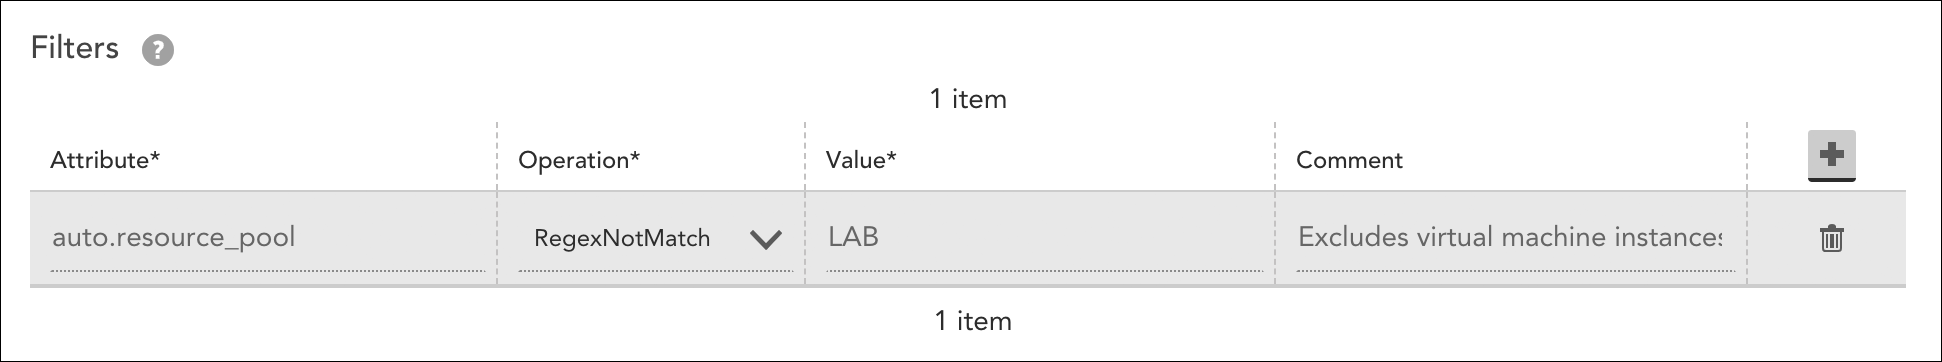
This filter excludes virtual machines from any resource pools named “LAB”.
For more information on instance-level properties, see Resource and Instance Properties.
Use Case: Troubleshooting SNMP Filtering
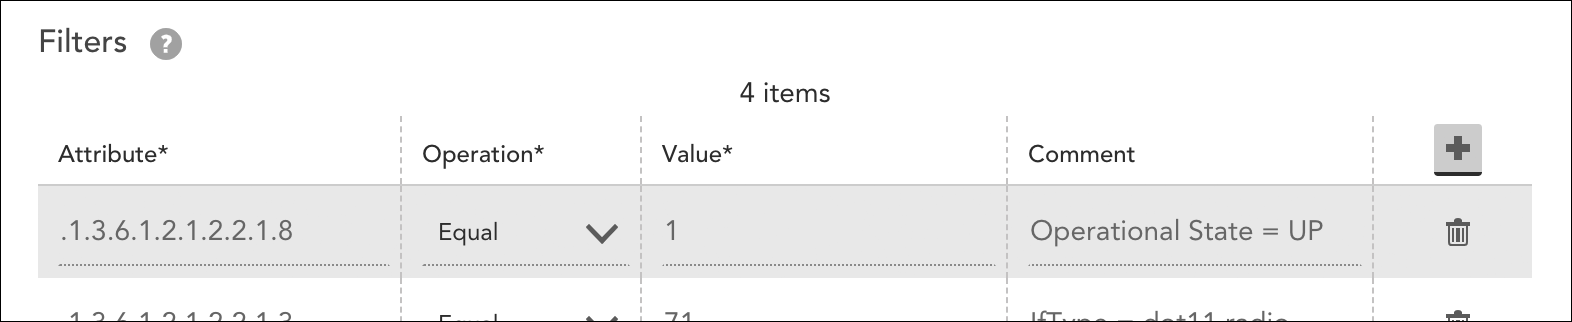
Sometimes, an Active Discovery filter can create confusion to a customer expecting an instance, but not seeing it. For example, our out-of-the-box NetAppSnapVol- DataSource features the default filters shown next.
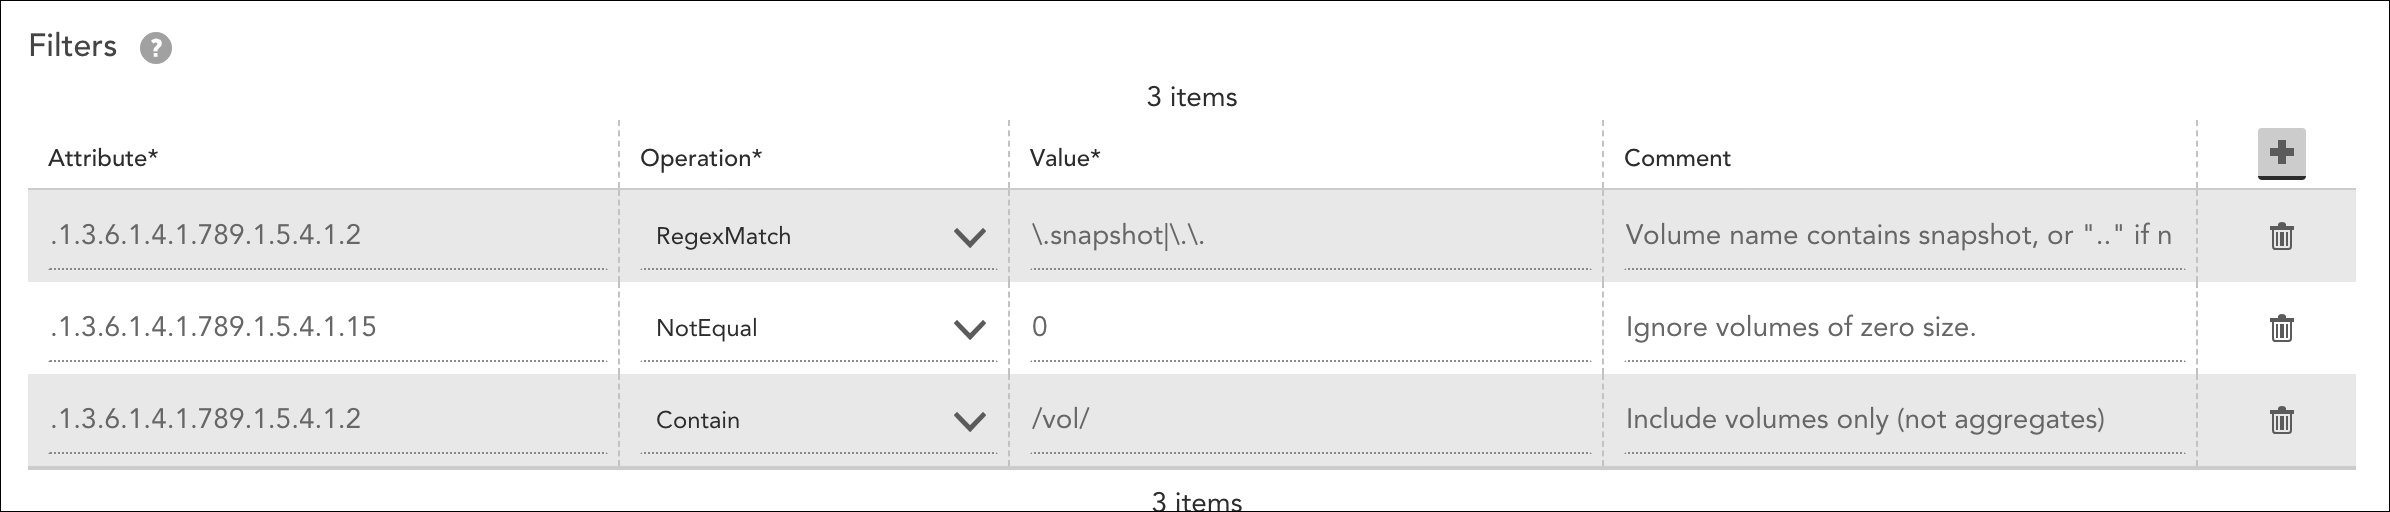
A common troubleshooting scenario is when only one NetApp Snapshot volume displays, but more are expected. Using the SNMP OID set on the DataSource definition, you can perform a manual walk to get the full list of volume instances, as shown next.
$ !snmpwalk SOMEHOST .1.3.6.1.4.1.789.1.5.4.1.2
Walking OID .1.3.6.1.4.1.789.1.5.4.1.2 from host=SOMEHOST, version=v2c, port=161, timeout=3 seconds:
1 => aggr2
10 => /vol/cache1img3/.snapshot
11 => /vol/cache1img4/
12 => /vol/cache1img4/.snapshot
13 => /vol/cache1img5/
14 => /vol/cache1img5/.snapshot
15 => /vol/cache1img6/
16 => /vol/cache1img6/.snapshot
17 => /vol/cache1img7/
18 => /vol/cache1img7/.snapshot
19 => /vol/cache1img8/
2 => aggr2/.snapshot
20 => /vol/cache1img8/.snapshot
21 => /vol/cachepreprod/
22 => /vol/cachepreprod/.snapshot
23 => /vol/cache1imgtest/
24 => /vol/cache1imgtest/.snapshot
3 => /vol/new_root/
4 => /vol/new_root/.snapshot
5 => /vol/cache1img1/
6 => /vol/cache1img1/.snapshot
7 => /vol/cache1img2/
8 => /vol/cache1img2/.snapshot
9 => /vol/cache1img3/
Here there are indeed more than one potential instances for discovery. However, the second default filter checks volume size and only puts those into monitoring that do not report a zero size from the OID .1.3.6.1.4.1.789.1.5.4.1.15 and is typically the reason why all expected volume instances are not present.
