
Viewing, Filtering, and Reporting on Network Traffic Flow Data
Last updated - 11 August, 2022
Network traffic flow data is displayed on the Traffic tab on the Resources page.
The Traffic tab consists of built-in tables, graphs, and charts that illustrate common network traffic flow statistics including top talkers, top flows, top source/destination endpoints, top ports, and more. The data can be filtered by a number of criteria and the individual data visualizations that display on the Traffic tab can be added as widgets to your dashboards.
Data Retention
LogicMonitor has a specific data retention policy for exported network traffic flow data. The policy is per interface, and data is sampled and retained according to the following schedule:
- Raw data is retained for up to five minutes.
- Every five minutes, the top 1000 flows are pulled from the current pool of raw data and retained for up to 30 minutes.
- Every 30 minutes, the top 1000 flows that have been retained for each of the five-minute intervals (at this point, there are six intervals total for up to 6000 flows) are combined and the top 1000 flows are pulled and retained for up to 24 hours.
- Every 24 hours, the top 1000 flows that have been retained for each of the 30-minute intervals (at this point, there are 48 intervals total for up to 48,000 contributors) are combined and the top 1000 flows are pulled and retained on a rolling basis for a maximum period of 400 calendar days, based on your account retention plan.
The following data is retained:
- FlowDirection
- SourceIP
- SourcePort
- DestinationIP
- DestinationPort
- Protocol
- StartEpochInSeconds
- EndEpochInSeconds
- TCPFlags
- InterfaceIn
- InterfaceOut
- PacketsReceived
- BytesReceived
- PacketsSent
- BytesReceived
- ApplicationName
- ApplicationCategory
Viewing Data at the Resource or Resource Group Level
In addition to displaying network traffic flow data at resource level, the Traffic tab also displays for resource groups that have one or more enabled resources as members.
At the resource group level, the Traffic tab aggregates data coming from enabled resources in the group. Group-level aggregation is currently limited to 10 actively contributing network-flow-enabled devices per group. If there are more than 10 actively contributing members per group, the 10 with the lowest resource IDs are considered. Resource IDs are stored in the system.deviceID property and are auto-incremented with each new device added into monitoring; device IDs cannot be manually updated.
Aggregated network traffic flow data can be very helpful in some cases. For example, you can use group level data to visualize network traffic on a per-office basis or per-data center basis. For more information, see Device Groups Overview.
Traffic Tab Data Visualizations
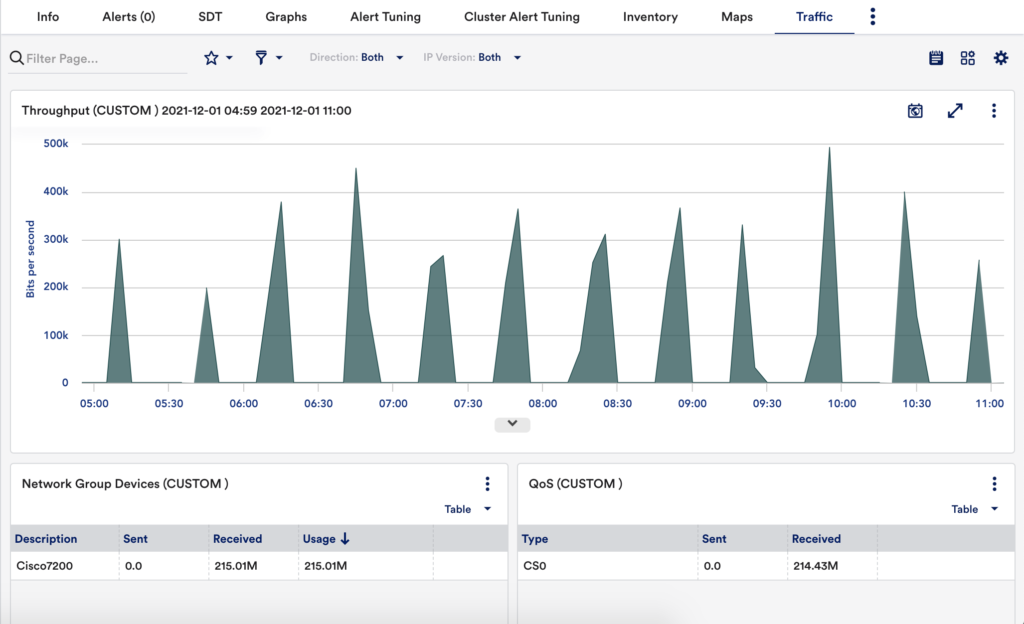
The Traffic tab displays widget, table, graph and pie chart visualizations to illustrate commonly collected network traffic flow data. With the exception of the NetFlow Health widget, the time range of these visualizations is controlled by the universal time range currently set in your portal. For more information, see Changing the Time Range.
The Traffic tab consists of the following built-in data visualizations:
NetFlow Health widget—Available at the resource level only. Provides an at-a-glance view of the health of your network traffic flow monitoring operations. This widget is located at the very top of the Traffic tab and can be expanded or collapsed. For more information, see Troubleshooting NetFlow Monitoring Operations.
Note: The Collector assigned to monitoring network traffic flow data for the resource must be version 30.100 or higher to display the NetFlow Health widget.
Throughput graph—Displays throughput (as bits per second) for the resource. If viewing at the resource group level, this graph displays aggregate throughput for up to 10 resource in the group (these resource are listed in the Network group devices table/pie chart).
Top Talkers table/pie chart—Displays usage details for the top talkers on the resource. If viewing at the resource group level, this visualization displays usage details for the top talkers across a maximum of 10 resource in the group (these resource are listed in the Network group devices table/pie chart).
Top Source/Destination Endpoints table/pie charts—Available at the resource level only, these two data visualizations display usage details for the top source and destination endpoint IPs.
Top Flows table/pie chart—Displays usage details for the top flows on the resource. If viewing at the resource group level, this visualization displays top flows for up to 10 resources in the group (these resources are listed in the Network group devices table/pie chart).
Network group devices table/pie chart—Available at the resource group level only. Displays up to 10 NetFlow-enabled resources that are contributing to the aggregated flow data displayed at the group level. The resources shown in this visualization are the ones contributing data to all other visualizations at this group level.
<div style=”background-color: #eff6fd;margin-bottom: 30px;margin-top: 18px;padding: 20px 20px 2px 20px”>
<p><b>Note:</b> The resources are sorted first in alphabetical order based on the host display name to get 10 NetFlow-enabled resources. After aggregating data, the resources are sorted again based on the usage.</p>
</div>
QoS table/pie chart—Displays quality of service (QoS) data for each differentiated service code point (DSCP) type. If viewing at the resource group level, this visualization graph displays QoS data for up to 10 resources in the group (these resources are listed in the Network group devices table/pie chart).
Top ports table/pie chart—Available at the resource level only, displays the ports with the most traffic flow.
Top applications table/pie chart—Available at the resource level only, displays the applications with the most traffic flow (sourced from NBAR2).
Viewing Data via Reports and Dashboard Widgets
In addition to viewing network traffic flow data from the Traffic tab, you can also view this data via reports and dashboards.
Dashboards
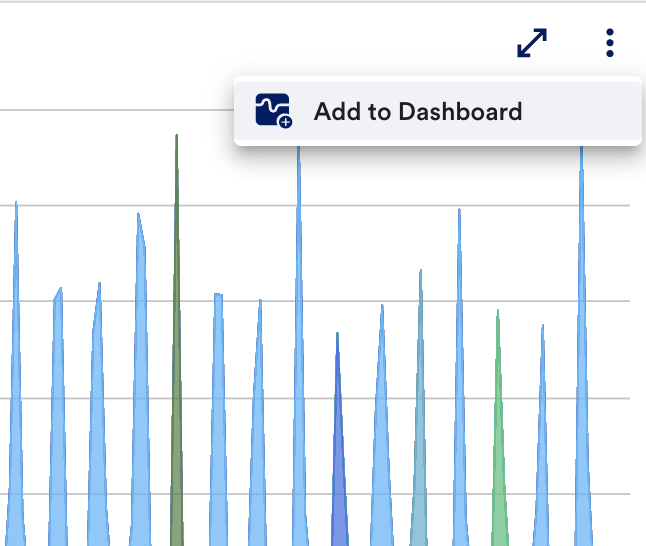
The majority of data visualizations that display on the Traffic tab can be added as widgets to one or more of your dashboards using the Add to Dashboard setting. Any currently active filters on the Traffic tab will be preserved by the recipient dashboards. However, because the visualizations are added in the structure of the built-in NetFlow widgets, these filters can be updated from the dashboard at any time.
Note: You can build NetFlow dashboard widgets on a per-resource basis from the Dashboard page. The built-in NetFlow widget offers the same filters as the Traffic tab. For more information, see Widget Overview.
Reports
LogicMonitor offers a dedicated report for network traffic flow data. For more information, see NetFlow Device Metric Report.
Configuring IP-DNS Mappings
If you’d like the Traffic tab (and any associated reports or dashboard widgets) to display DNS names in addition to IP addresses other than those that have already been resolved, you can provide explicit IP/DNS mappings—either individually or by uploading a CSV file.
Configuring Port Mappings
You can configure the display names for the required port mappings either individually or by uploading a CSV file. For more information, see Uploading Mappings using a CSV File.
There are two ways to edit the port mappings display names:
- Navigate to Resources > Select the required NetFlow enabled resource and click the Traffic tab.
- On the Traffic page, scroll to the Top Ports section.
- In the Top Ports section, click Edit in the Actions column.
- Enter the required name for the port and click Save.
OR
- Navigate to NetFlow enabled Resources > Select the required resource and click the Traffic tab.
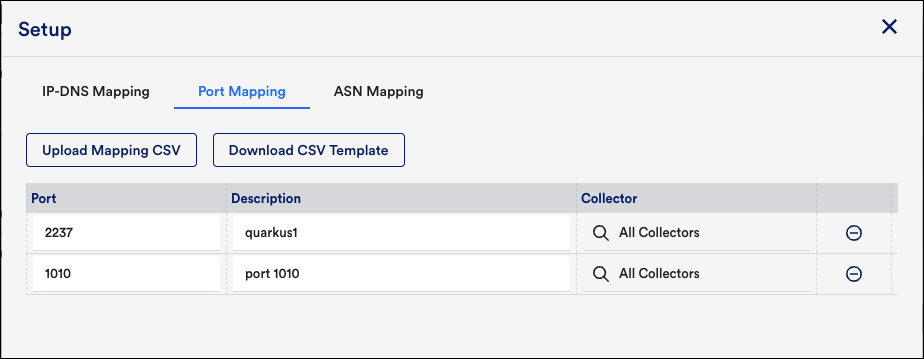
- On the Traffic page, click Settings in the top-right corner in the Filter bar.
- On the Setup dialog box, click Port Mapping.
- Enter the required display name in the Port column and click Save.
Configuring ASN Mapping
If you want to configure the ASN mapping display name, complete the following:
- Navigate to Resources > Select the required NetFlow enabled resource and click the Traffic tab.
- On the Traffic page, click Settings in the top-right corner of the Filter bar.
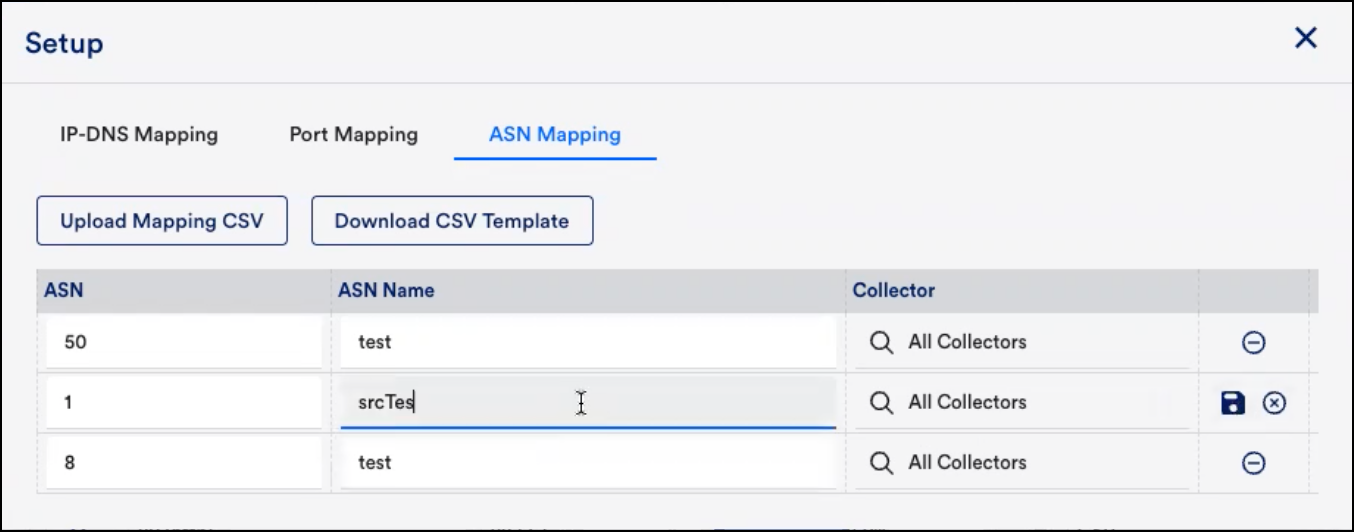
- On the Setup dialog box, click ASN Mapping.
- Enter the required display name in the ASN Name column and click Save.
Uploading Mappings Using a CSV File
If you want to upload mappings using a CSV file, then
- Click Settings in the upper left corner of the Traffic tab.
- On the Setup dialog box, click Upload Mapping CSV.
The following columns must be present in the CSV file:
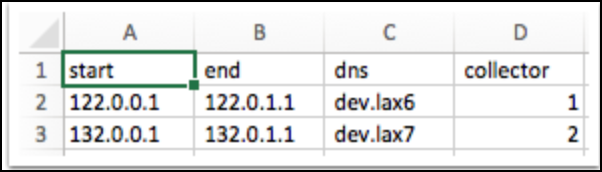
IP-DNS Mapping CSV:
- start – Contains the starting IP address of the DHCP range.
- end – Contains the ending IP address of the DHCP range.
- dns – Contains the DNS name associated with the IP address(es).
- collector – (optional) Contains the Collector ID and allows you to configure mappings per Collector collecting network flow data. This is particularly useful for establishing differentiated mappings per collector or, globally.
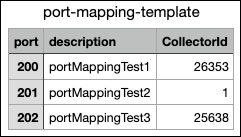
Port Mapping:
- port – Contains the port name.
- description – Contains the port mapping display name.
- Collectorid – (optional) Contains the Collector ID and allows you to configure mappings per Collector collecting network flow data. This is particularly useful for establishing differentiated mappings per location or, if you are a service provider, per customer.
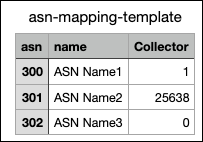
ASN Mapping:
- asn – Contains ASN number.
- name – Contains the ASN mapping display name.
- Collector – (optional) Contains the Collector ID and allows you to configure mappings per Collector collecting network flow data. This is particularly useful for establishing differentiated mappings per collector or globally
Note: You can also click Download CSV Template to download the template and fill in the required information and upload the CSV file.
Once you upload the CSV mapping templates, you can edit the mappings from the Setup dialog box.
Manually Creating Mappings
Mappings can be created (or edited) on the fly simply by placing your cursor into any value found in a visualization’s Description column, updating the value, and clicking the Save button that appears at the end of the row. This creates a new or updated entry on the IP-DNS Mappings dialog.
Deleting Mappings in Bulk
Complete the following steps to delete multiple mappings:
- Navigate to Resources > Select the required NetFlow-enabled resource and select the Traffic tab.
- On the Traffic page, in the upper right corner, select Settings.
- On the Setup page, select the required Mapping tab, for example, IP-DNS Mapping.
- In the IP-DNS Mapping section, select the checkboxes of the IPs that you want to delete. You can either select all, multiple mappings, or a single mapping.
A Delete button is displayed.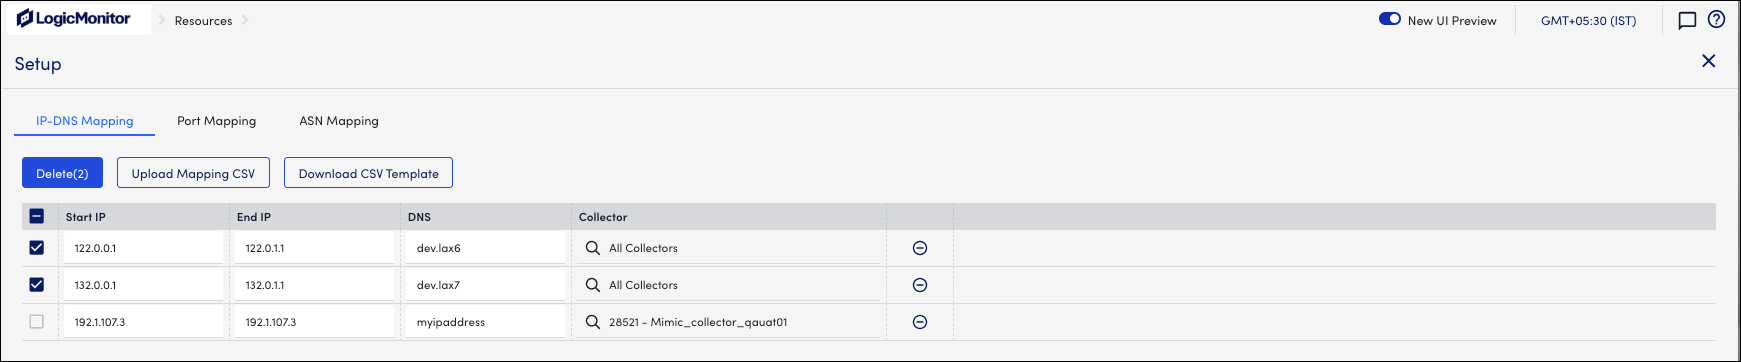
- Select Delete.
Similarly, you can bulk delete Port and ASN mappings.
Filtering Network Traffic Flow Data
You can filter the traffic flow data that displays on the Traffic tab to optimize relevancy. An active filter is applied to all data visualizations on the Traffic tab. You can save filters by clicking the Saved views icon next to the filter options.
Filter Criteria
To view the filter options, navigate to Resources > select the NetFlow resource group > click Traffic, and select the Filter option.
Use the following filter criteria to customize how traffic flow data is displayed: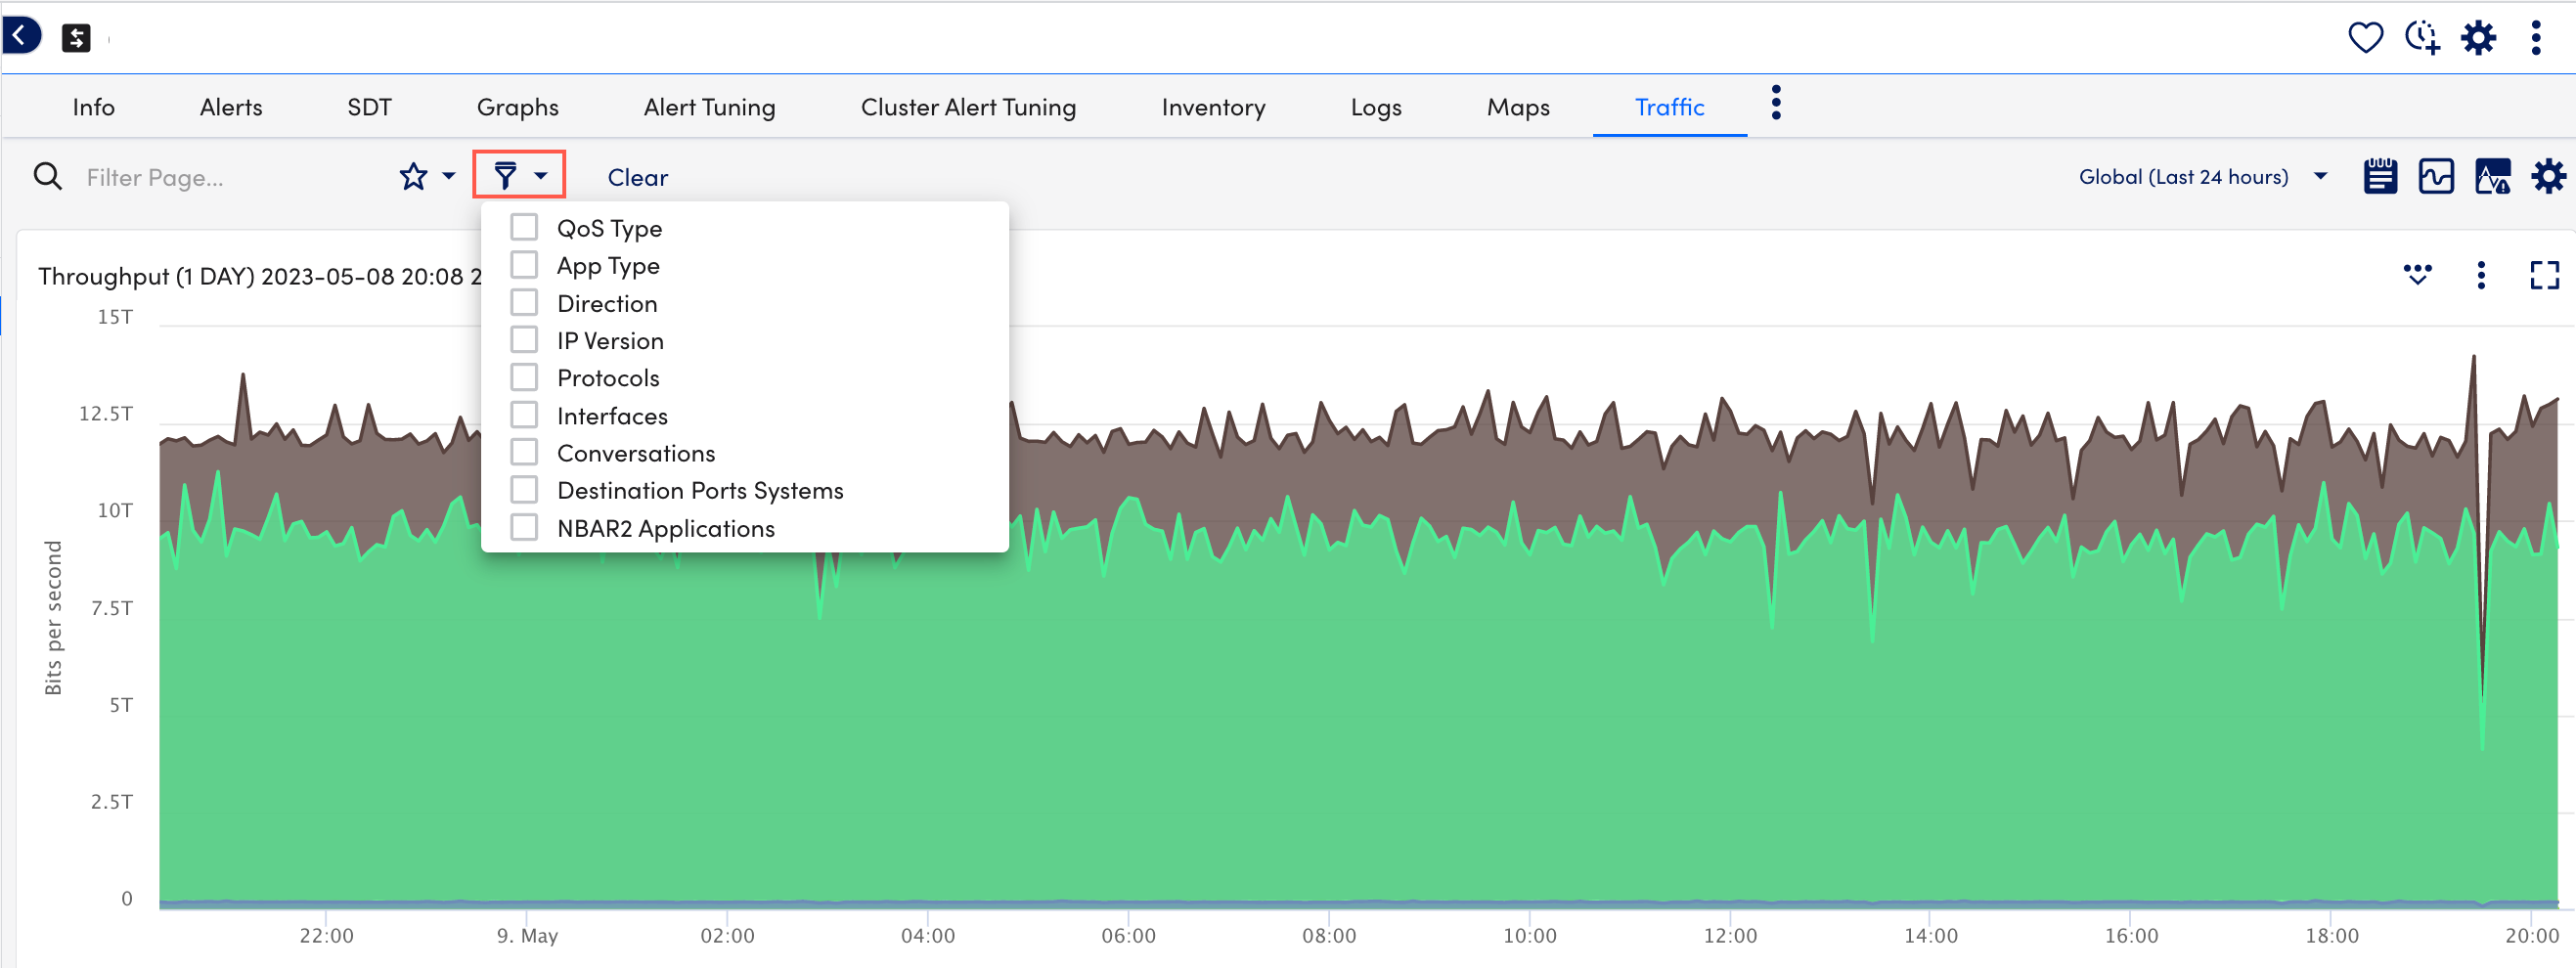
QoS Type—Use the QoS Type filter to restrict Traffic tab visualizations to a subset of QoS policies.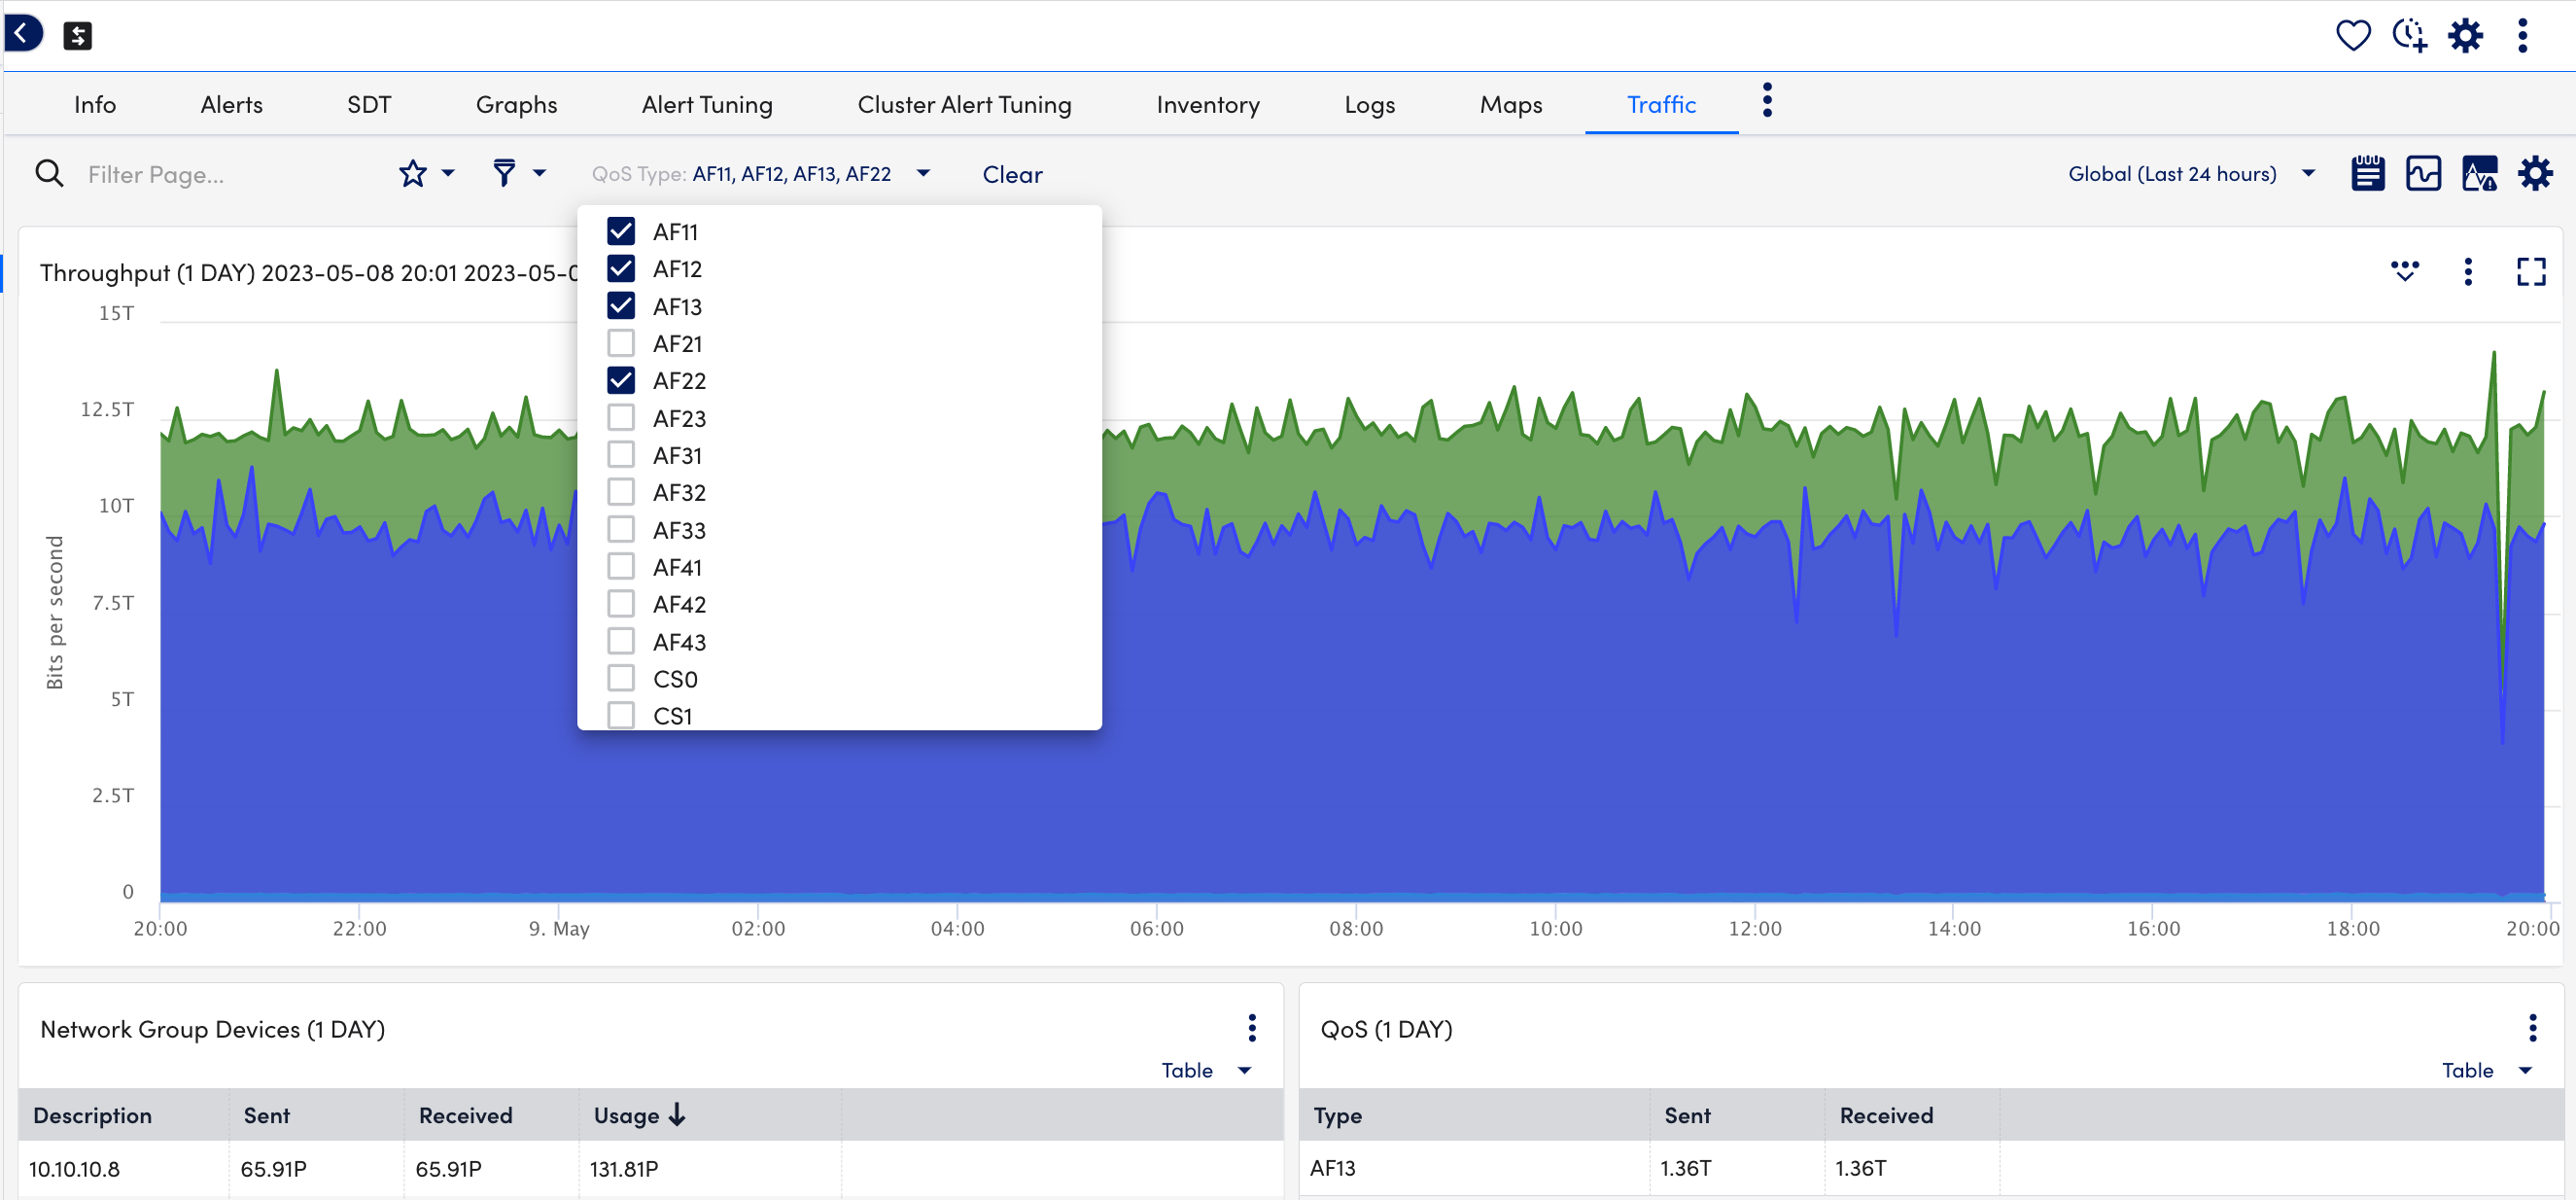
App Type—Use the App Type filter to restrict Traffic tab visualizations to a subset of application type categories, as provided by NBAR2.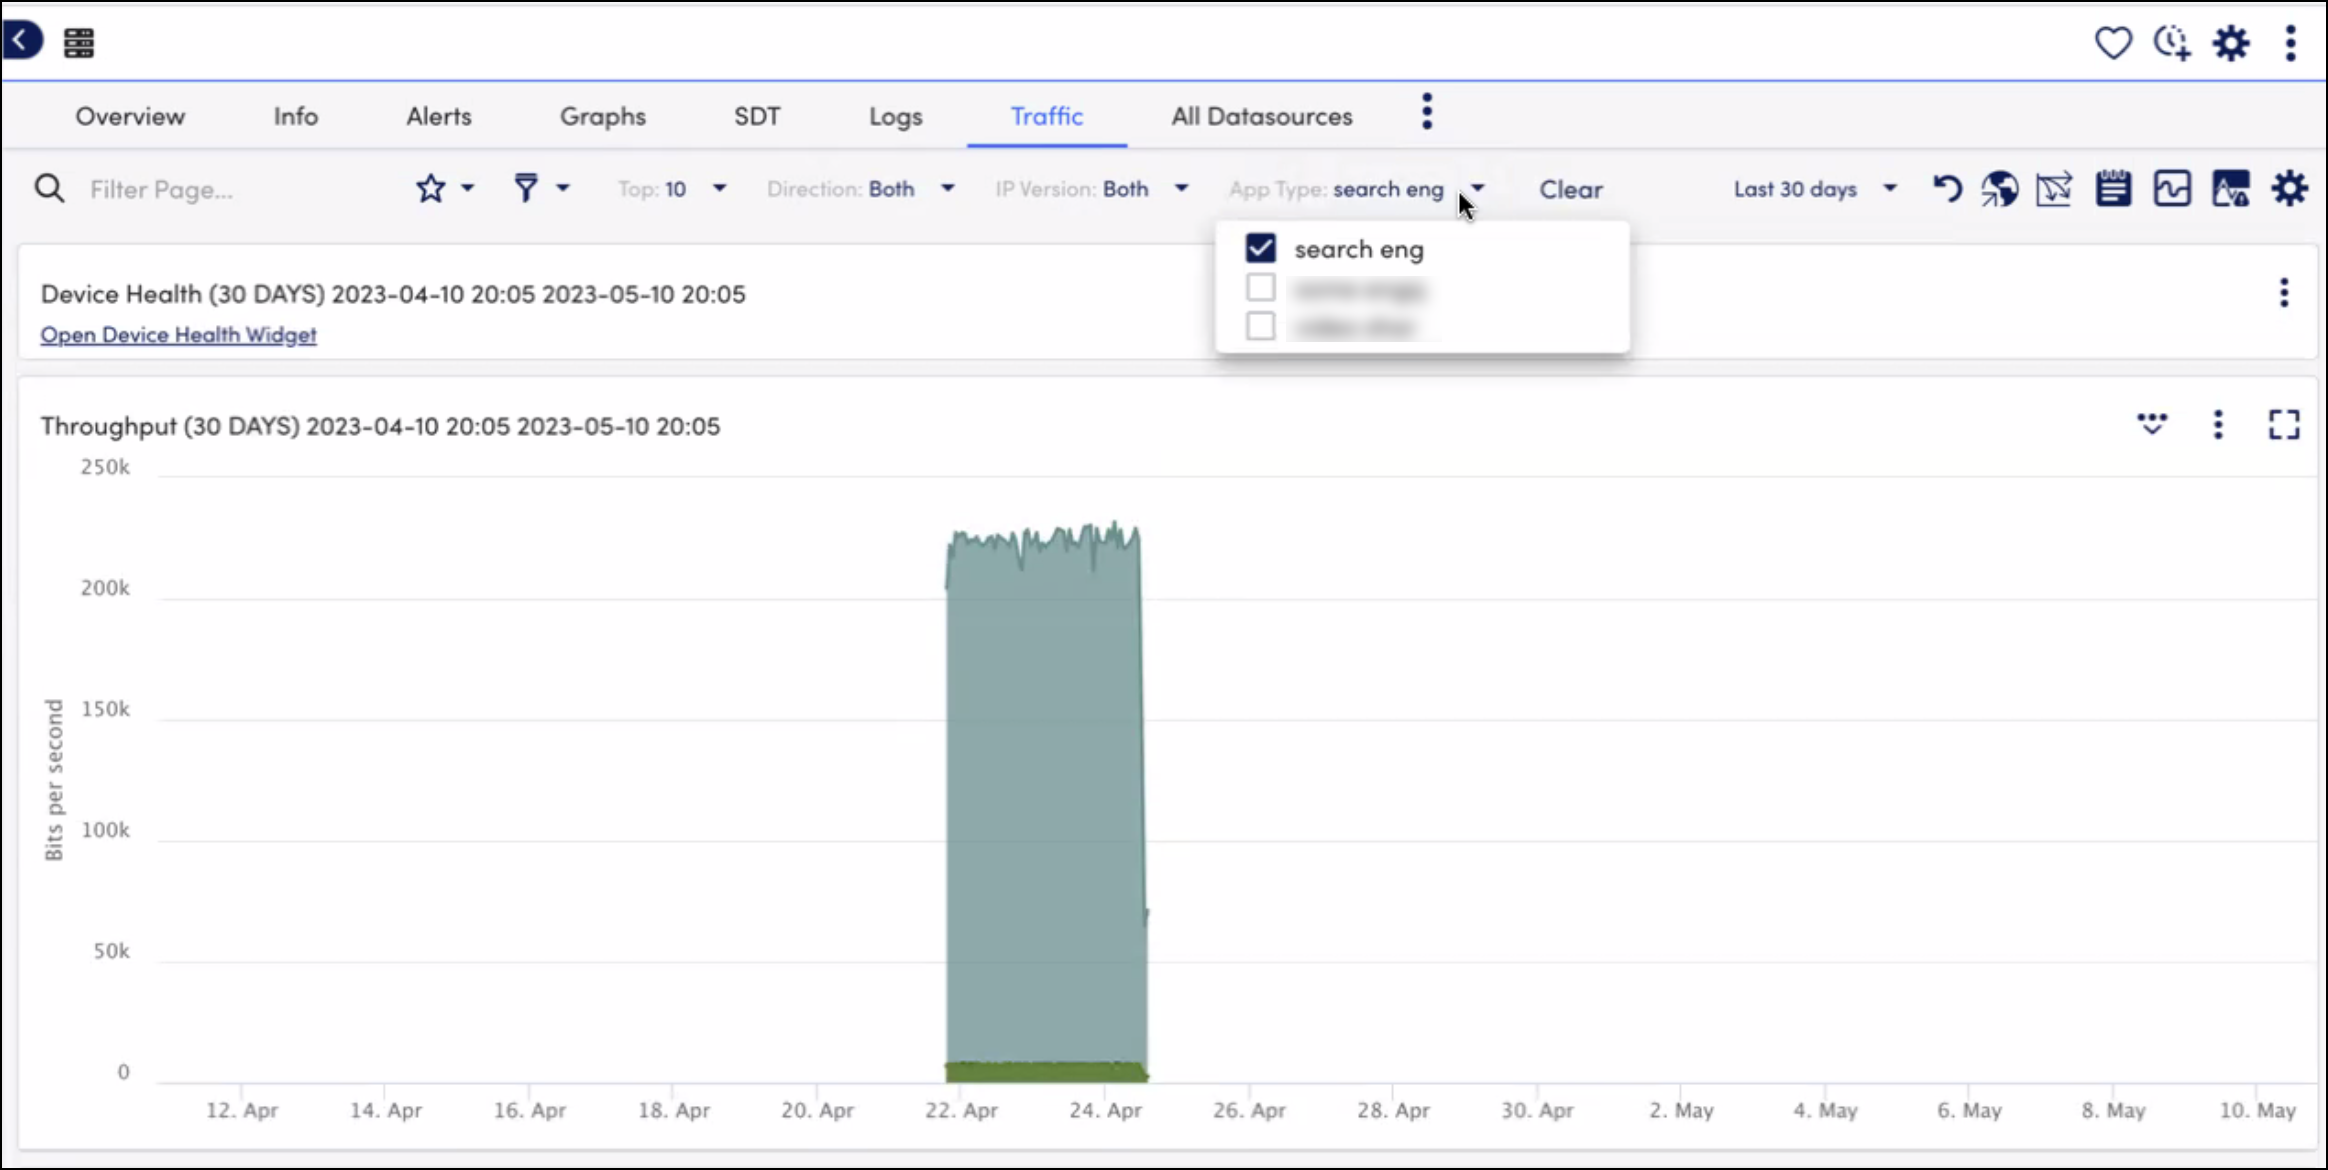
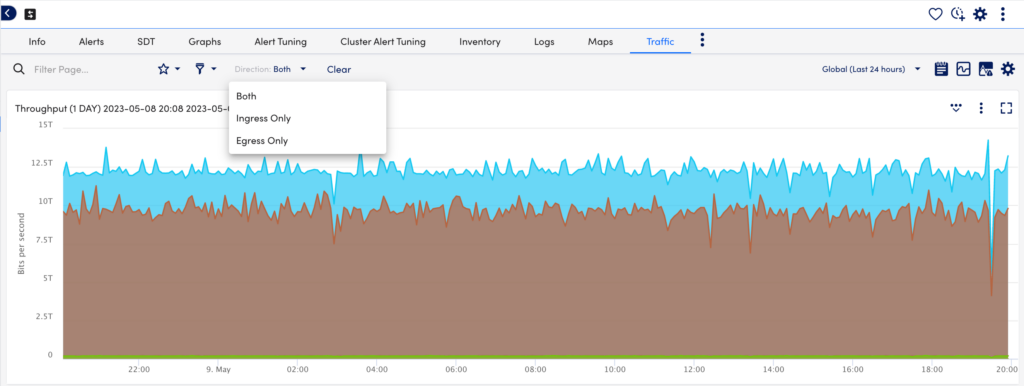
Direction—Use the Direction filter to restrict Traffic tab visualizations based on traffic direction.
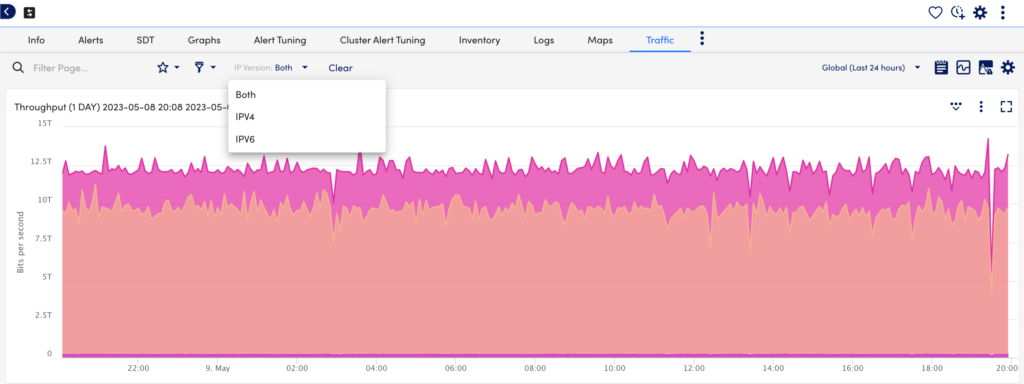
IP Version— Use the IP Version filter to restrict Traffic tab visualizations based on the IP version being used.
Protocols—Use the Protocols filter to restrict Traffic tab visualizations based on the protocol being used.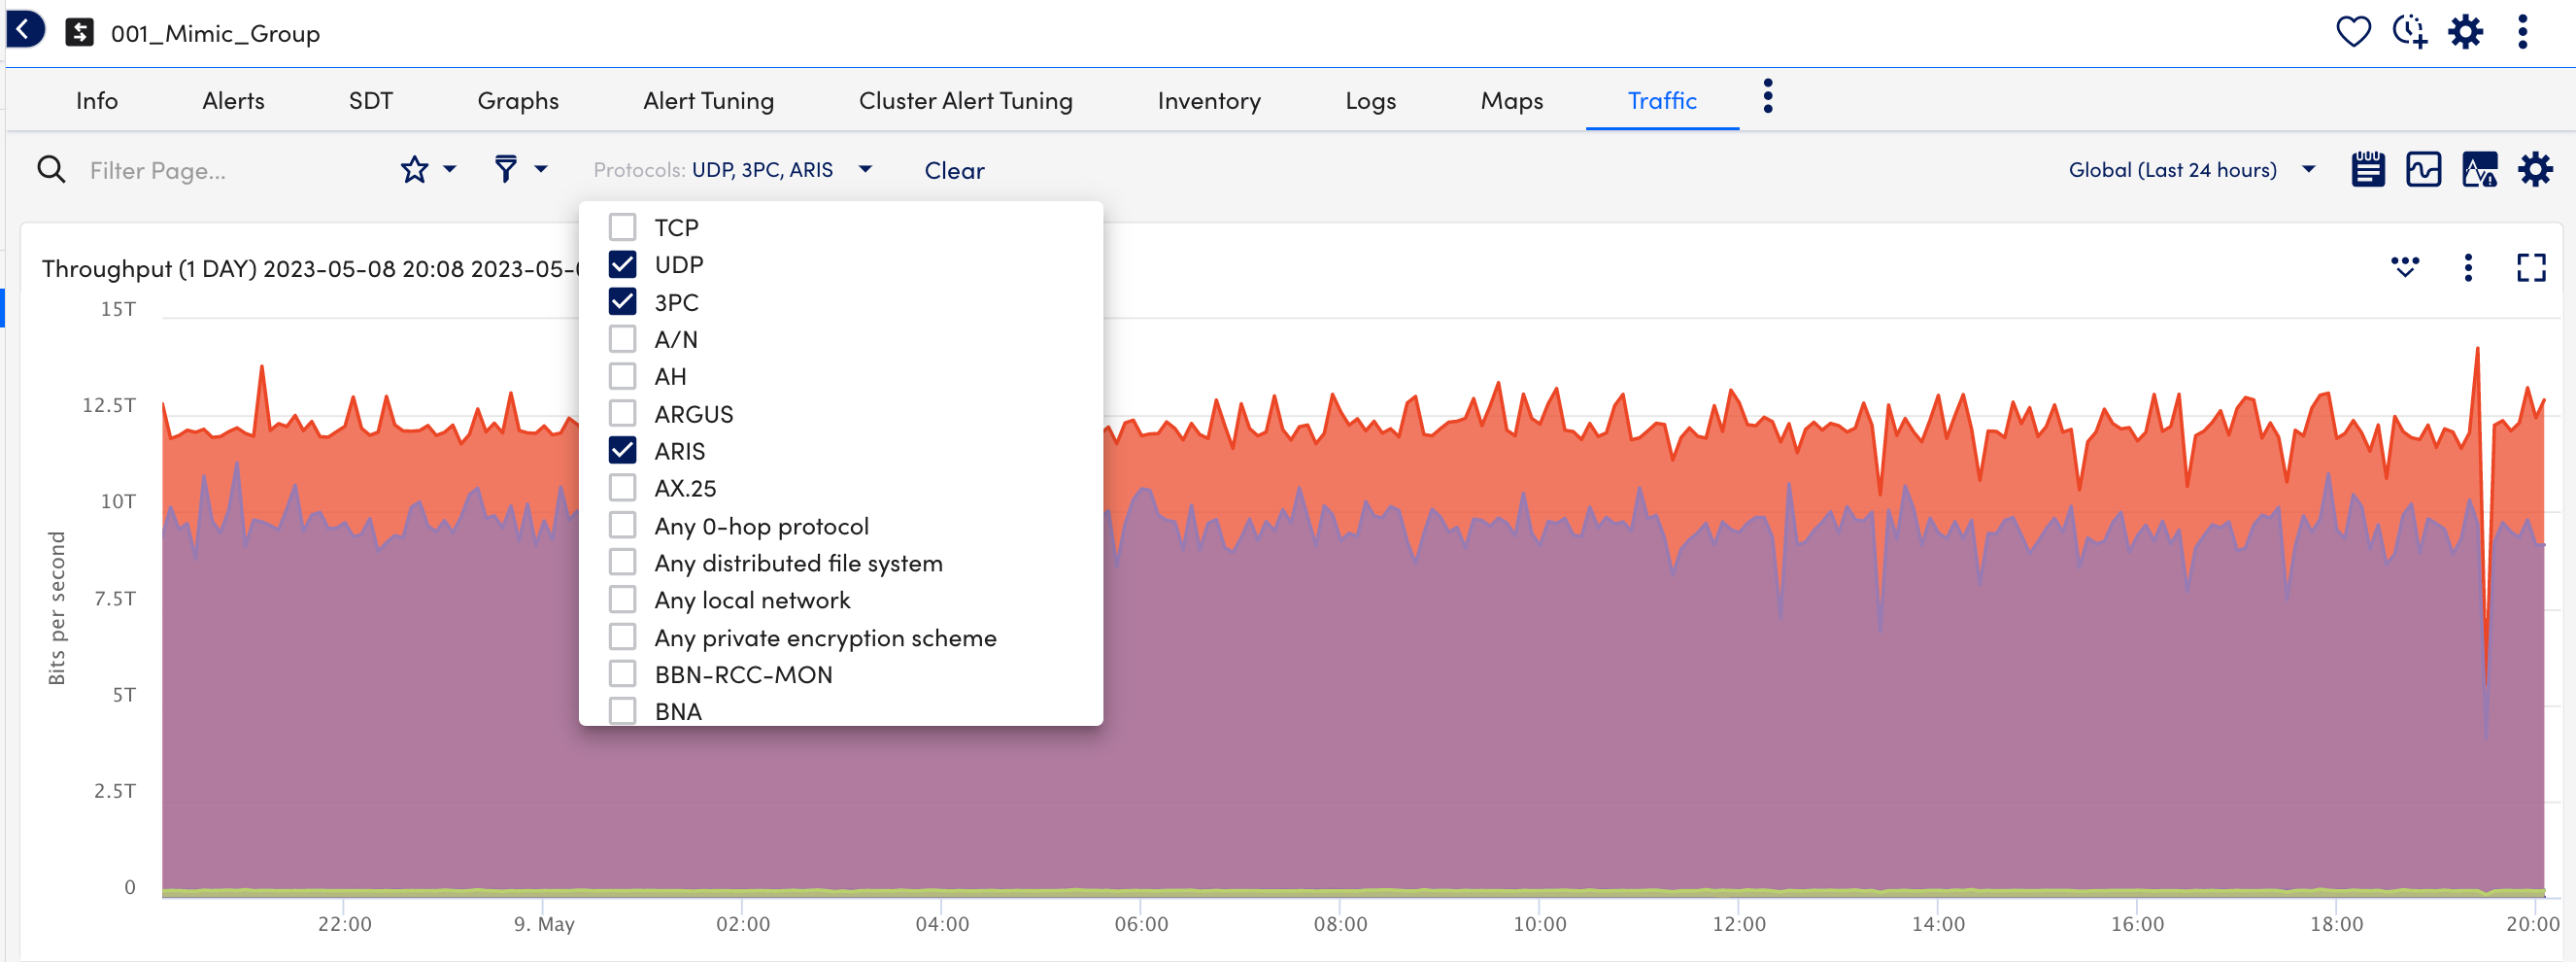
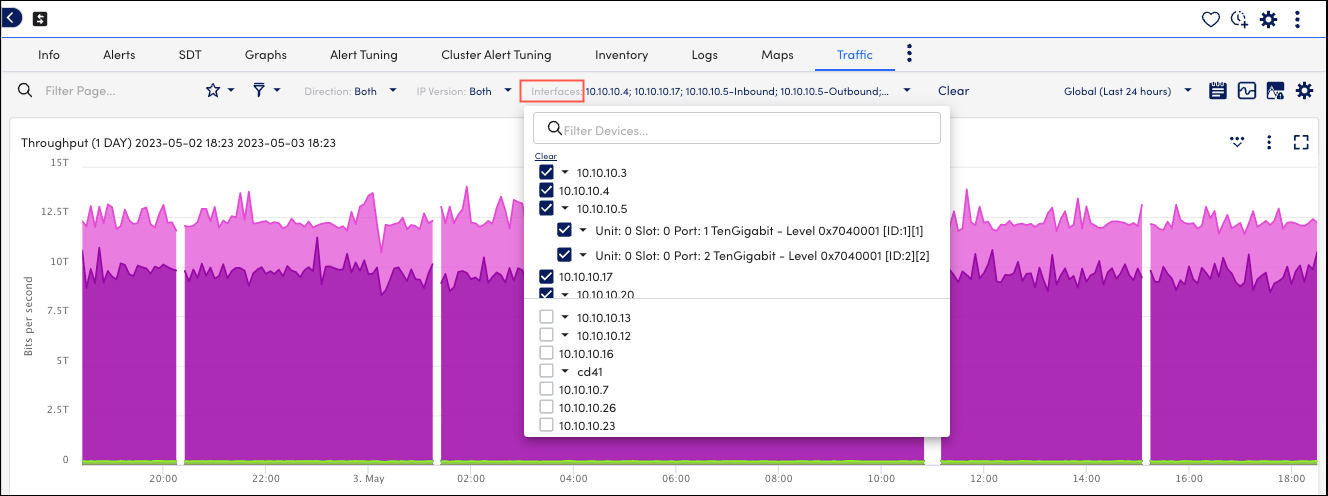
Interfaces—Use the Interfaces filter to restrict Traffic tab visualizations to a subset of interfaces. In addition, you can see the list of NetFlow devices in the filter to select the interface for the required resource.
By default, the top 10 resources based on bandwidth consumption are selected in the list.
Note: You can select a maximum of 10 resources. To add another Netflow device, you can add the required Netflow device from the list. In addition, you can search for the required NetFlow device by entering the name in the Filter device field.
Conversations—Use the Conversations filter to include or exclude explicit conversations between one-to-one, one-to-many, many-to-one, or many-to-many endpoints. This filter supports the creation of multiple sets of criteria, which are joined using the OR operator.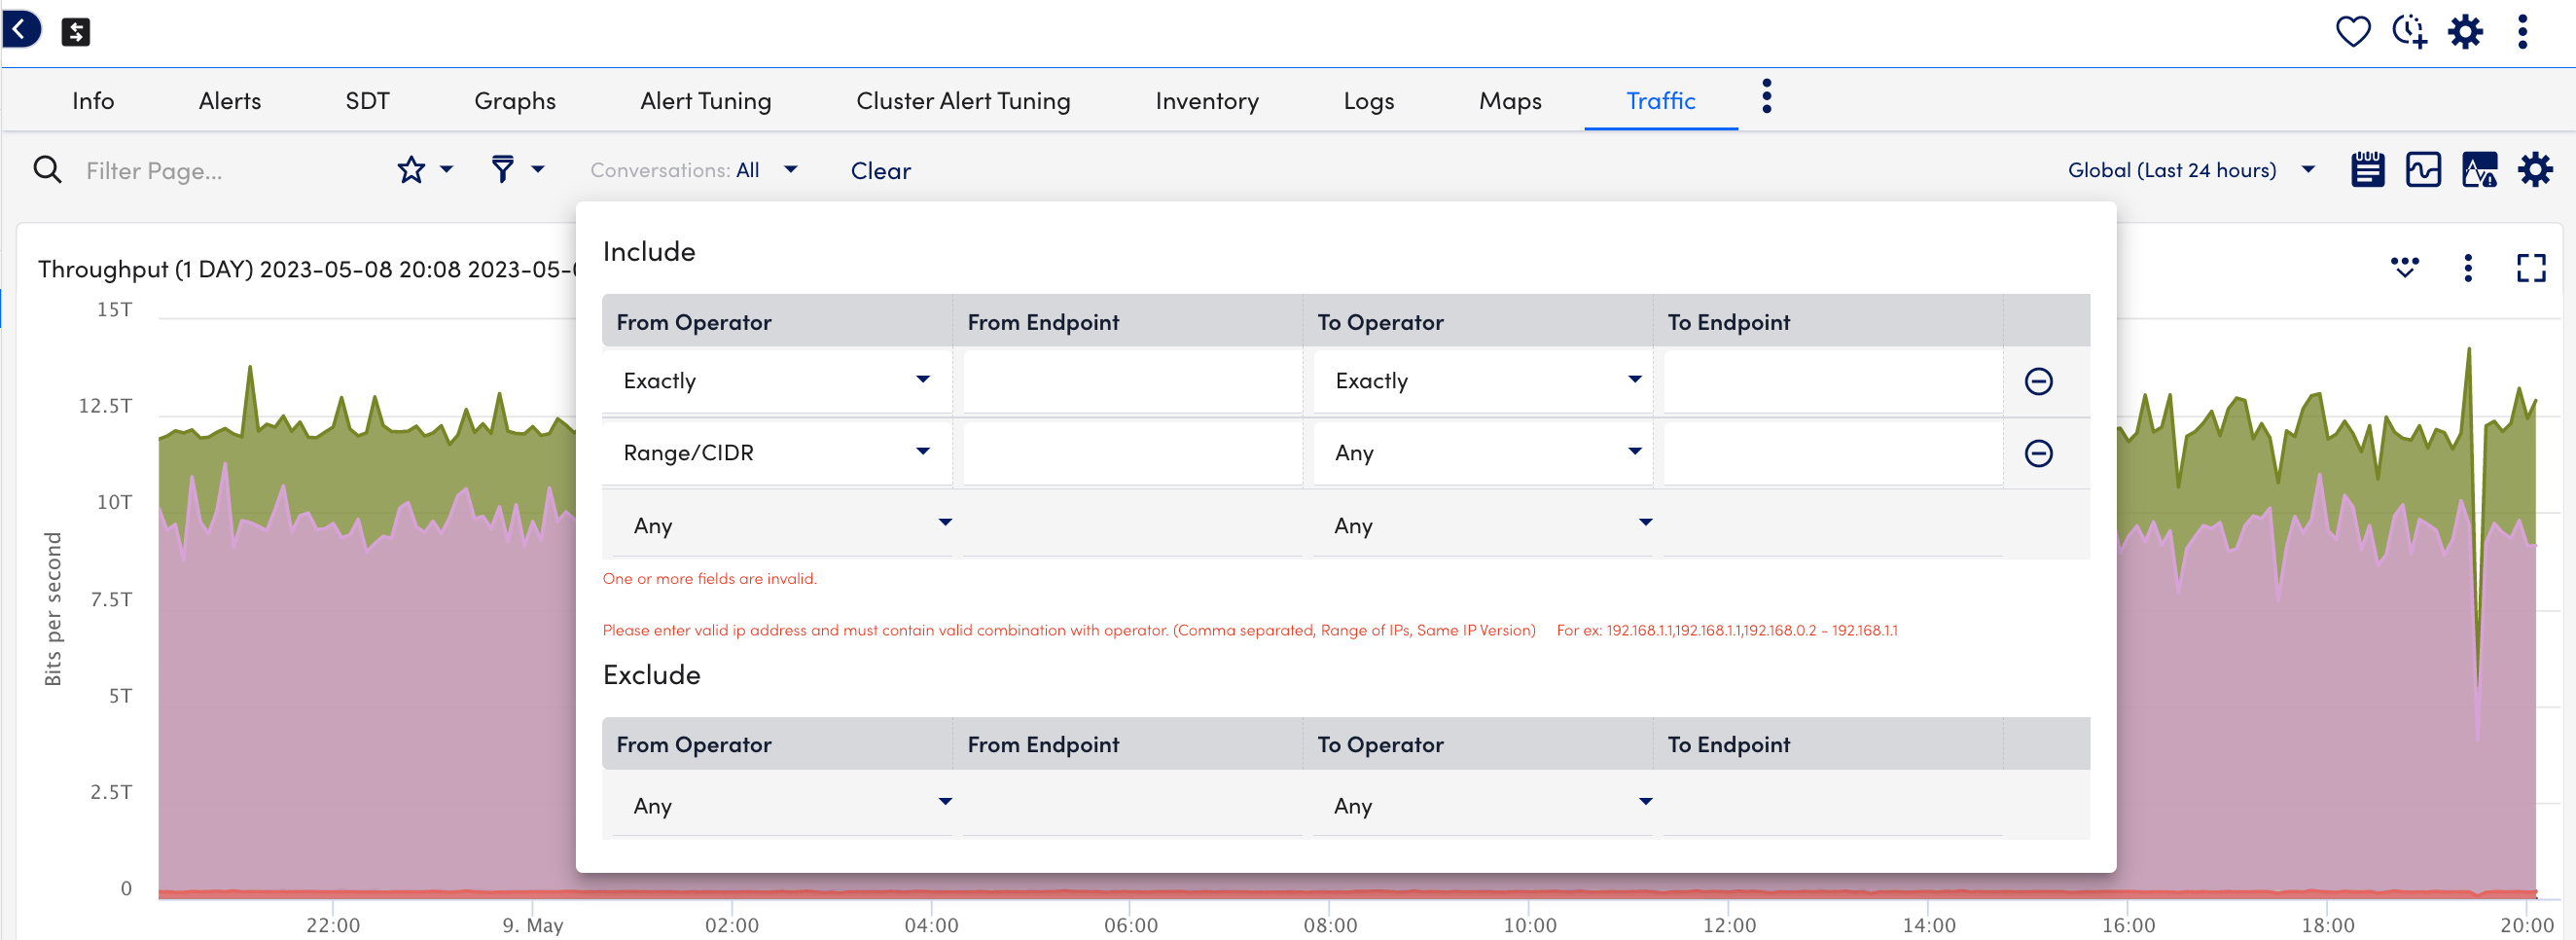
Destination Ports Systems— Use the Destination Ports Systems filter to restrict Traffic tab visualizations to a subset of destination ports (comma-separated values supported).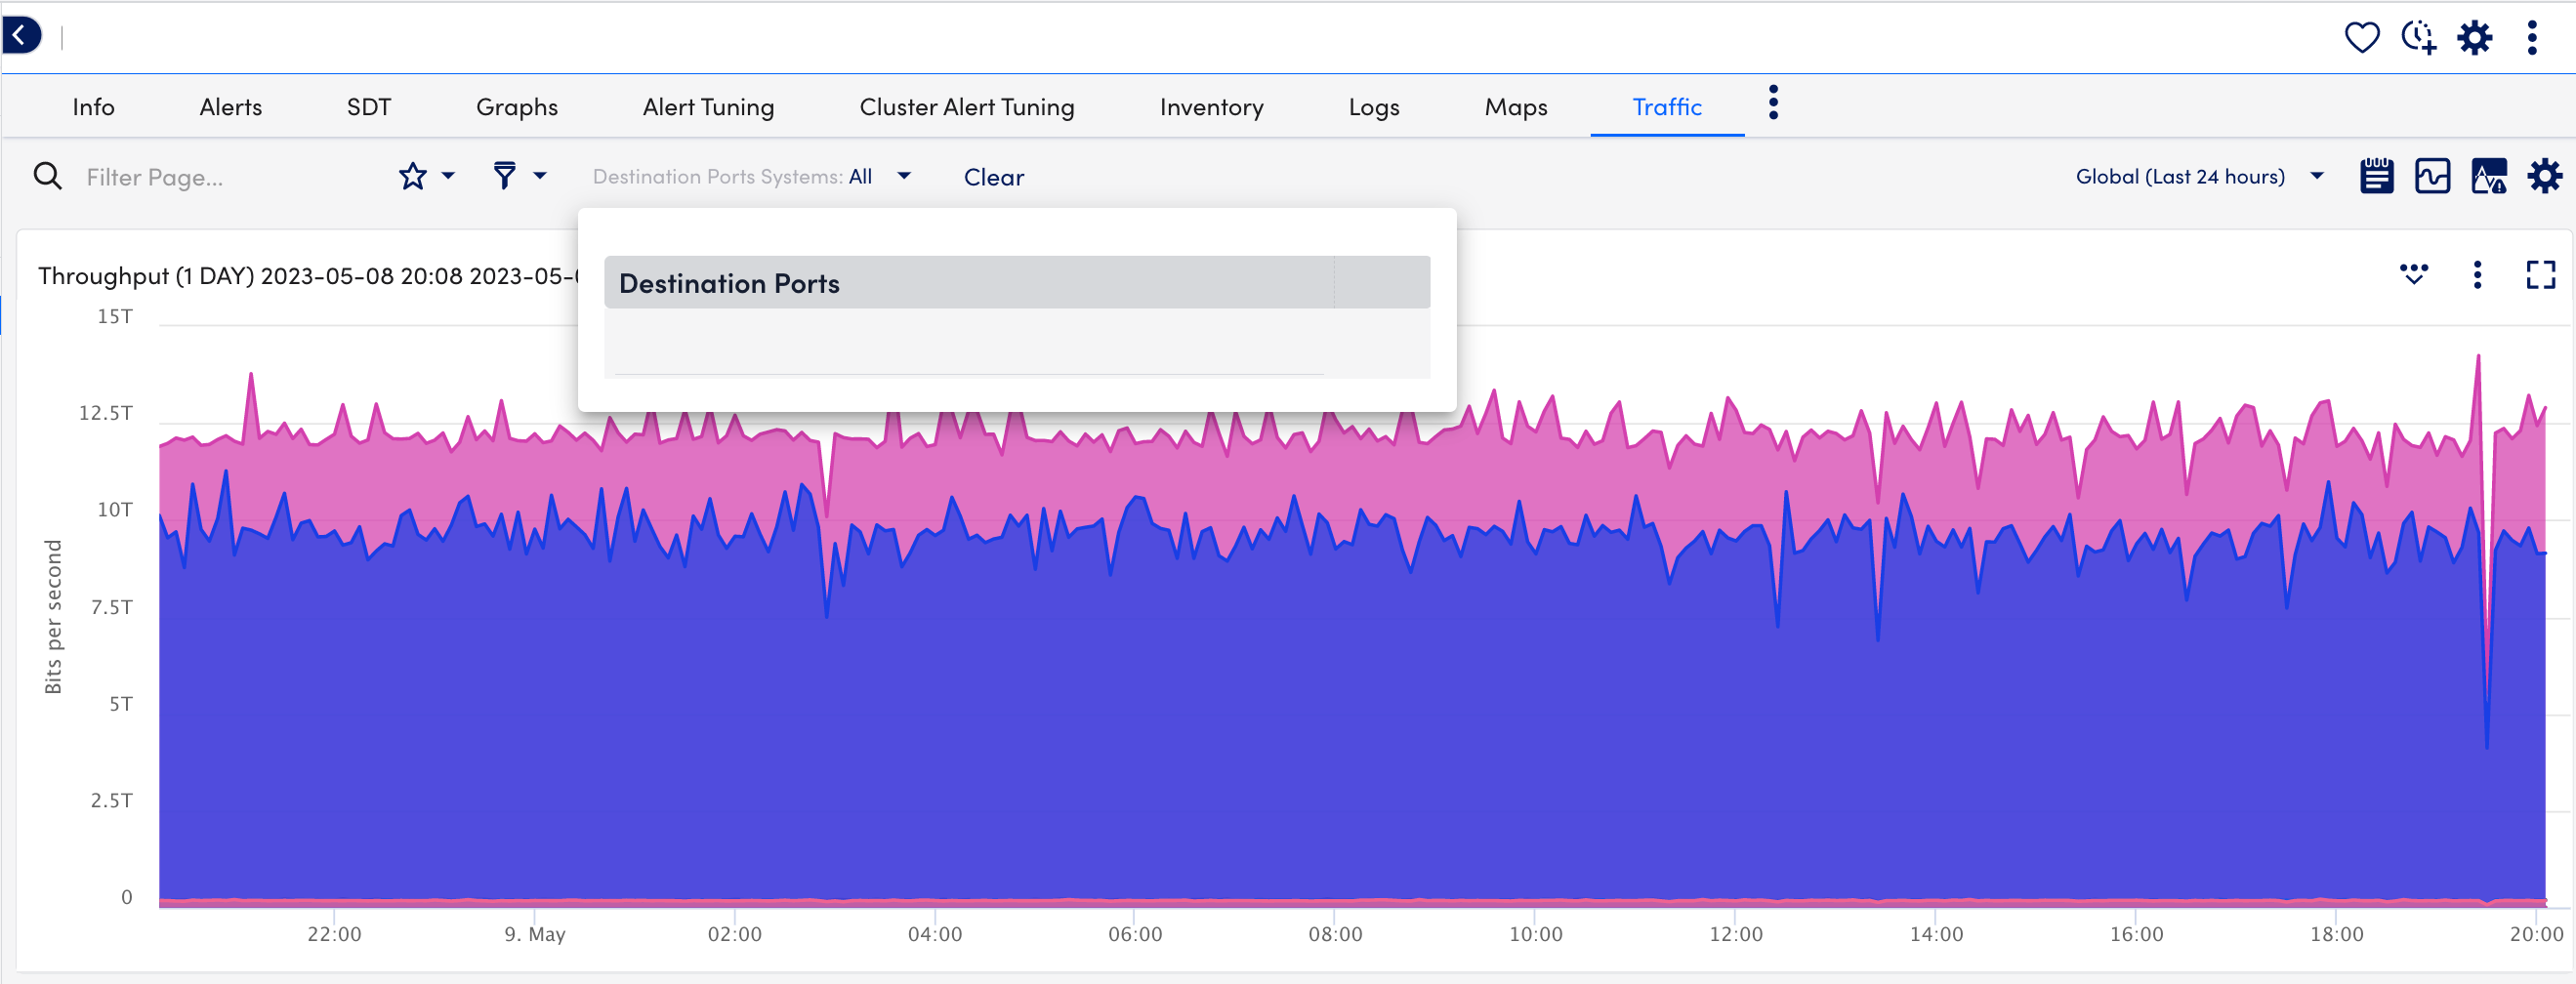
NBAR2 Applications—Use the NBAR2 Applications filter to restrict to (or exclude) a subset of applications, as provided by NBAR2.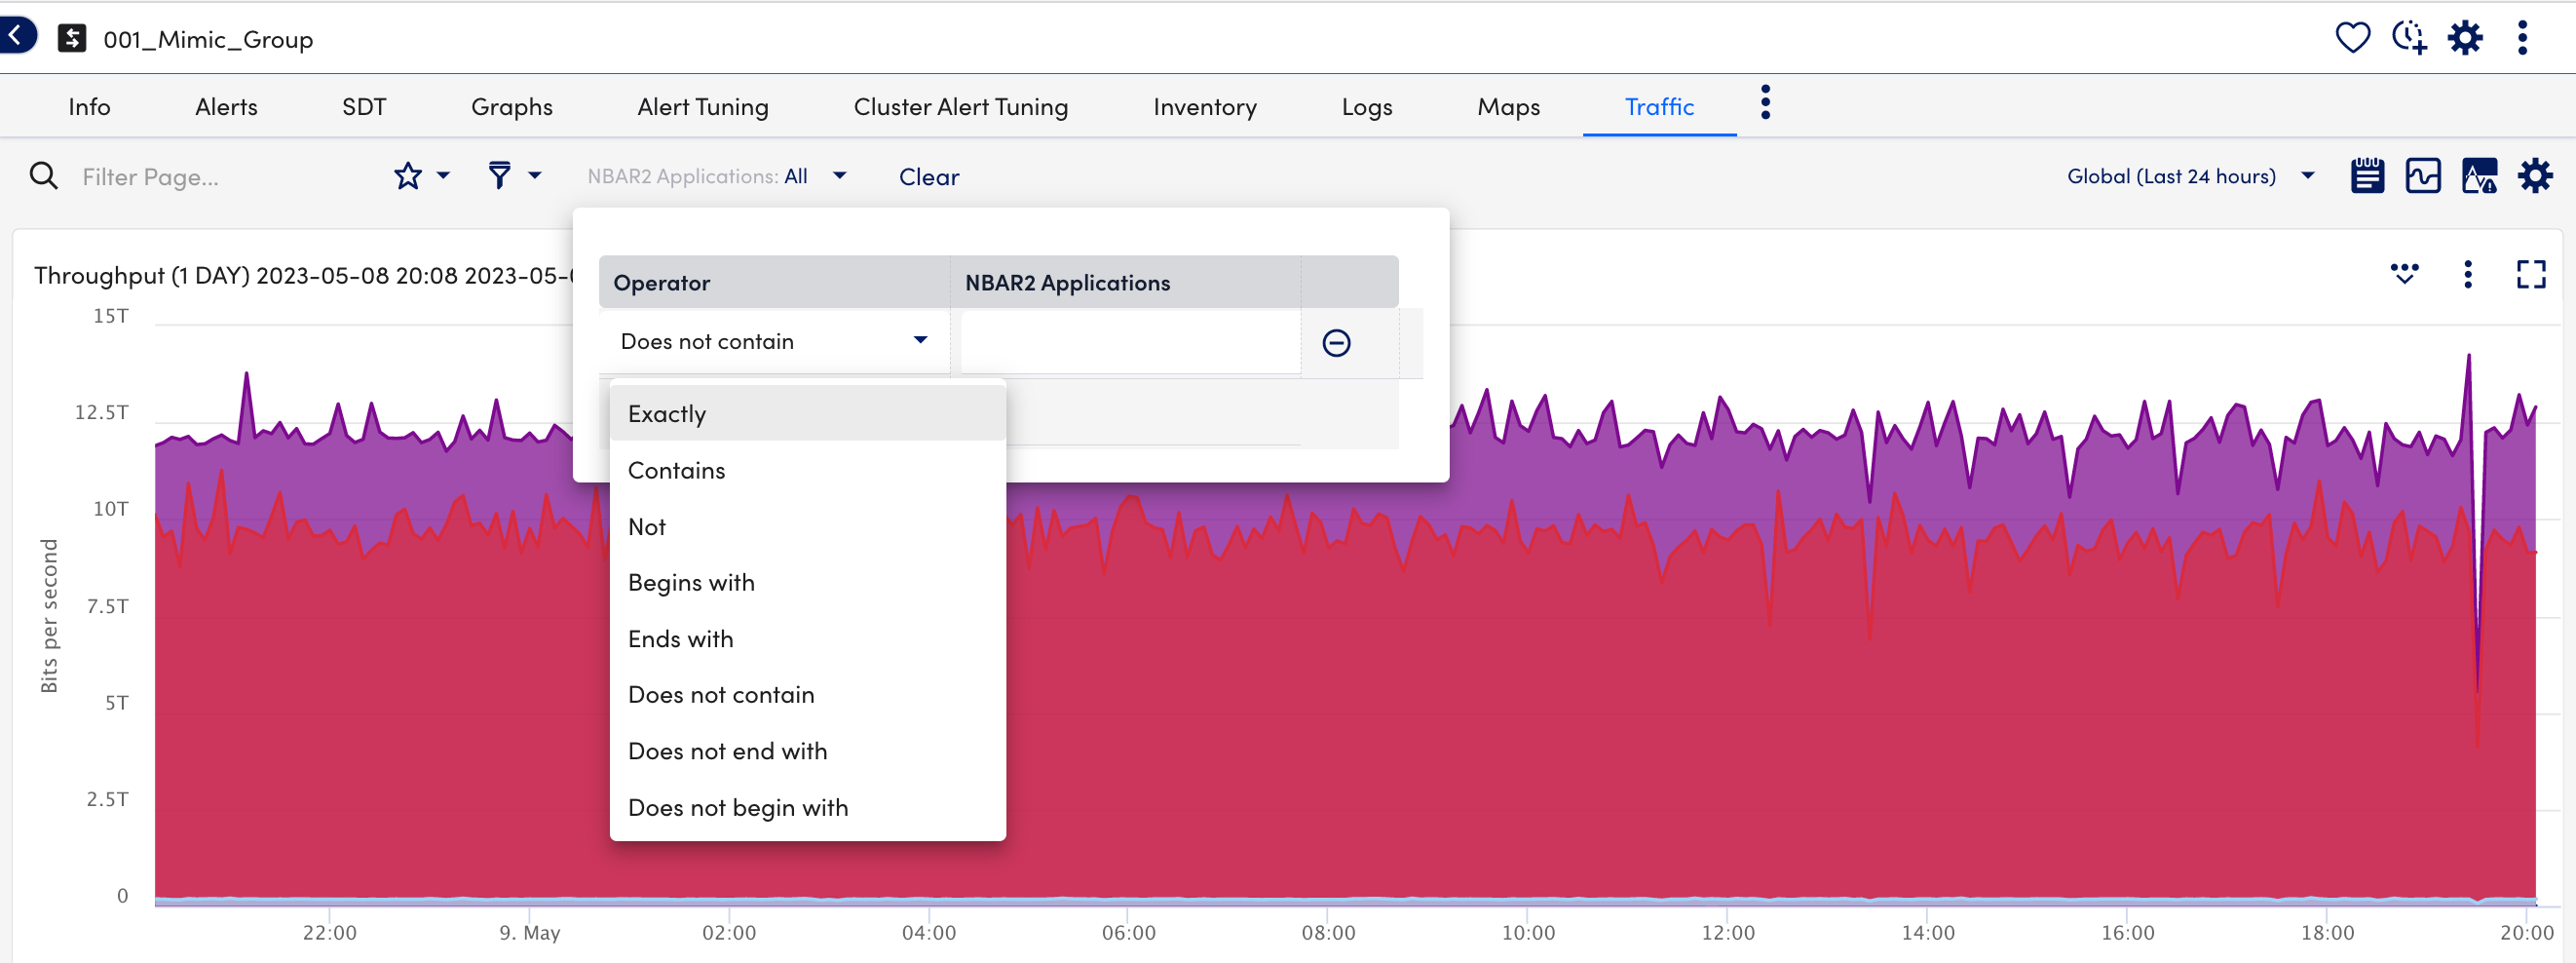
Top—Available at the resource level only, Use the Top filter to restrict the data visualizations to the top 10, 20, 50, or 100 results.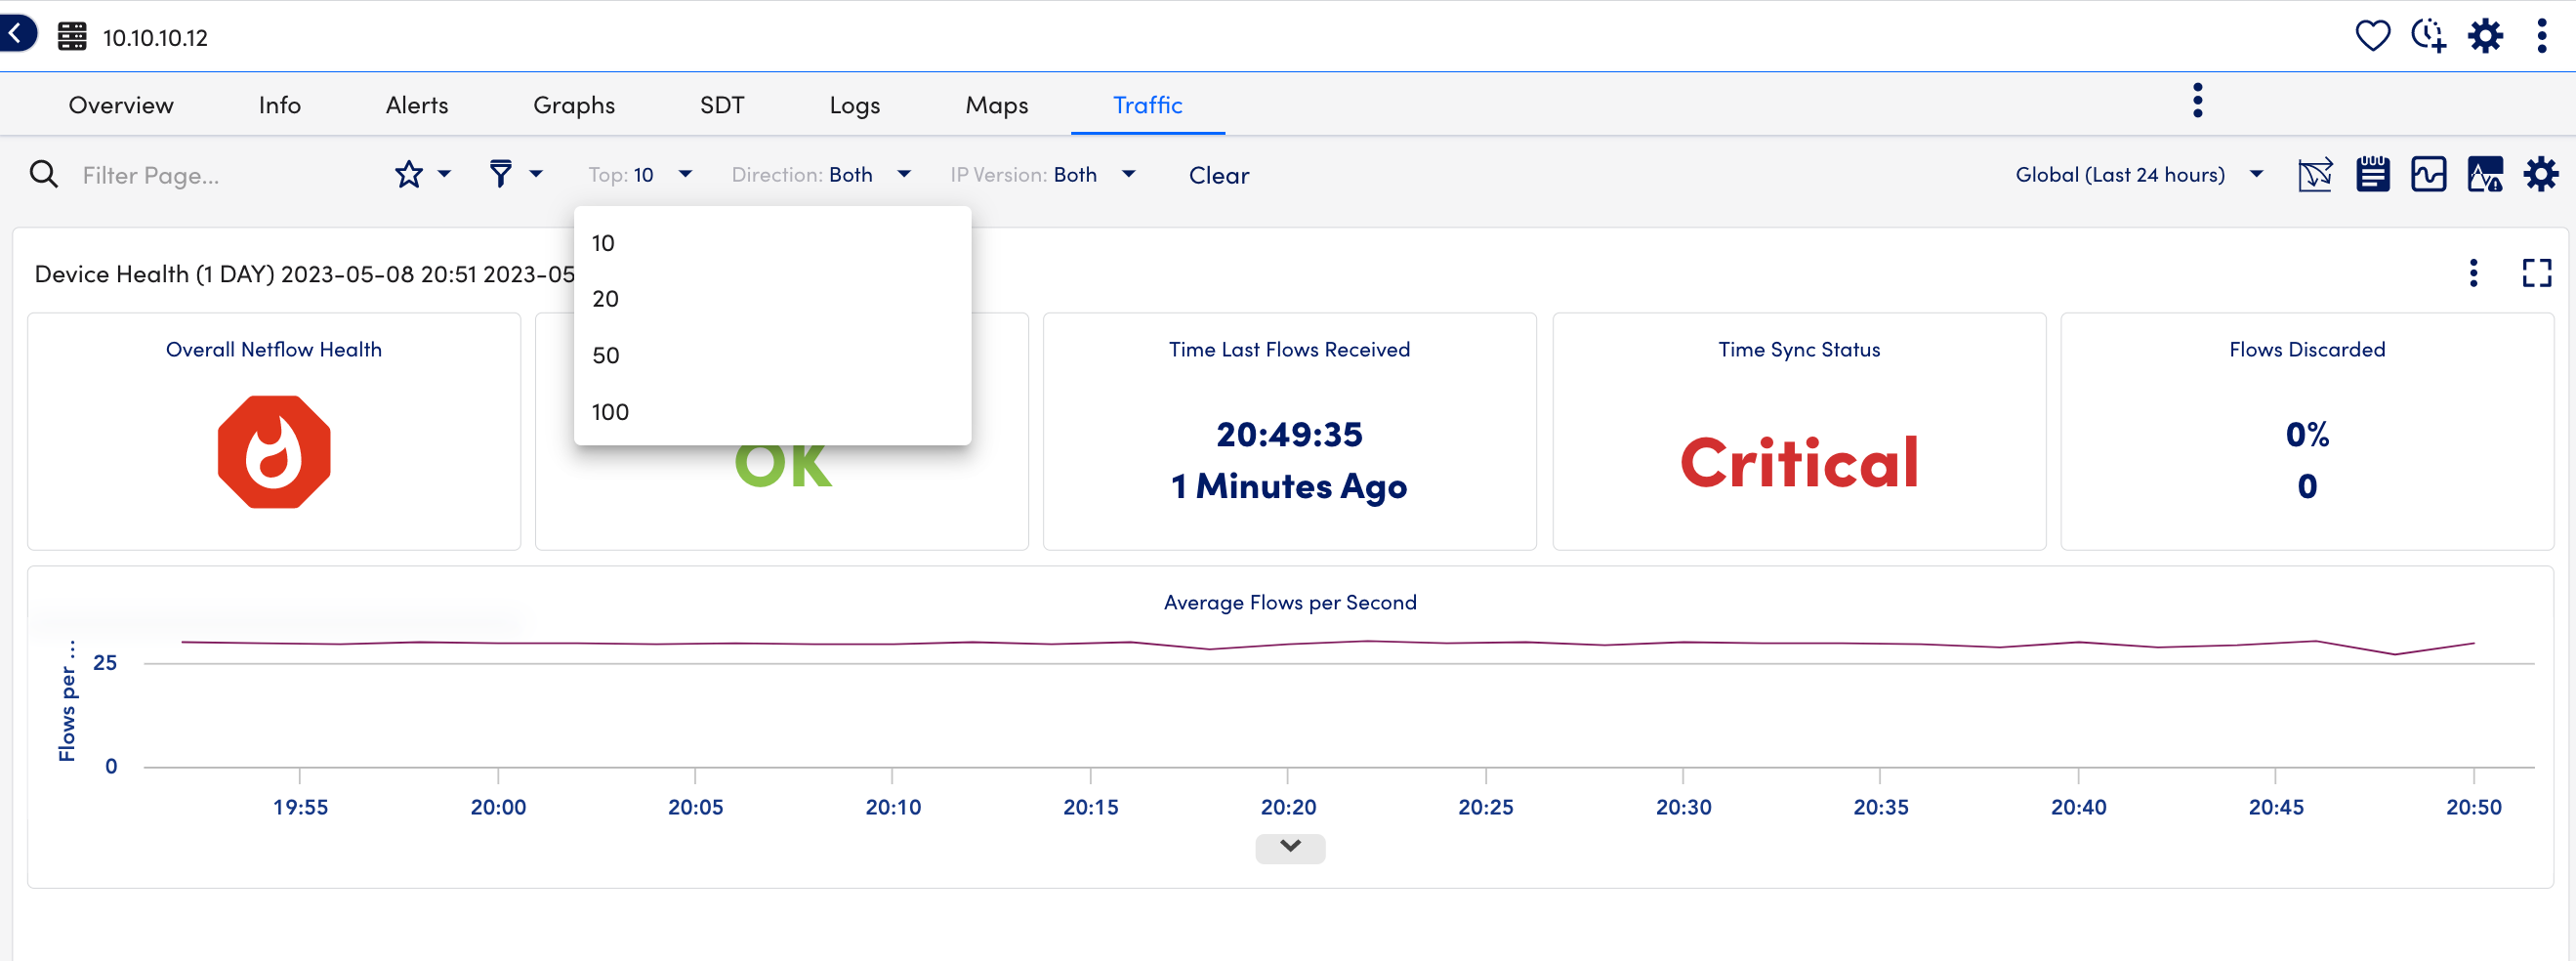
Note: Multiple criteria within a single filter are joined using an OR operator; criteria across multiple filters in the same saved filter set are joined using an AND operator.
