
Cloning a Edwin AI Dashboard
Last updated – 24 July, 2025
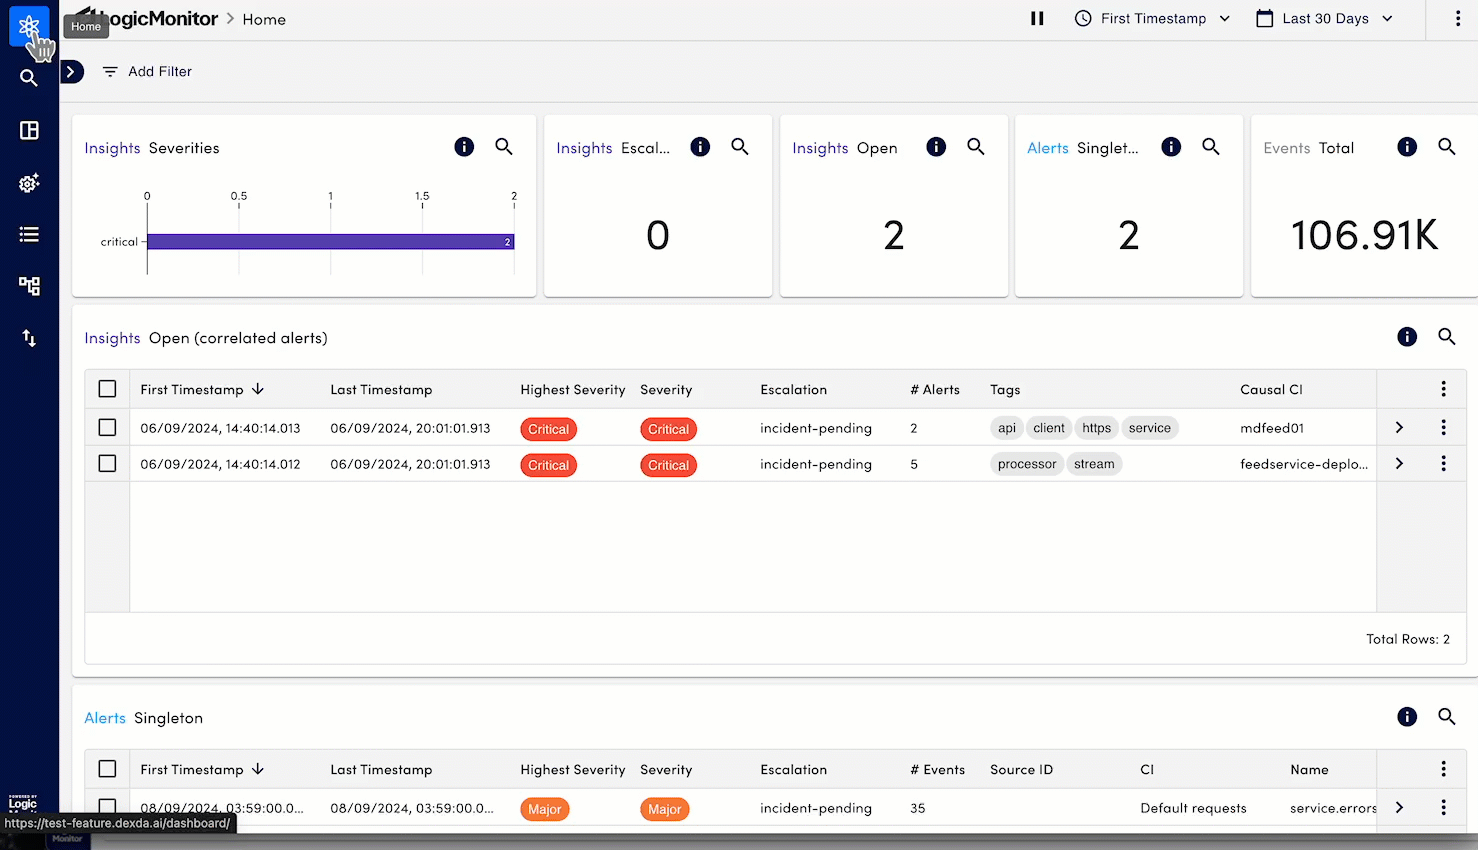
Dashboards are central in Edwin AI as a starting point from where you can quickly get a situation overview. Use Dashboards to visualize data using charts of different types. Charts get information from different data records stored in Edwin AI, such as insights, alerts, and events. You can add filtering to charts to customize the visualization output for specific purposes and user groups.
Prerequisites
You will require the following roles to create and manage dashboards:
| Role | Description |
|---|---|
| Dashboards and Alerts | Select the View and Manage options. For more information on roles and permissions, see Dexda Roles and Users. |
Procedure
- On the Edwin AI Home page, select Dashboards. A list of dashboards appears.
Note: To understand how to navigate dashboards, see the Dashboards page. - Select the copy icon on the dashboard you want to clone. This will open a reference of the chosen dashboard with the prefix Clone of.
- Customize the dashboard and charts as required. For more info, see .
- Select Submit.
Tip: To undo any changes, use the Reset option on the top-right.
