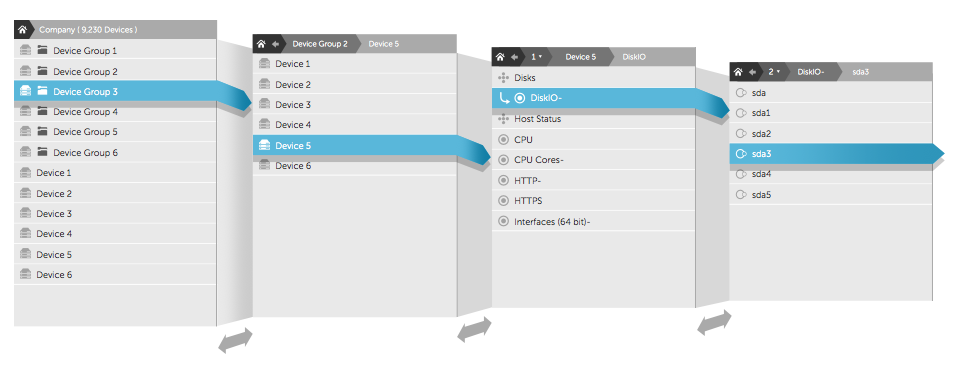
We have been making many changes and promises, asking you to be patient for features right around the corner. With 2015, the time has come! Along with ongoing performance and functionality improvements, we’re very excited to announce the full beta release of the New UI and Network Traffic (formerly Netflow). Stay tuned as this is just the beginning.
New UI – Full Beta Release
The Devices and Settings sections round out the full beta release of the New UI. It’s worth a scan of the [intlink id=”17245″ type=”page”]documentation[/intlink], particularly as the Devices section brings many changes.
Although they may take some adjustment, you will find many efficiencies have been introduced . We’re working on the polish, but don’t hesitate to submit feedback to the LogicMonitor support team by emailing [email protected] or via the ‘Chat with engineer’ button in your LogicMonitor account.
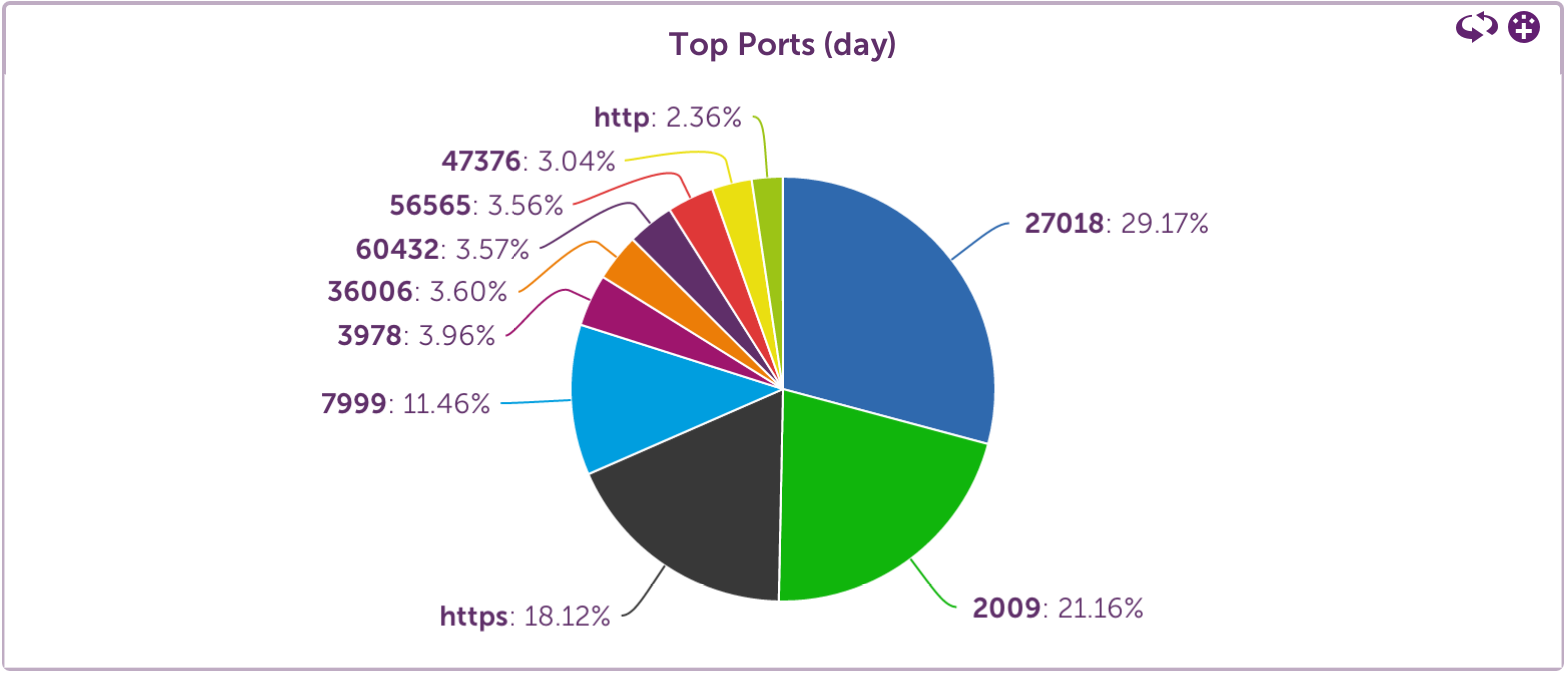
The full beta release also allows us to get the new [intlink id=”17423″ type=”page”]network traffic functionality[/intlink] into your hands.
Everything we’ve promised – pie charts, filtering, issue research, is available in the traffic tab. Give it a try and tell us what you think.
Improvements
- Unanswered voice call alerts now wait for voice mail prompts, to allow for complete message recording.
- Updates to device properties are now fully logged in the Audit Log, including the property changes and type of change.
- Support for ‘system.description’ as a variable reference within an ‘Applies To’ function.
- Support new ‘##POLLINTERVAL##’ token in complex datapoint or user-defined script expression fields (see tokens available for additional details).
Bugs resolved
- Fixed the Import function on datasources to update the collector type where required.
- Audit log now includes user logins from Single Sign On (SAML).
- Correctly handle Windows External Script datasource with ” in pathname
- Updated the getGraphImage() API call to be consistent with the UI image for area type graphs.
- Correctly handle Script datasource with multiple command-line arguments (previously, only the first argument was passed).
- SiteMonitor alerts for individual locations were generated but not escalated when suppress individual location alerts was enabled. No individual alerts will be visible in the UI if suppress alerts is selected.
- Fixed Interface Bandwidth report to exclude interfaces with monitoring disabled.
- Support for large Host Metric Trend reports: if the number of instances exceeds the maximum supported in a real time report, the report will be emailed.
- Fixed alert messages messages that contain special characters such as ‘∞’, which were previously truncated for some customers
- Fixed an issue with changing thresholds on instances whose names contained special characters.
- Corrected an issue with the Alert Report listing an incorrect rule in some situations
- Corrected an issue that prevented parenthesis being used in Datasource names since the last release.
- SiteMonitor alerts were incorrectly being matched to alert routing rules regardless of the value of the rule’s datapoint field.


