


That’s a wrap! v.83 marks the final LogicMonitor release of 2016. It will be rolled-out through the second week of December. We are finishing the year with several major new features, including PropertySources, Dashboard Reports, and Two-Factor Authentication, as well as the usual gamut of improvements and bug fixes.
We already have a vast lineup of features in store for 2017- so sit tight! We look forward to sharing some of them after the holiday season.
Two-Factor Authentication
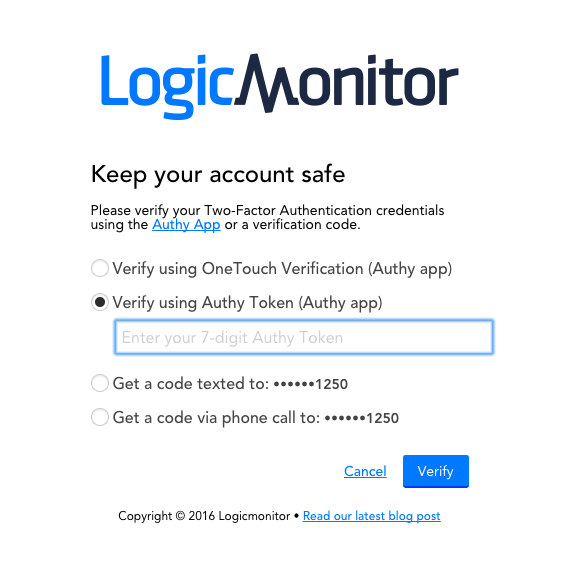
We now support Two Factor Authentication when accessing your LogicMonitor account. In addition to a username and password, users with Two Factor Authentication enabled will use a third party application, Authy, or an authentication token delivered via SMS/voice to verify their identity. Any user can opt in to Two Factor Authentication, and administrators can require it at the account, role, or user level. Not only does this provide an extra layer of security, it will also be especially useful for anyone who wants secure authentication processes without having to establish integrations with all their end users’ SSO providers.
We are happy to introduce a much anticipated new LogicModule: PropertySources. The system properties LogicMonitor auto discovers are very useful, but there is commonly other information you’d like to track about your devices. Using a custom Groovy script, you can now retrieve additional system information- ie. serial number, port speed, firmware version, etc- and save it as a device level property. This has a wide-range of benefits for improved inventory tracking/reporting, troubleshooting, as well as dynamically grouping devices based on shared properties.
Note that PropertySources will be turned on in users’ accounts once v.83 is fully rolled-out.
Dashboard Reports
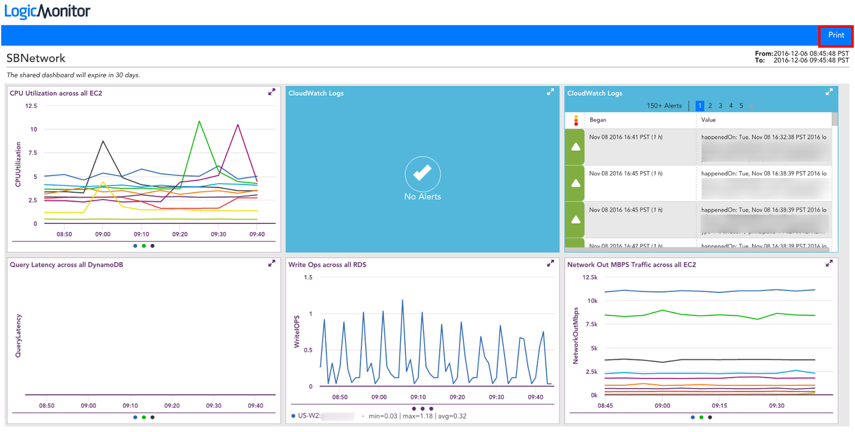
What goes better with a cup of coffee than a donut beautiful report? Dashboard Reports build upon our Dashboard Sharing feature by enabling you to send a snapshot view of your Dashboards via a scheduled report. This is particularly useful for distributing at-a-glance metrics to your team, peers, end users, or non LogicMonitor users.
REST API
With our REST API, you can now:
- Get graph data
- Import DataSources via XML
- Manage alerts
- Manage API tokens
- Manage AWS Groups
- Manage Device and Group level properties
- Manage Users
- update Services and Service Groups via HTTP PATCH. You may find this useful if you’re trying to update one or a few fields for a Service or Service Group, and don’t want to use PUT to replace the whole JSON definition.
Note that we’ve also improved the groupType field for the REST Device Groups resource. Specifically, we’ve changed the value from an Integer to a String to make the group type clearer.
This new functionality rounds out v1 of our REST API, which is now comparable to and even extends what is available via our existing RPC API. In addition to offering more coverage in most areas of the product, our REST API includes a more secure authentication method and a more consistent syntax that meets RESTful standards. We think you will find greater value in our REST API, and also find it easier to use. Our RPC API will be deprecated, but we will not be removing it at this time (there will be plenty of warning before that happens). However, we will also not be providing updates/maintenance moving forward. As such, we highly recommend using LogicMonitor’s REST API where possible.
Other Notable Improvements
Alerts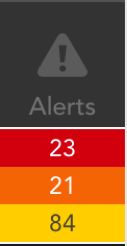
- Improved alert count display in the navigation panel. The new display is more legible and can handle larger numbers of alerts.
- Instance Level Properties can now be used in alert message templates. This allows you to customize alert messages to include information specific to the instance triggering an alert.
- Default alert templates have been updated to reference “Device” and “Device Groups” in place of “Host.”
- Improved logic behind updating data values in the alert tab
Collectors
- A preferred Collector can be assigned at the Device
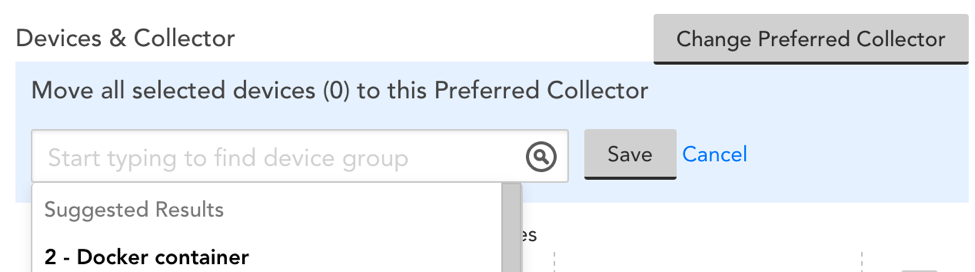 Group level. Any devices added to a group with a designated preferred Collector will default to using that Collector. You can change the assigned devices from the Manage Group screen.
- We’ve added a new “Nano” Collector size. Small, medium, and large Collector sizes require 2GB, 4GB, and 8GB of system memory to be installed. The new nano size does not have a memory requirement, as it uses <1 GB memory and is intended for a limited number of monitored devices. Requires Collector version 22.227 or higher.
- As an improvement to the new Collector size configurations, only the “small” Collector sizes can be installed on 32-bit Windows devices.
- Added the ability to bulk download Collector logs when needed.
- Audit log entries for scheduled Collector upgrades now include Collector version information. This provides a more detailed history of recent Collector upgrades, including the Collector’s versions prior to and after the upgrade.
- You can now edit the Collector’s sbproxy.conf configuration file via the UI. This streamlines the process for tuning your Collector’s monitoring capacity by allowing you to edit the config file in the UI, rather than having to login to the Collector device.
Dashboards
- We’ve made it easier to use dashboard tokens for existing dashboards. Now, you can overwrite existing fields when adding a defaultDeviceGroup or defaultServiceGroup token, which allows you to easily turn an existing dashboard into a dynamic one.
- We added performance improvements for the NOC Widget when there are thousands of devices or tens of thousands of alerts rolled-up into NOC status items.
- Specific colors can be assigned to aggregate datapoints in the Pie Chart Widget.
- Added support for rounding and limiting decimal points for columns in the Table Widget.
- Extended the “download to CSV” option to Gauge and Pie Chart Widgets.
DataSources
- The Linux Processes DataSource now assigns a process’ full path as the instance name, allowing for the addition of similar processes.
- The XML upload screen now displays the file name rather than generic path information.
- Added a new datapoint for ESX DataSources for the raw vCenter response. This allows us to distinguish between VMs being inaccessible due to a VM issue versus vCenter not responding. Requires Collector version 22.227 or higher.
Devices
- Added the ability to auto-group instances based on Instance Properties. The option can be selected when configuring a DataSource.
- When a user does not have rights to initiate Remote Session, the Remote Session option will no longer display in the Manage Device dropdown menu. Previously, the option was present, but would fail when clicked.
- The wrap function has been added to all property value fields, avoiding the need to scroll to the Info Tab.
- DataSource graphs previously defaulted to a base of 1000, which is not always desired. Graphs can now be configured to scale by 1024.
- Previously, a Collector description was required to change a device’s Collector via the Manage Device screen. Now, only a Collector ID is required.
- A new tab, Alert Routing, has been added for EventSources. This displays the same information that can be seen from DataSource | Alert Tuning | Datapoint | Test Alert.
- Improved custom property name validation. These names can now only include ASCII letters “a” through “z” (in a case-insensitive manner), the digits “0” through “9”, and the hyphen, period, colon and underscore. This validation ensures that custom property names don’t interfere with glob expressions and reserved characters throughout the application.
- Users must have parent group permissions to delete a sub-group. This ensures that the owner of the parent group maintains complete control of parent group membership.
- We recently introduced the ability to set SNMP v3 credentials during the device discovery process. We’ve extended this to always apply the SNMP version custom property when SNMPv3 credentials apply.
- We added Dynamic Groups to the suggested results for DataSource’s “Applies To” functions.
- Performance improvements when displaying large amounts of Netflow data.
- We combined all custom properties, including Instance Level Properties, into a single table in the Info Tab. Instance Level Properties will be displayed first in the Custom Properties list.
- When viewing a DataSource in a Device Group dashboard, only devices displaying graph data will appear in the device list.
Devices (AWS)
- Added support for the AWS Ohio Region (us-east-2)
Mobile
- Improvements made to mobile graph display when multiple line types (area, graph, or stack) are configured.
- Highlighted alert counts by severity.
Reports
- You can now exclude SDT periods per datapoint when configuring the SLA Report.
- In the tile view, we improved the display for reports with long descriptions.
Services
- Read-only users can test services steps, but they will no longer see the full Request and Response information. This is designed to protect any sensitive information passed or returned.
- The option to treat “no data” (NaN) as available has been removed from the Website Overview Report.
All service checks will now display a status. - Improved performance of transactional service checks when a large response is received.
- The ##URL## token for service alerts previously only took into account the step URL. It now evaluates both the default and step URL.
- Removed the Response Time column from services’ raw data. This data is an aggregate metric that does not add value in the raw data view.
- We added a ##STEP## token for Service Alerts. Including this token in Service Alert Templates will display relevant step information, enabling you to more quickly identify the problematic Service step when an issue occurs.
Settings
- Access IDs for tokens can now be easily copied.
- Added support for Firefox password manager on sign-in.
- If an invalid first/last name is used during account set-up, an account will still be created. A log will be created stating that an invalid name was used.
- Devices with an IP matching any system.ips of existing devices, monitored by the same Collector, will not be added to the unmonitored table.
- You can now set a Critical level in the filter for Windows Event logs.
Other Minor Improvements
- Improved error messaging when sign-in is prohibited because cookies are not enabled.
- Improved the visual indicator when a checkbox is controlled by a parent instance group or device group.
- Small layout clean up throughout the UI.
- A “Please Wait” message is displayed when uploading scripts throughout the application, confirming the action is in process.
- Added a scrollbar to the Unmonitored screen, which is useful if a display name or DNS name is exceptionally long.
- Improved layout of the Services detail page to avoid overlapping text.
Bugs Fixed
Alerts
- If an alert threshold is changed, this can result in an alert clear. At the time of clear, the alert end time and status were logged but the alert did not reflect the updated threshold.
- Cluster alerts were only respecting SDTs at the group they were set at, they now respect parent group SDTs as well.
- Removed a condition where an acknowledge email message including an email delivery failure condition could result in an email loop.
Collectors
- Using ‘Select All’ when viewing Settings | Collectors | Collector Devices did not respect the filtered results. Rather, all devices associated with the Collector were selected.
- AWS resources with a Collector assigned at the group level that also are members of a Dynamic group weren’t associated with the correct preferred Collector.
Dashboards
- If a DataSource includes parentheses in the name, such as interfaces (64 bit), when changed all fields in the widget config were reset. Now only impacted fields are reset, such as instance name.
Devices
- When a column is sorted in the Raw Data tab, the column’s order did not change as expected.
- When viewing DataSource graphs from a device dashboard, the priority order was not always respected.
- From Device Dashboards, selecting “view DataSource definition” did not always display the DataSource details.
Mobile
- Corrected issues with scheduling downtime for a device.
Reports
- The “report type” filter was applied correctly at the group level, but not when the group was expanded.
Services
- Test alert routing for an overall service alert did not return an alert rule.
- When deleting a Collector checkpoint from an internal service check, individual location error were still generated from the deleted Collector.
Settings
- Fixed a bug where tokens were incorrectly formatted when inserted in to URLs for custom HTTP integrations.
- Settings | Collectors displayed an incorrect number of service checks assigned to the Collector.
- If all Netscan policies were deleted, the last Netscan policy remained on the screen after deletion.
- If a Netscan CSV was added with capitalization, it did not work since the file was always stored in lowercase. This is no longer case sensitive.
