Disclaimer: This content applies to the legacy UI and is no longer maintained. It will be removed at a future time. For up-to-date content, see Adding a Service. At the time of removal, you will automatically be redirected to the up-to-date content.
Adding Services
Last updated - 25 July, 2025
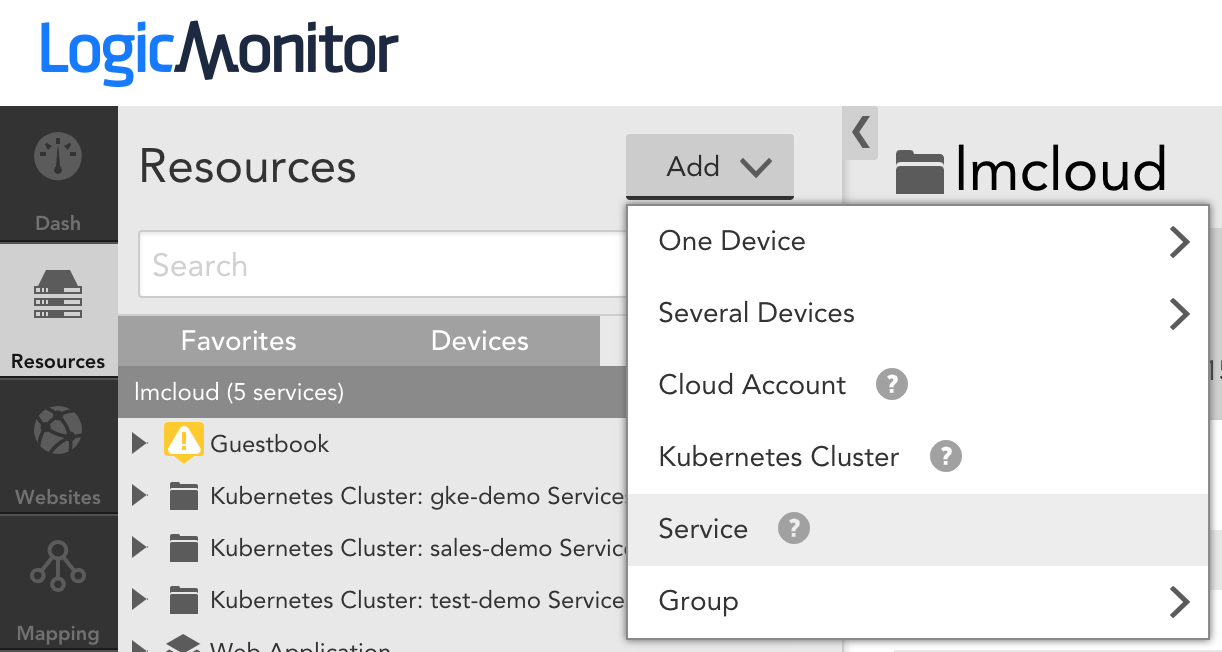
To add a Service, navigate to the Resources page and select Add > Service.
Select Service Members
After giving your Service a name and description that reflect what the Service represents, you’ll need to select the instances across one or more monitored devices that support the Service. There are two ways to do this:
- Add all instances for one or more resources (e.g. devices)
- Add specific instances for one or more resources
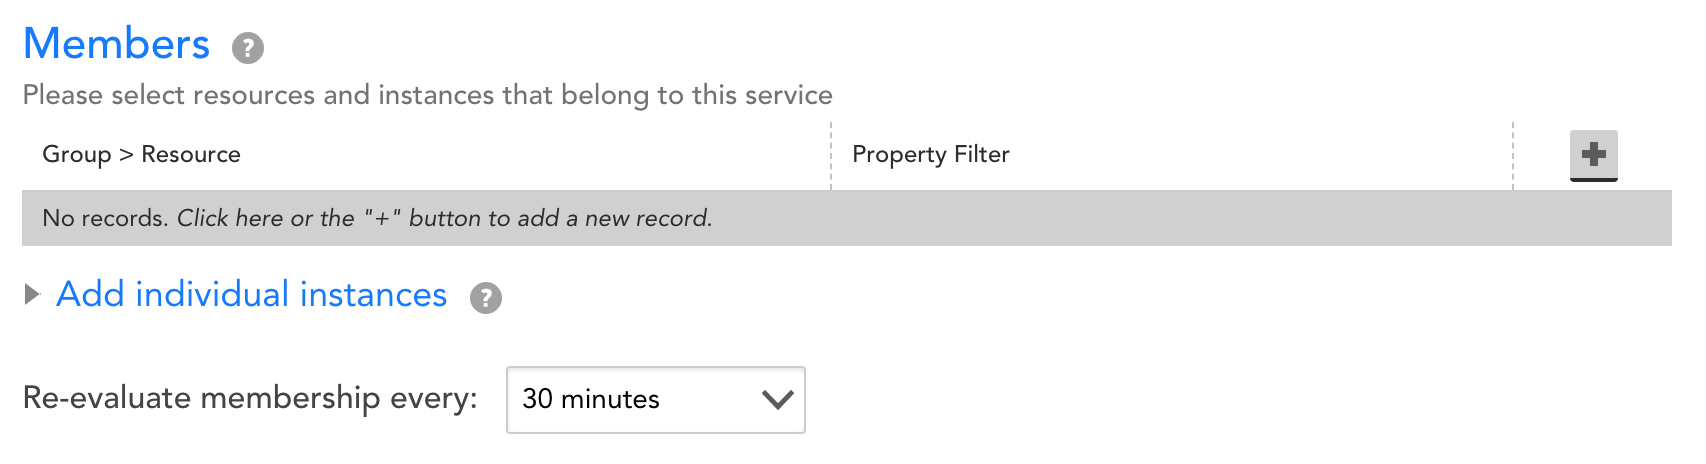
Both options include a resource property filter, which enables you to dynamically match resources (e.g. devices) based property values.
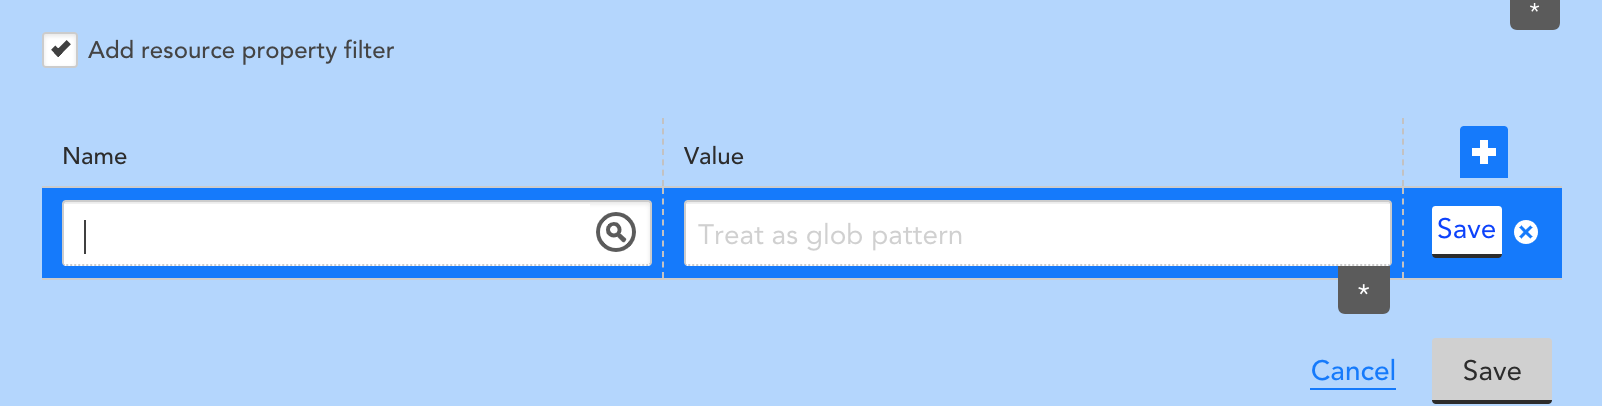
We suggest that you make membership dynamic by either using glob in the group, device, and instance name fields, and/or by adding a resource property filter. For example, you could match all servers with ‘kafka’ in the name by inputting ‘*kafka*’ in the device field. As another example, you could match all EC2 instances in a specific Auto Scaling group by adding a device property filter set to match any devices with the property ‘system.aws.tag.aws:autoscaling:groupName’ set to the Auto Scaling group name.
The ‘Re-evaluate membership every’ option enables you to select how often the membership criteria for your Service should be re-evaluated. This should be a smaller value for a more dynamic Service (e.g. containerized application, cloud auto-scaling group), and can usually be set to a larger value for more static Service.
The Groups table enables you to add this Service to a Service Group in the Resources tree, to enable more organized management. Note that Services cannot be added to Device Groups, and that you can add Service Groups via Add | Group | Service Group on the Resource page.
The Properties table enables you to add properties to this Service. You may want to add properties, for example, if you plan on having the same aggregate DataSource apply to many Services. For example, you might have several clustered instances of the same application running in different locations, and want to set up a Service for each. In this case, you can go through the Add Service Wizard completely the first time through, and leverage a property to apply the automatically created DataSource to future Services, without having to go through the entire wizard again (only step 1).
Once you select ‘Save & Next’ on this step, your Service will be created. The remaining steps will automate the creation of a DataSource for your Service. If you already have an aggregate DataSource that will be applied (e.g. based on property), you can skip steps 2-4.
Select Service-level data
Once you’ve selected the instances that support your Service, you can choose which datapoints should be aggregated up to the service level, in the “Select Service Metrics” settings. Select the metrics that give you the most information about whether or not your service or application is healthy and performing well.
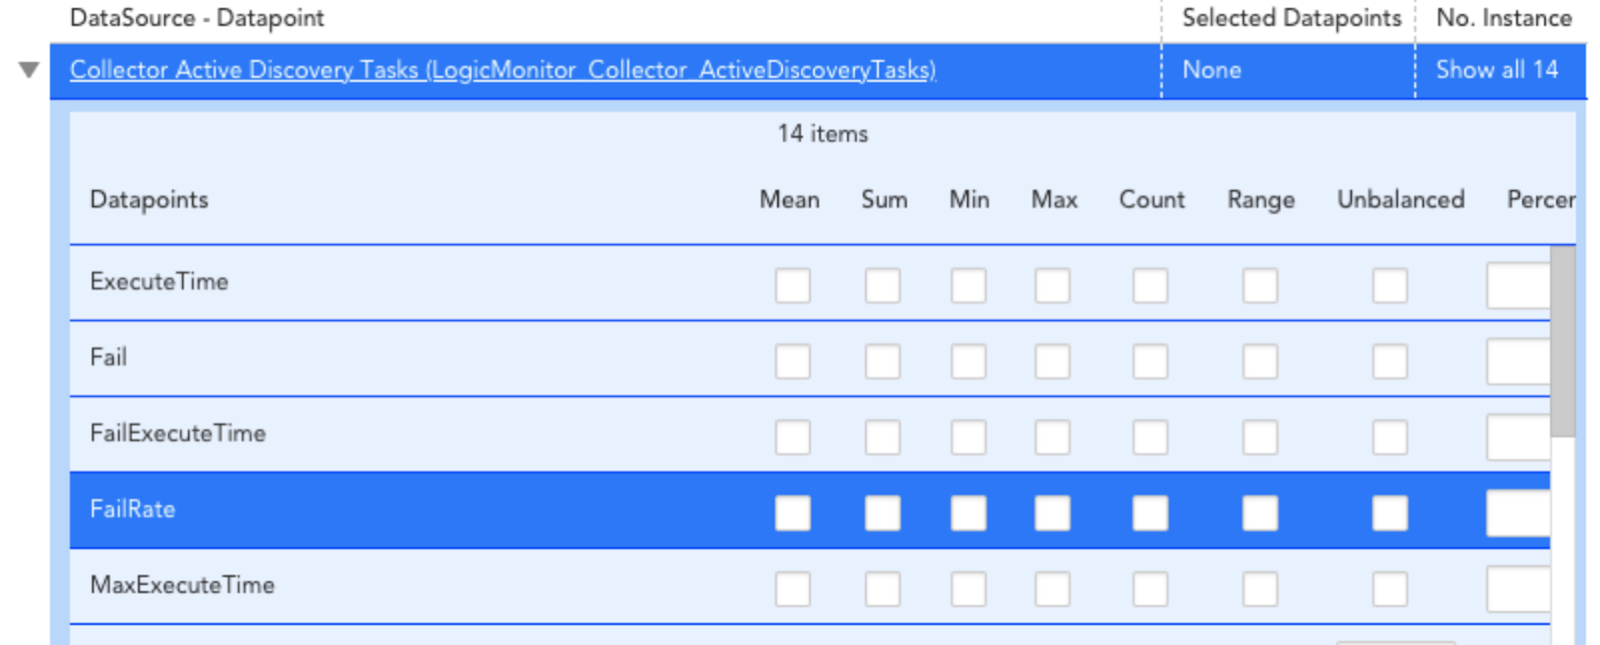
Aggregate Statistics
Standard statistics are available for aggregation:
- Count is the count of instances for that datapoint and DataSource combination
- Range is the difference between Max and Min, and Mean is the average.
- Percentile returns the specified percentile value of all available values for the datapoint for each timestamp.
- To see the instances you’ll be aggregating across in each case, you can select the ‘Show all X’ link in the third column of the rows.
- You can also monitor for Unbalanced services. See below.
Unbalanced Service Detection
In load balancing, some nodes receive small tasks while other nodes receive larger and more complex tasks. For such scenarios, unbalanced metrics can provide insights into these issues.
An Unbalanced service refers to a group of instances that is not utilized evenly for some metrics. Select the Unbalanced checkbox for any datapoint to add unbalanced service detection. You can also set alerts and thresholds for the datapoints.
Complex Datapoints
You can perform calculations on the aggregate, service-level, data using Complex Datapoints:
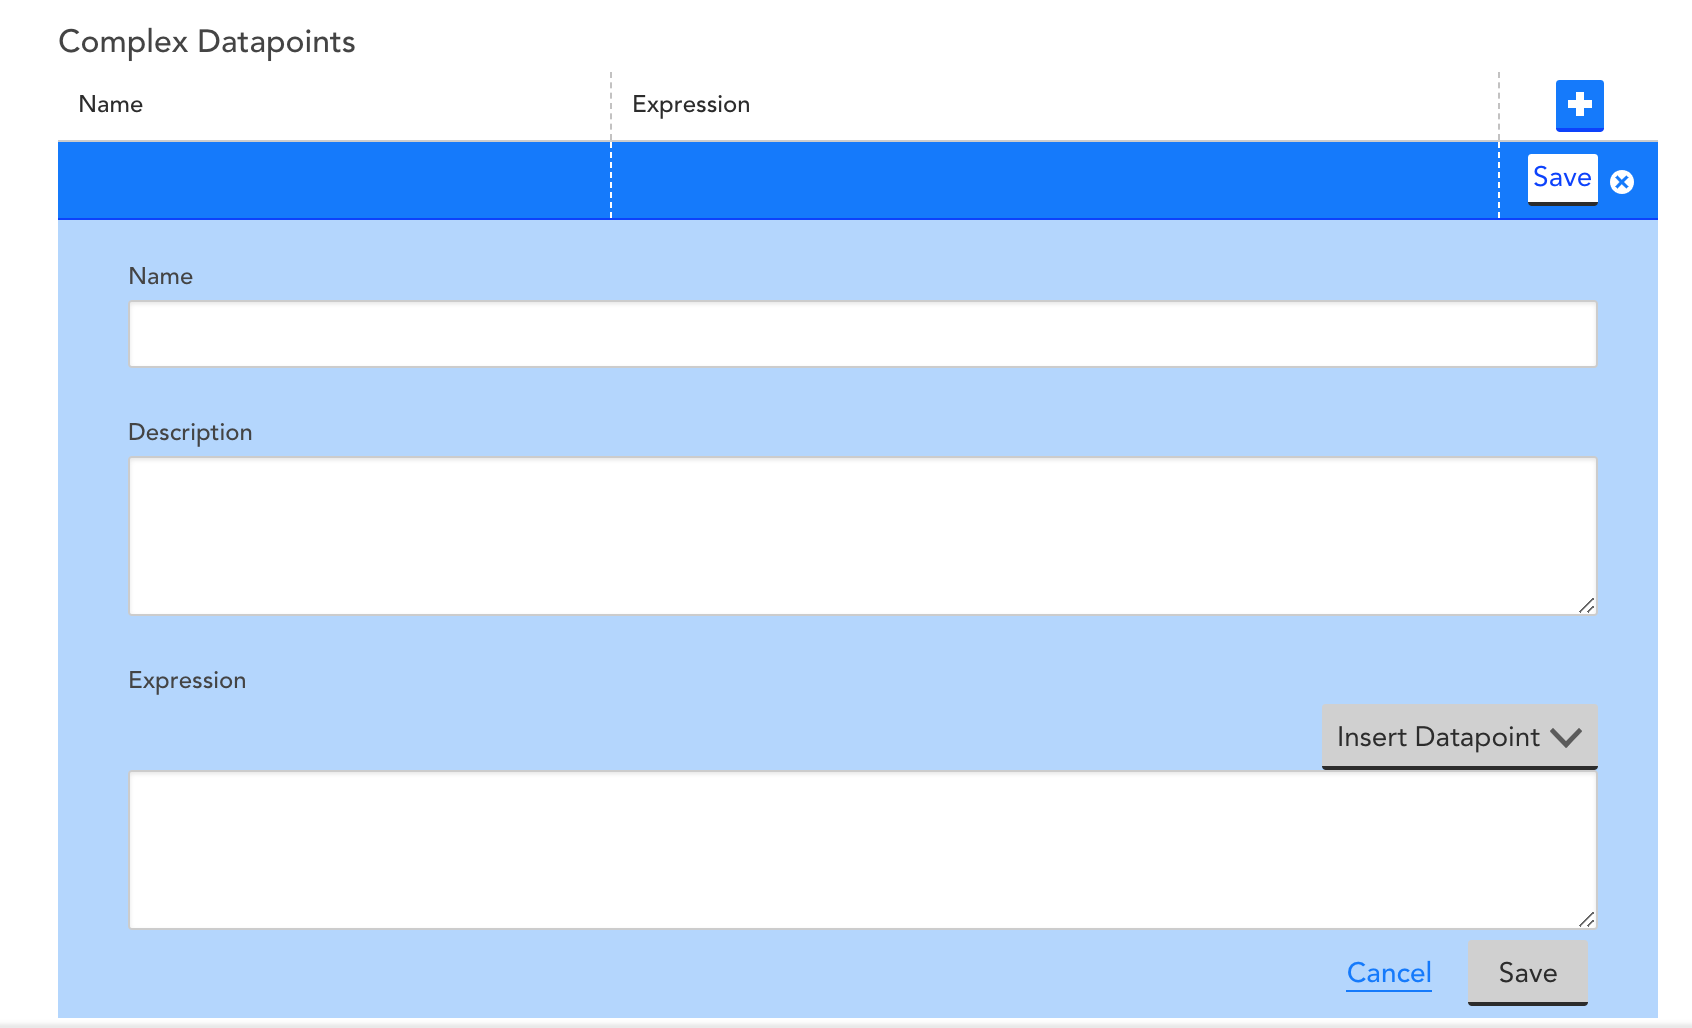
Use the Insert Datapoint to reference aggregate data, and the expression syntax highlighted in Complex Datapoints to perform the desired calculations. For example, you may want to monitor a ratio of healthy resources in a cluster by dividing the sum of a status datapoint by a count of included instances.
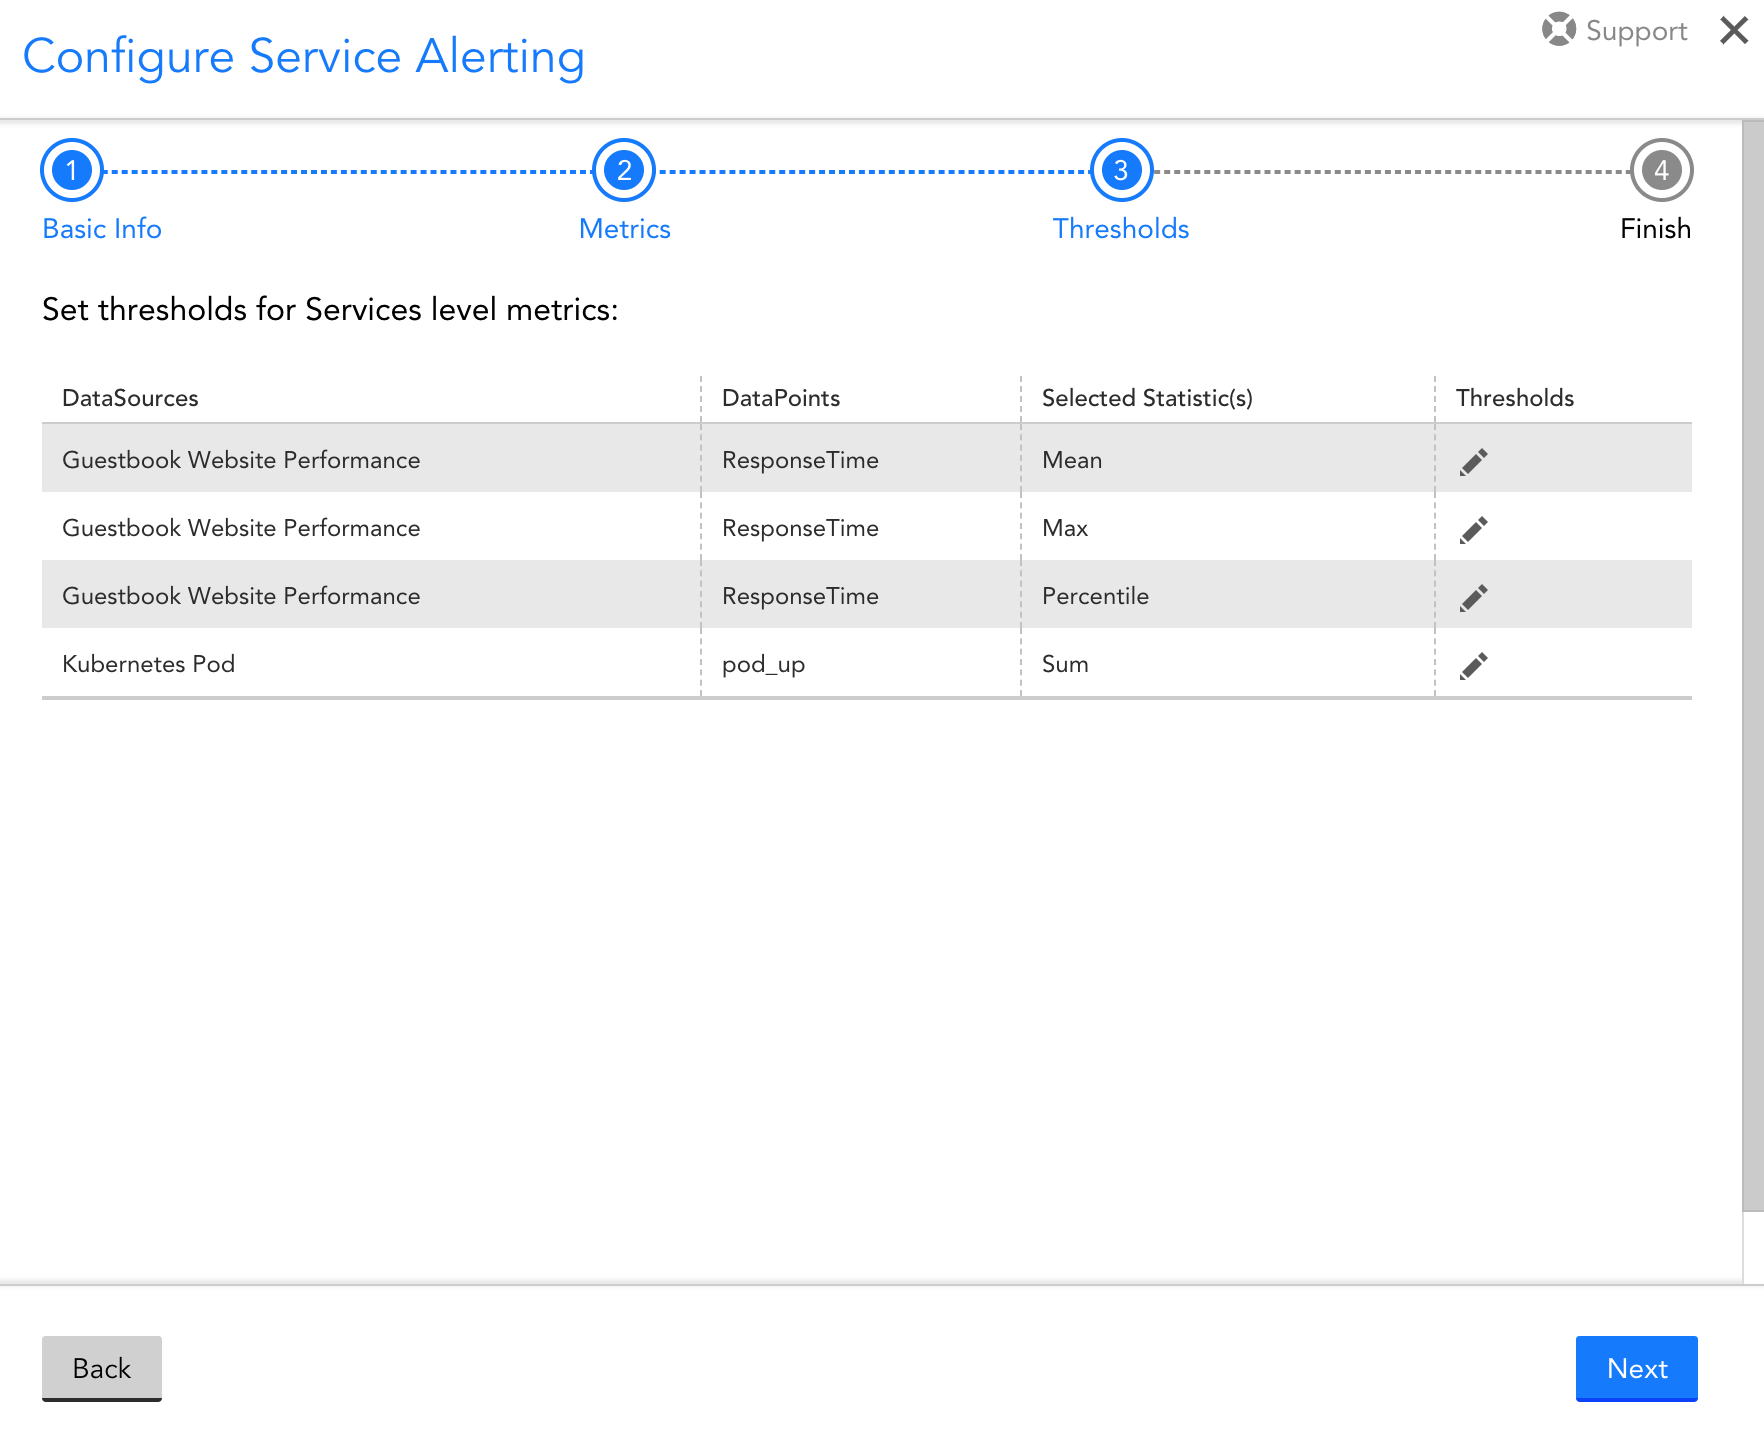
Set Service-level thresholds
Step 3 of the wizard will enable you to set thresholds for the datapoints you selected for aggregation in Step 2. Note that you will still receive alerts, as usual, for any instances included in the Service. The thresholds you enter during this step will be used to trigger alerts for the Service you are creating. Although these alerts are separate from the individual instance alerts, you may choose to consider them together while adjusting your alert rules. For example, you might want Service alerts to go to your DevOps team(s) that own those Service, and individual instance alerts to be sent to an endpoint that doesn’t warrant immediate response, such as a Slack channel. Alternatively, you may just set Service thresholds conservatively and add them to your existing Alert Rules.
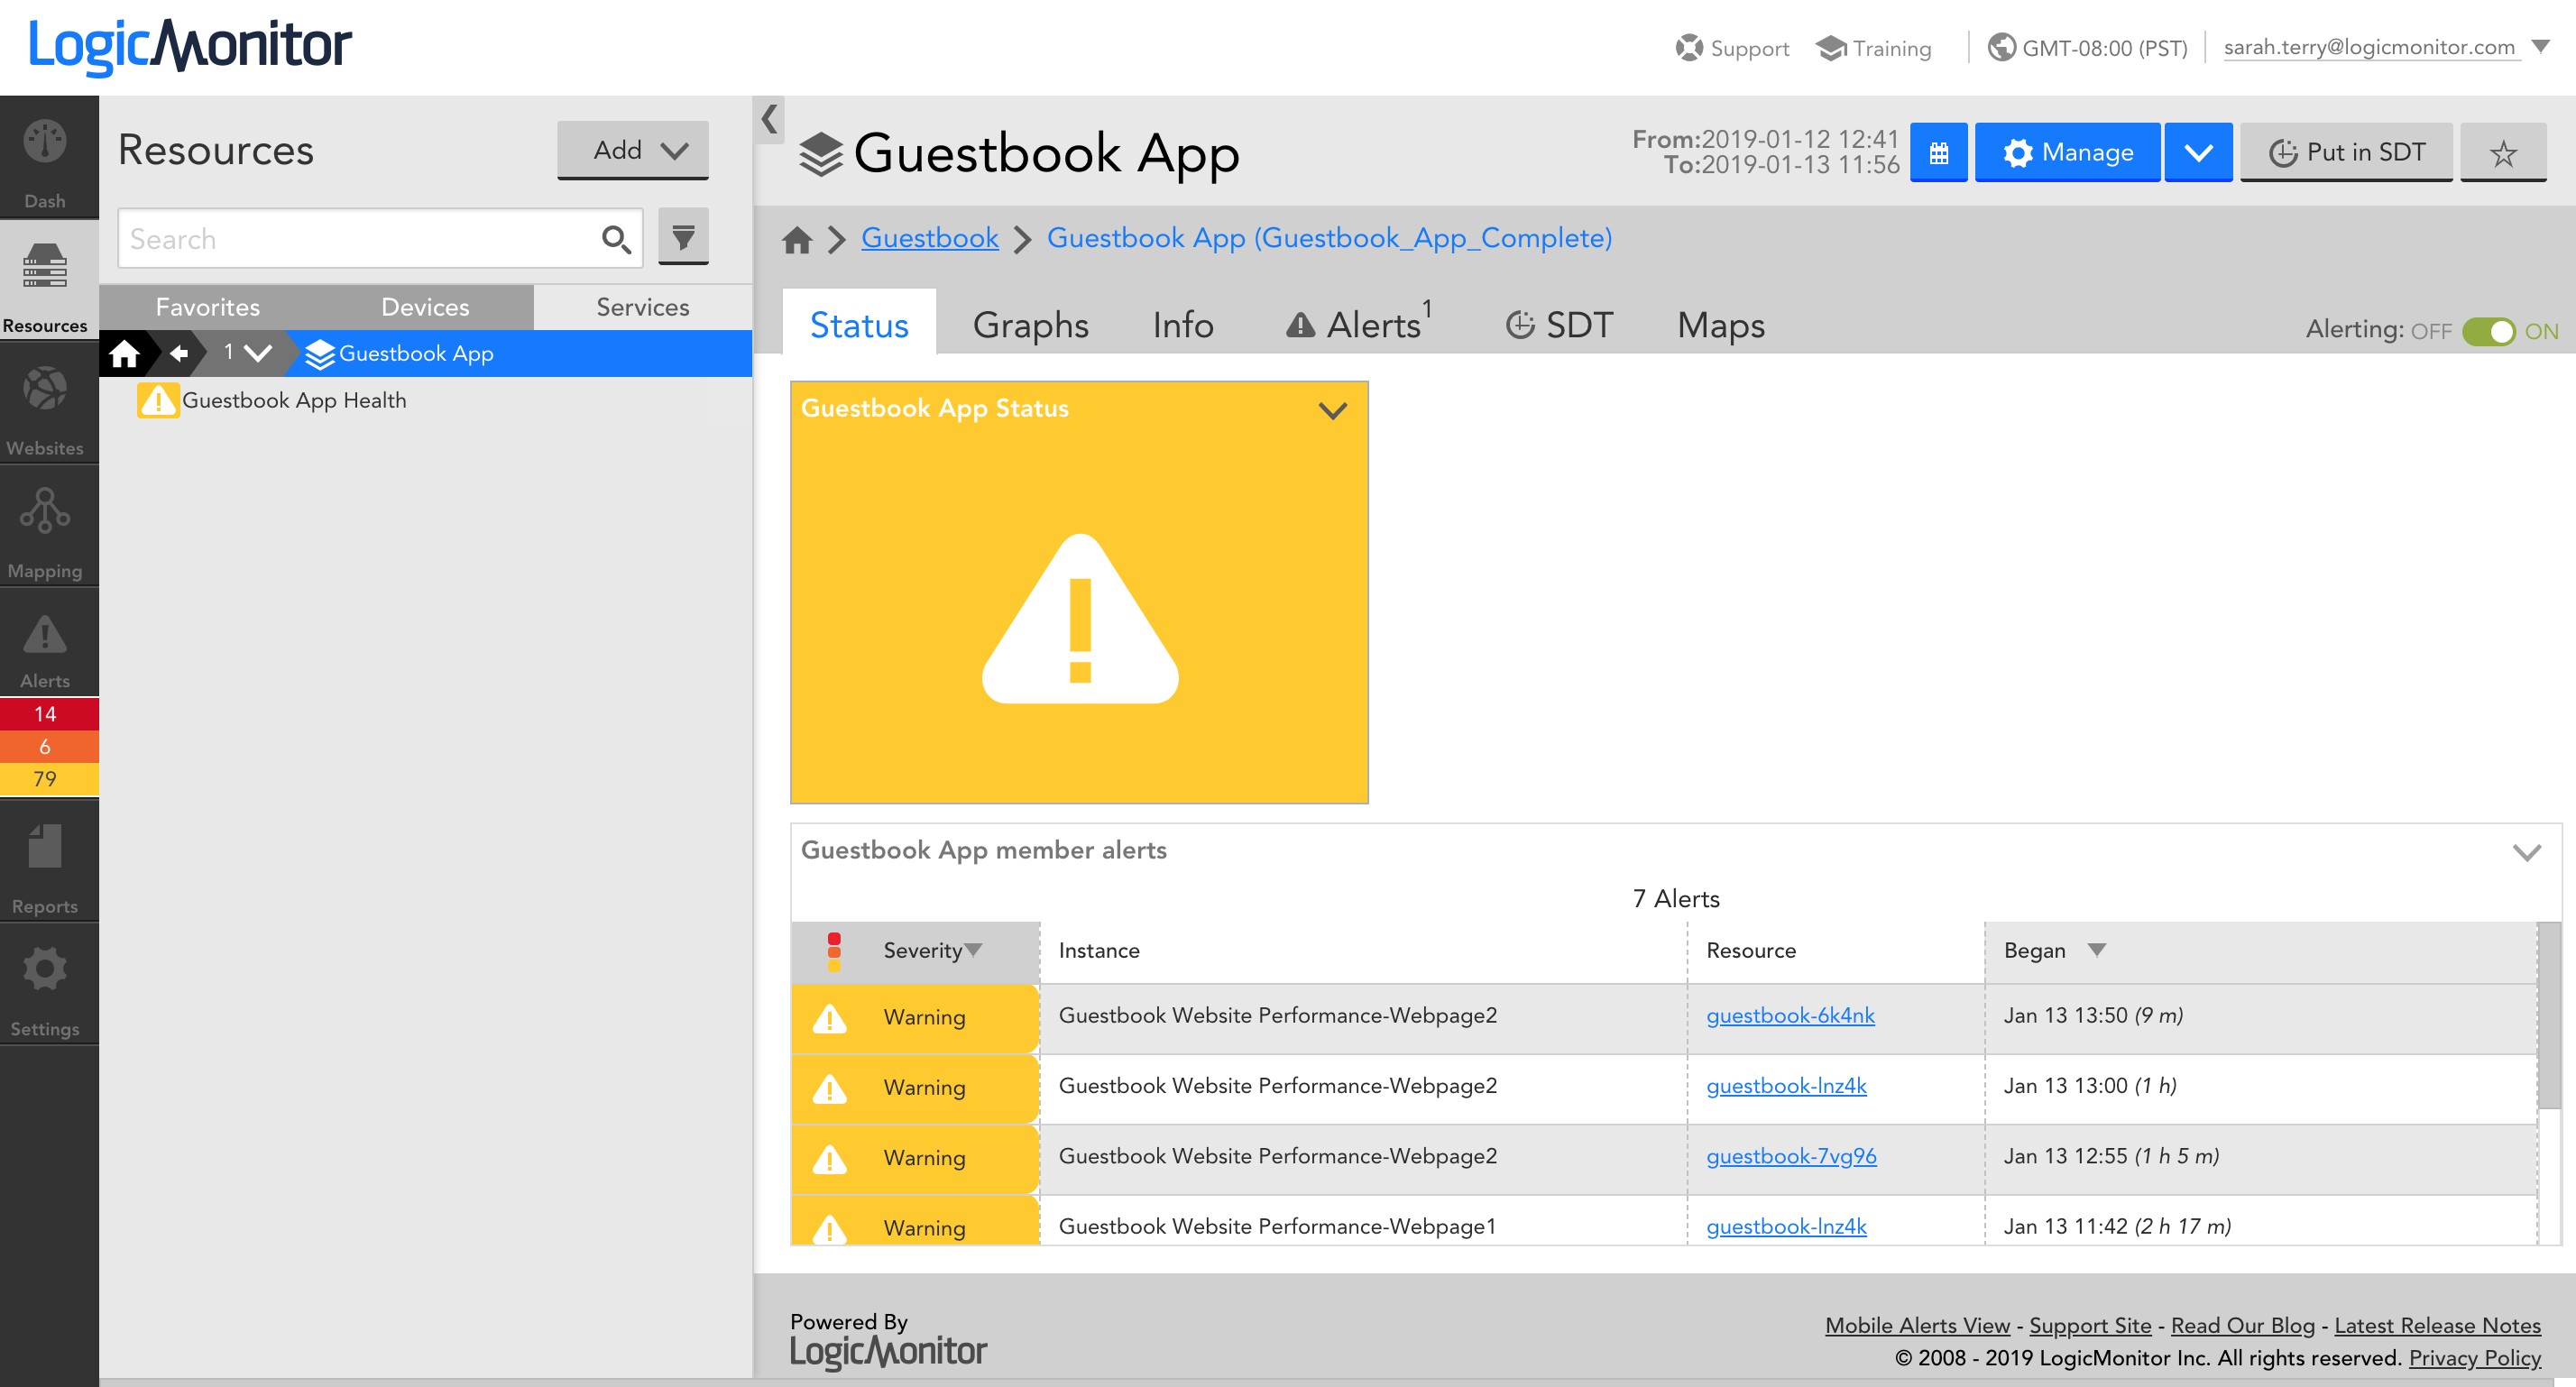
Review
In Step 4, you’ll be asked to review and save your Service. Once you save, you’ll automatically see your service display in the Resource tree with a DataSource that displays aggregate data for your Service. This DataSource was automatically created based on your selections during the wizard. The Status tab displays the status of your Service based on the alert thresholds you configured:
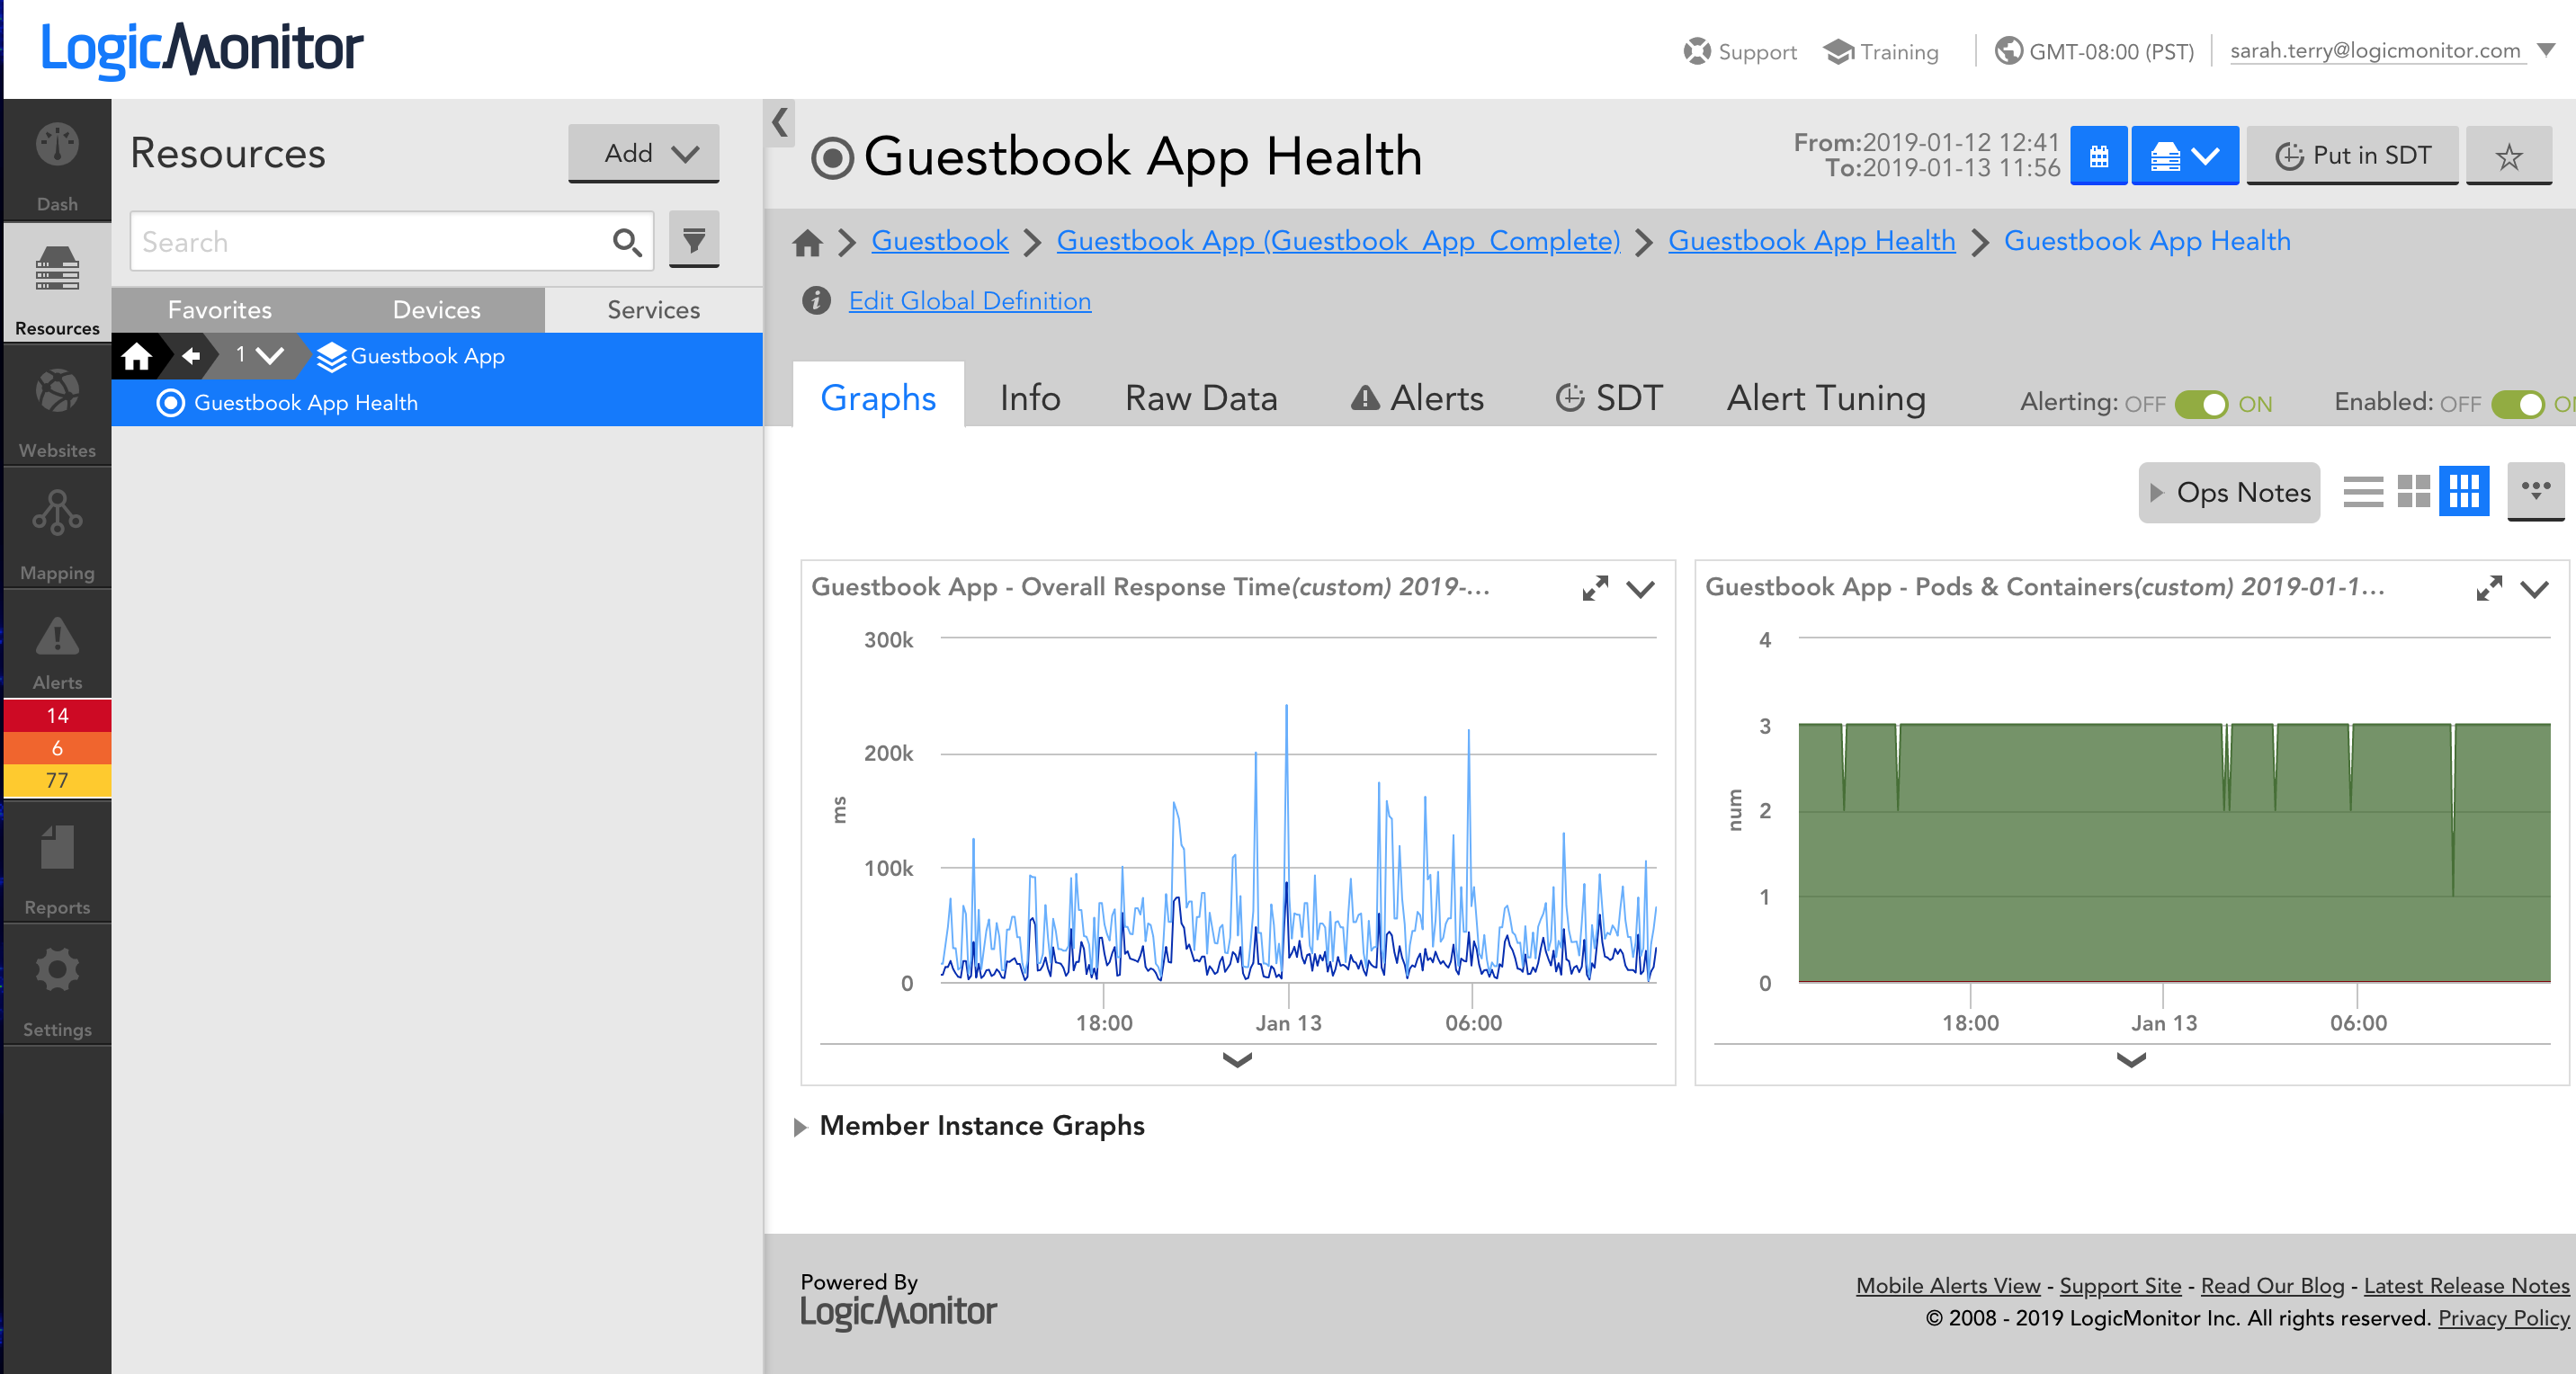
On the Graphs tab, DataSource graphs are automatically created for you. You can drill down from the aggregate data to individual instance data for any given graph using the ‘Member Instance Graphs’ list on the Graphs tab when the DataSource is selected:
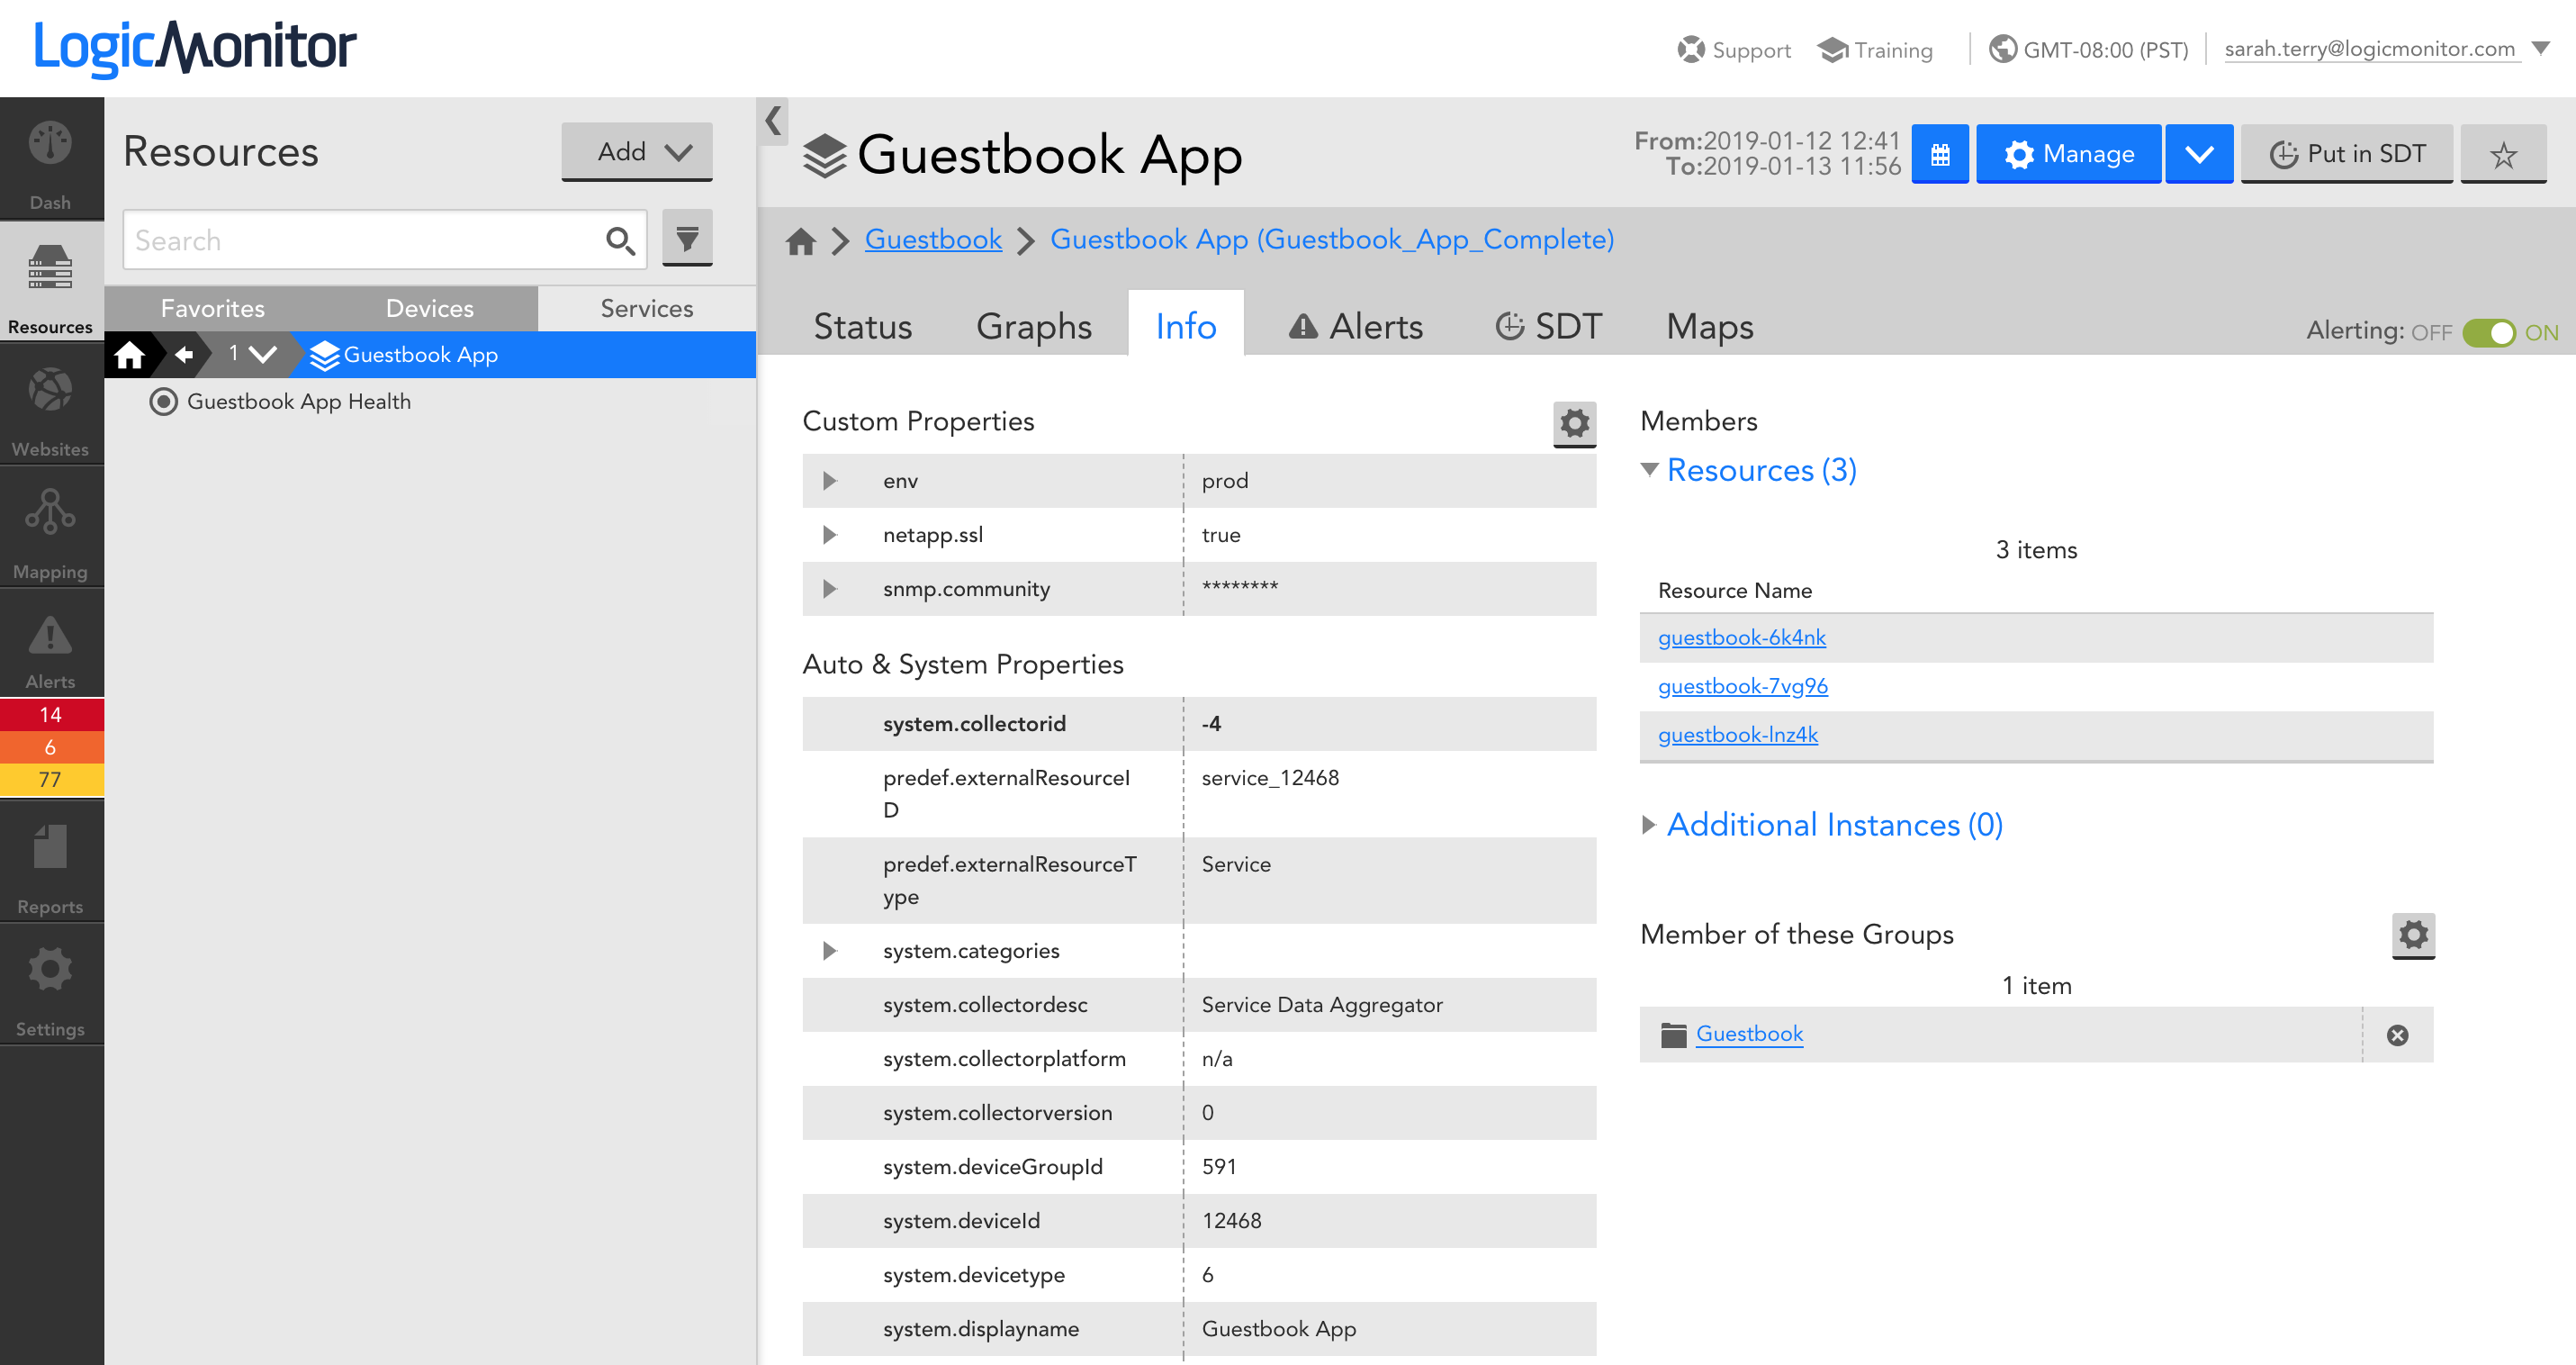
The Info tab displays the resources (e.g. devices) and individual instances that belong to the Service. Note that clicking on these resources and instances will take you directly to the resource or instance within the Devices tab of the Resource Tree:
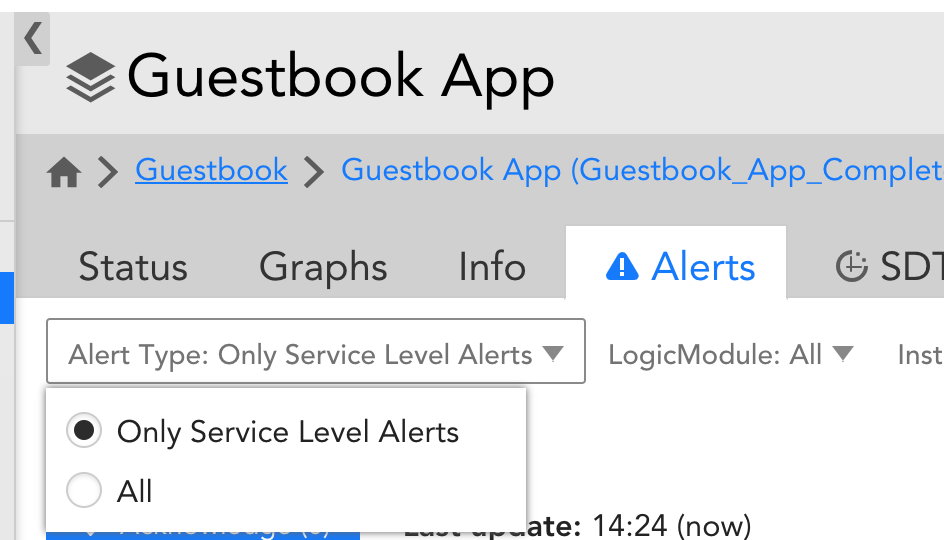
The Alerts tab displays Service alerts, but also enables you to include alerts for individual instances and resources. You may find starting at the Service level and drilling down into the individual resource and instance alerts useful for troubleshooting:
On the SDT tab, adding an SDT for the Service will also SDT each member of the service (resources and individual instances).
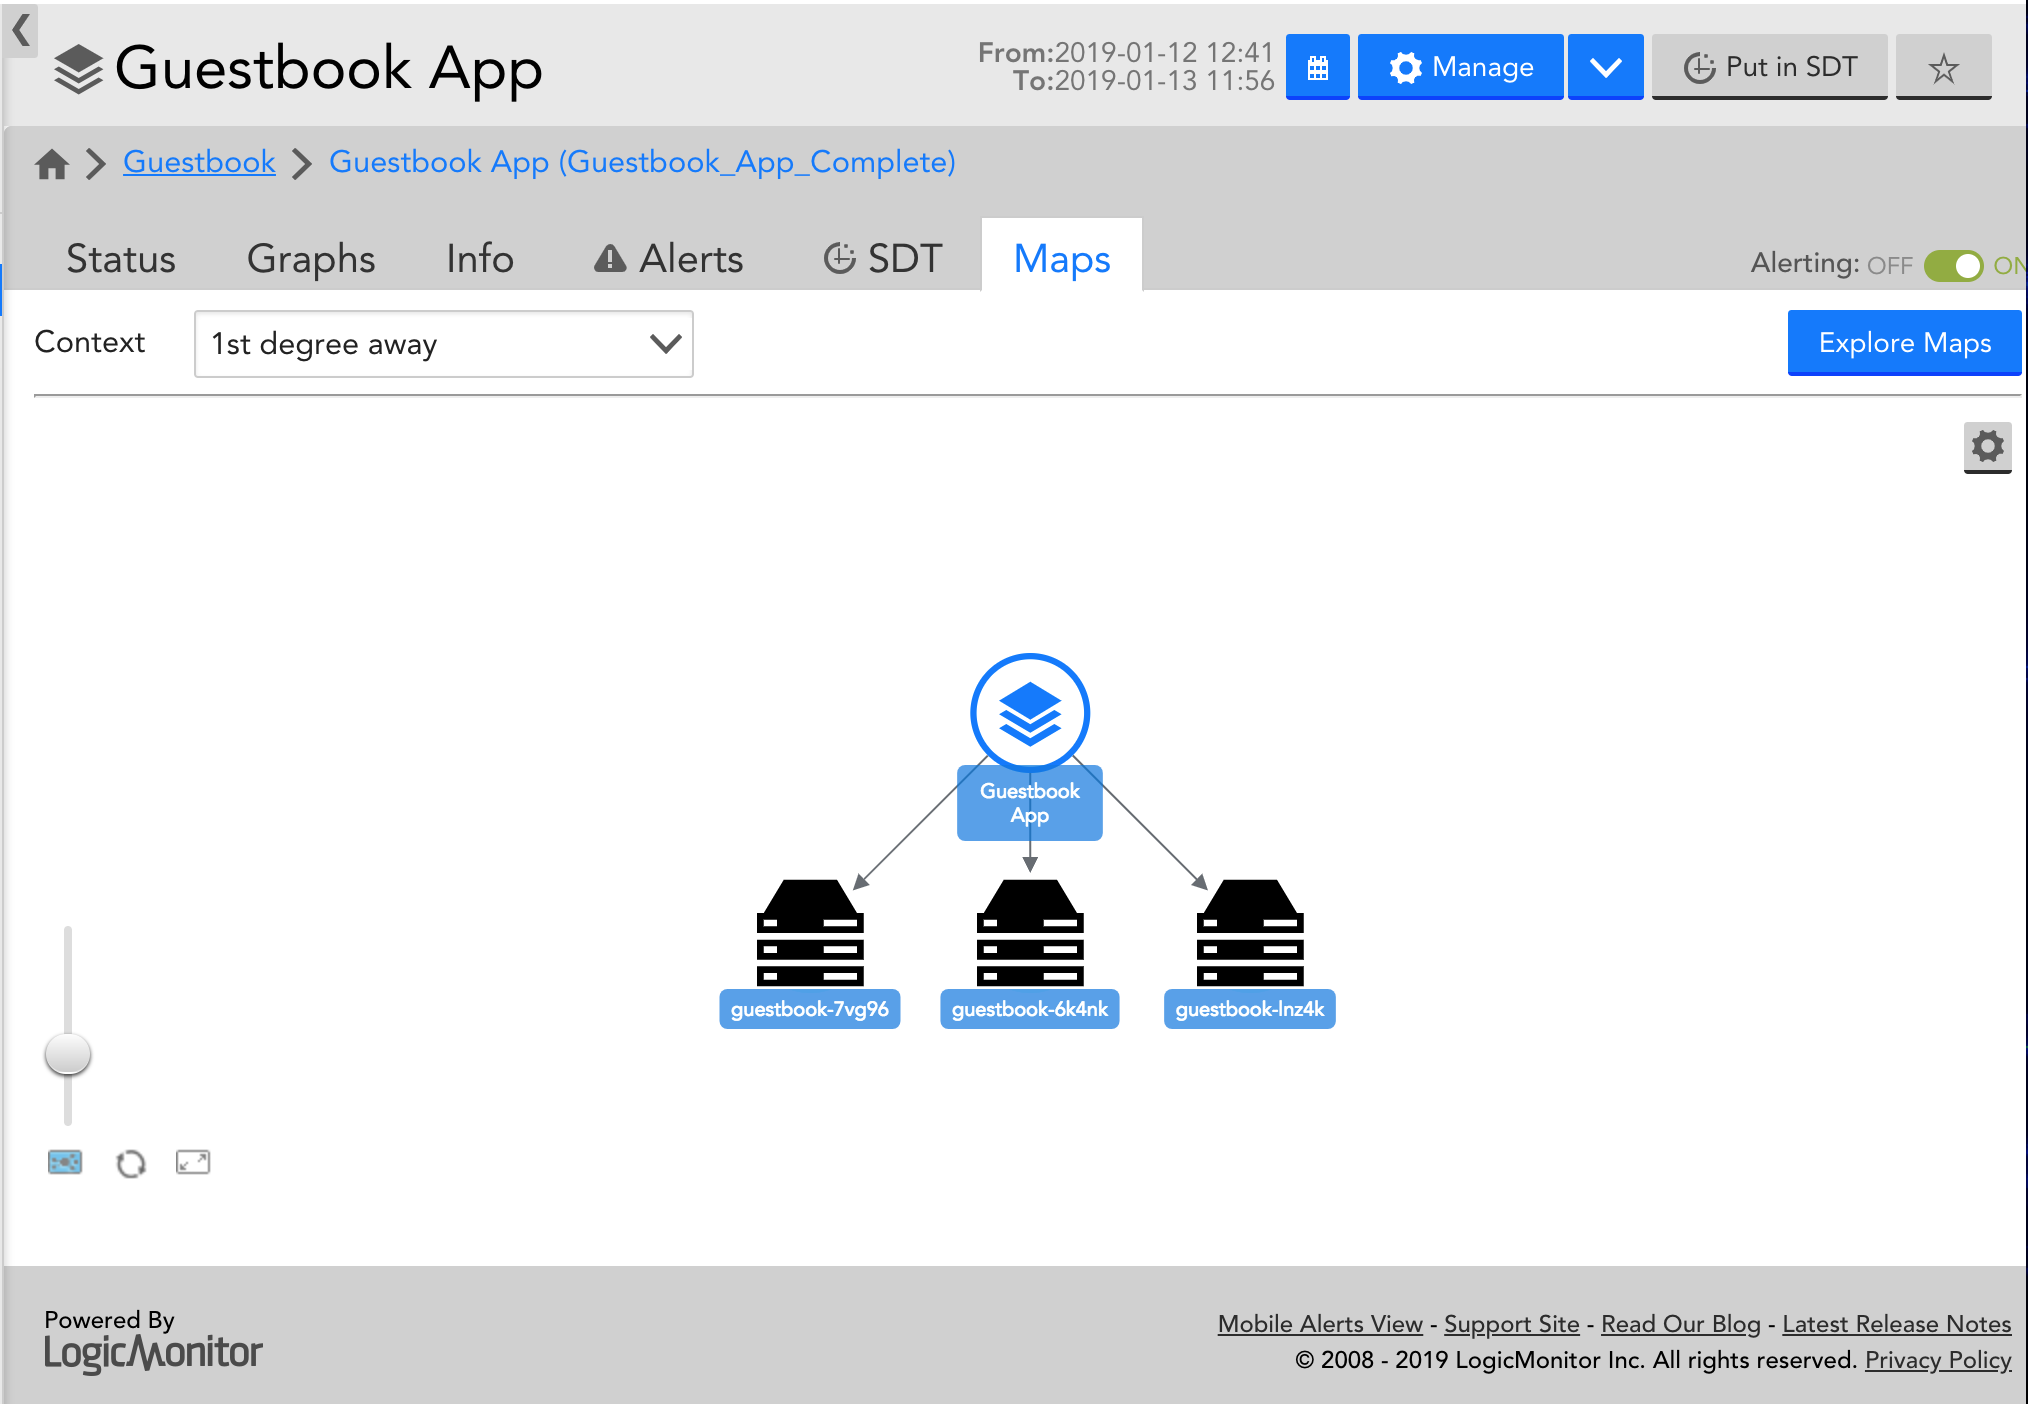
On the Maps tab, a dynamic topology map will display for your Service, and show each resource and individual instance member: