
Disclaimer: This content applies to the legacy UI and is no longer maintained. It will be removed at a future time. For up-to-date content, see DataSources Configuration. At the time of removal, you will automatically be redirected to the up-to-date content.
Creating a DataSource
Last updated - 22 September, 2025
DataSources are templates that define what numerical data should be collected, how it should be collected, and what values should be graphed and trigger alerts.
There are four sections included in every DataSource definition:
DataSource definitions can be edited or created from either the Settings page (Settings | LogicModules | DataSources) or the Exchange page (Exchange | Installed Modules). In this support article, we feature the interface found under the Settings menu, but regardless of interface used, the configurations available remain the same.
General Information
The General Information section includes identifying information about the DataSource. This includes the collection method that will be used to collect data, how often data will be collected, and from which devices data will be collected.
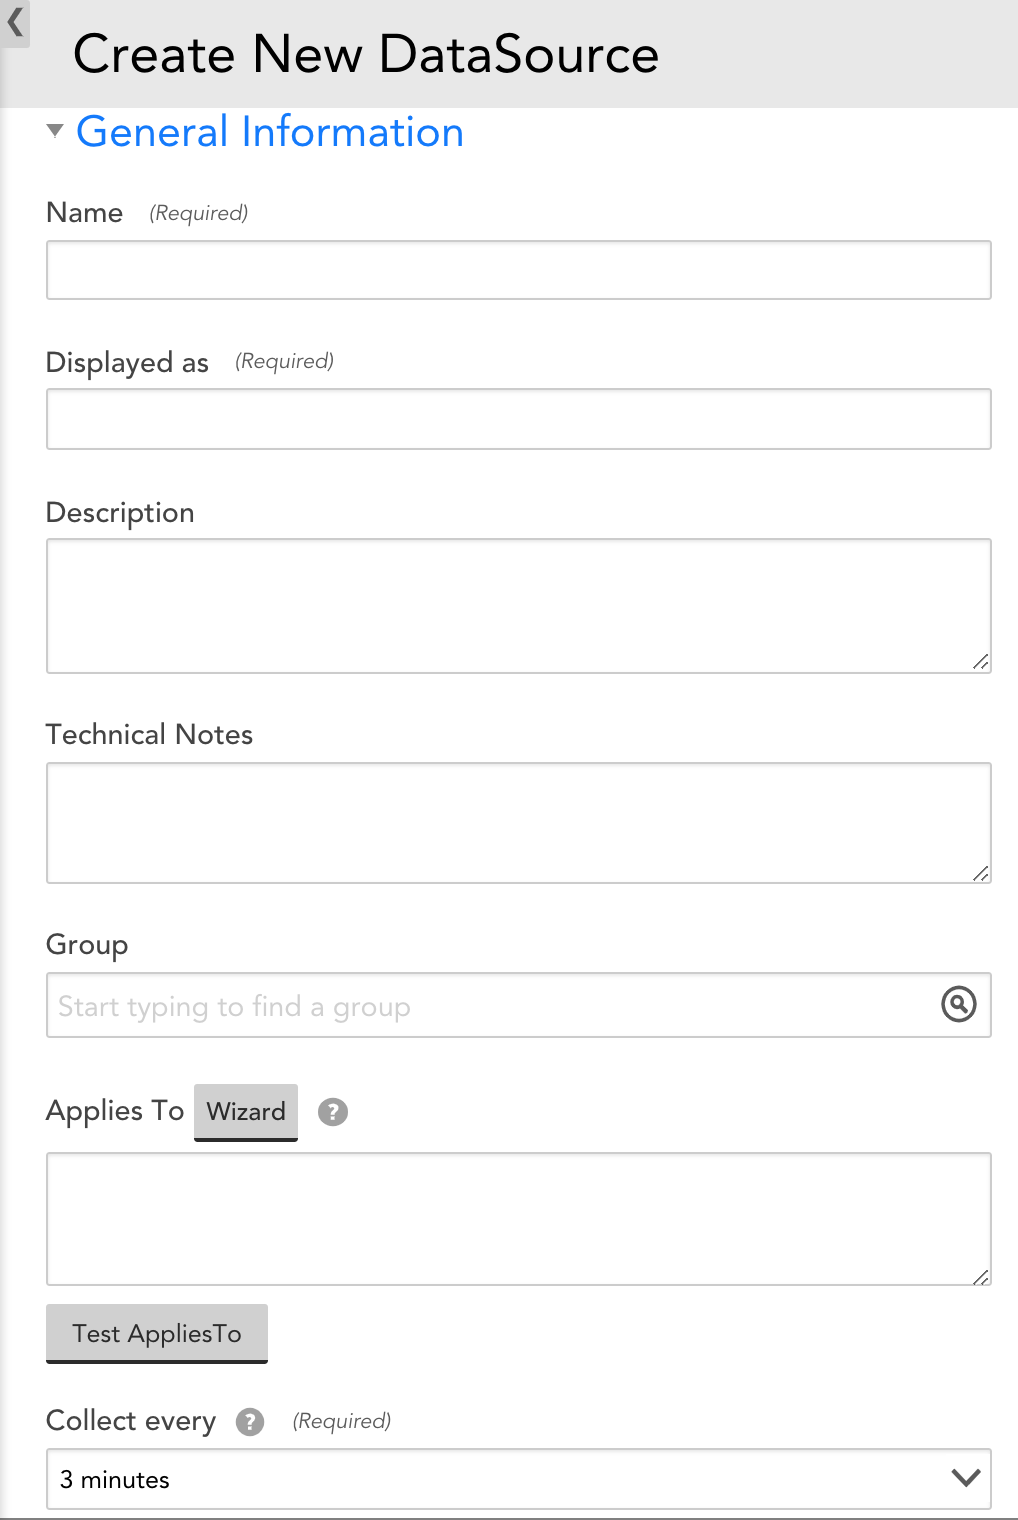
Name
The unique name of the DataSource. As a best practice, this name should be descriptive: specify the platform or application name first, then specify a specific component of the platform.
For instance: “Tomcat Threads-“, or “Aruba Controller Power Supply-“.
Displayed as
The name the DataSource will be displayed with on the Devices page. This name does not need to be unique (there can be several DataSource that display as “CPU”, as they apply to different kinds of devices). As a best practice, the display name should be shorter than the full DataSource name. For example, “Services” instead of “Windows Services”, or “VIPs” instead of “Citrix Netscaler VIPs.”
Note: The DataSource name and display name cannot include the operators and comparison functions available in LogicMonitor’s datapoint expression syntax, as discussed in Complex Datapoints.
Description
The description that will be associated with this DataSource. As a best practice, if the DataSource name is not unambiguous as to what the DataSource is collecting, the description field should provide enough information that someone seeing the name and the description will be clear what the DataSource does.
Technical Notes
This field can contain any technical notes associated with the DataSource.
Group
The DataSource Group to which the DataSource will be added. If this field is left empty, the DataSource will not be added to a DataSource group. If you enter text that does not match an existing DataSource Group, one will be created.
For example, all the Dell hardware monitoring DataSources are assigned the group Dell. This collapses those DataSources to a single DataSource group entry that can be expanded.
Applies To
The Applies To field accepts LogicMonitor’s AppliesTo scripting as input to determine which resources will be associated with this DataSource. For detailed information on using this field (including its wizard and test functionality), along with an overview of the AppliesTo scripting syntax, see AppliesTo Scripting Overview.
Collection Interval
The Collect every field defines how frequently data is collected. This field should be set to a collection interval (that is polling cycle) that is appropriate for the type of data being collected. Metrics that change frequently (for example CPU) or require immediate attention in the event of an error (for example ping loss) should have a shorter polling cycle, such as one minute. Metrics that can tolerate a longer delay in alerting or change less frequently (for example drive loss in a RAID system, disk utilization) should have a longer polling cycle, such as five minutes.
Note: Longer polling cycles impose less load on the resource being monitored, the Collector, and the LogicMonitor platform.
Changing the Collection Interval
Once a DataSource has been applied to one or more resources and monitored instances are created for those resources, the underlying data storage is created with some dependency on the collection interval. In order to minimize data loss, this underlying data storage isn’t updated when you change the collection interval for the DataSource.
This impacts how data is stored and displayed. For example, if the collection interval is decreased (for example reduced from 15 minutes to one minute), the data is collected and evaluated for alerts on the new schedule, but only stored (and hence graphed) according to the old schedule. In other words, 15 data values will be collected (one per minute according to the new collection interval), but instead of each being stored individually, the average of these 15 values will be what gets stored every 15 minutes (per the old collection interval).
Note: You can view the collection interval with which the underlying datastore was created by downloading a DataSource graph’s raw data. The downloaded data will show timestamps for each new entry of collected data. For more information on downloading data from a DataSource graph, see Graphs Tab.
Overriding Collection Intervals at the Resource or Resource Group Level
You can override the collection interval for a DataSource on a particular resource or for all resources in a resource group by assigning a numeric polling interval (in minutes) to the following custom property at the resource or resource group level:
[DataSourceName].pollinginterval
Ensure that you are using the DataSource name and not display name; both are present in the DataSource definition.
Note: This custom property cannot be used within complex datapoint expressions.
For more information on assigning properties to resources, see Resource and Instance Properties.
Collector
The Collector field defines the mechanism that will be used to collect data.
Multi-Instance?
If this option is checked, the DataSource will be multi-instance. You should make your DataSource multi-instance if you know that there are multiple occurrences of the object you would like to monitor (for example multiple disks or volumes on a server).
Use Wildvalue as Unique Identifier
In case of multi-instance datasource, you can specify that you want to use the wildvalue of the instance as the unique identifier by selecting Use Wildvalue as Unique Identifier. The option is displayed only if you select SCRIPT or BATCH SCRIPT mechanism in the Collector field, SCRIPT in the Discovery Method field, and select Multi-instance?.
- If you select Use Wildvalue as Unique Identifier, the instance value (wildvalue) is used as the unique identifier and you can rename the instance without losing the instance history (instance data collected so far).
- If you do not select Use Wildvalue as Unique Identifier, the instance name (wildalias) is used as the unique identifier. When you rename the instance (even if you do not change the instance value) LogicMonitor will consider it as a new instance. In this case, the history of the instance (before renaming) is not saved.
For example, the wildalias of an instance is test1 and its wildvalue is 1234. If you select Use Wildvalue as Unique Identifier and then rename the wildalias as test2, LogicMonitor will not treat test2 as a new instance and it will continue to maintain its instance history. Here, the instance history of test1 is not lost. If you do not select this option, LogicMonitor will consider test2 as a new instance and the instance history of test1 will be lost.
- You can enable this option for the existing datasources.
- Once you select this option, you cannot revert to wildalias as the unique identifier. The option remains disabled.
You can select this option when building a DataSource. In case there is a UUID or a unique, persistent identifier, you can select this option to monitor name changes and duplicate names.
In case of scripted SNMP monitoring, SNMP indexes can reorder themselves. For example, ‘Ethernet 0’ has an index of ‘1’ at initial discovery. After reboot, it may have an index of ‘3’. In this case, you want the name (wildalias) to be the unique identifier and hence you do not select this option.
Warning: Enabling Use Wildvalue as Unique Identifier on a core module will impact your ability to import updates to that module.
Active Discovery
If the DataSource is multi-instance (that is the Multi-instance option is selected in the General Information section), then you can use LogicMonitor’s Active Discovery process to find (and place into monitoring) all of the similar components of a particular type on a given system. The output of an Active Discovery process is one or more instances for which LogicMonitor can collect a particular type of data. For detailed information on Active Discovery, including configuration, see Active Discovery.
Collector Attributes
Certain data collection methods require you to configure specific attributes in this section. As a best practice, the Name field in the SNMP, JMX, and so on. Collector Attributes section should reflect the name used by the entity that defined the object to be collected (that is, use the OID object name for SNMP data, the WMI property name for WMI data and so on). For more information, see Data Collection Methods, which features specific instructions for each of the data collection protocols supported.
Datapoints
Each DataSource must have one or more datapoints that define what information to collect and store. Once datapoints are identified, they can be used to trigger alerts when data from a device exceeds the threshold(s) you’ve specified, or when there is an absence of expected data. For more information on configuring a DataSource’s datapoints, see Datapoint Overview.
