
DiagnosticSources Configuration
Last updated - 29 May, 2026
You can create multiple DiagnosticSource modules for a resource. You can create a DiagnosticSource that collects data to analyze root cause such as high CPU usage, memory leakage, network connectivity issues, and so on. Based on your business needs and system environment, you can create embedded Groovy or PowerShell diagnostic scripts to collect specific data and identify the issue.
Configuring a DiagnosticSource consists of associating resources and resource groups to which the DiagnosticSource is applied. It also involves specifying a Groovy or PowerShell diagnostics script to diagnose the issue and gather relevant data. Before saving the DiagnosticSource, you can test the diagnostics script on a few resources to verify if the script fetches the desired result. In case of an error, you can revise the script. This important measure ensures that your DiagnosticSource performs as designed when executed to diagnose actual issues.
You can also import the following LogicMonitor-supported out-of-the-box Windows and Linux DiagnosticSource packages:
- Linux SSH Trace Route—Provides information about the route packets take to reach a network host on a Linux system.
- Linux SSH Top CPU and Memory—Provides information about executing processes on a Linux system.
- Linux SSH IP Link—Provides information about network interfaces on a Linux system.
- Microsoft SQLServer Queries—Returns the top longest-running cached queries by total execution time.
- Microsoft SQLServer Blocked Processes—Returns blocking sessions in a Microsoft SQL Server instance.
- Microsoft Powershell – Network Interfaces—Provides information about network interfaces and their configuration on a Windows system.
- Microsoft Powershell – Top CPU and Memory—Provides information about executing processes with highest CPU and memory usage on a Windows system.
- Microsoft Powershell – Top Event Logs—Displays the ten most recent critical and error events from the Windows Security, System, and Application Event logs for comprehensive system monitoring.
- Microsoft Powershell – User Privilege Change—Monitors and reports all user privilege escalations and security-related changes from the Windows Security Event logs over the last seven days for audit and compliance purposes.
For more information, see Importing a Module.
Requirements for Configuring DiagnosticSource
To configure DiagnosticSource modules, you need the following:
- A LogicMonitor user with resource permissions for “Diagnostic Source” settings for the resource group. For more information, see Resources Role Permissions.
- Local Collectors must monitor the resources including cloud resources that you want to apply the DiagnosticSource to.
For more information, see Enable Monitoring via Local Collector. - LogicMonitor Collector installed on your machine must have EA Collector 38.400 or later version. For more information, see Adding Collector.
- To test the diagnostics script, enable the Enable Test Script switch on the Security settings page. For more information, see Security Settings.
Configuring a DiagnosticSource
- In LogicMonitor, navigate to Modules.
The My Module Toolbox page displays. - Select
 Add.
Add.
The Add modal displays.
Alternatively, to add a DiagnosticSource, you can import a DiagnosticSource or clone an existing DiagnosticSource. For more information, see Modules Management. - Select DiagnosticSource.
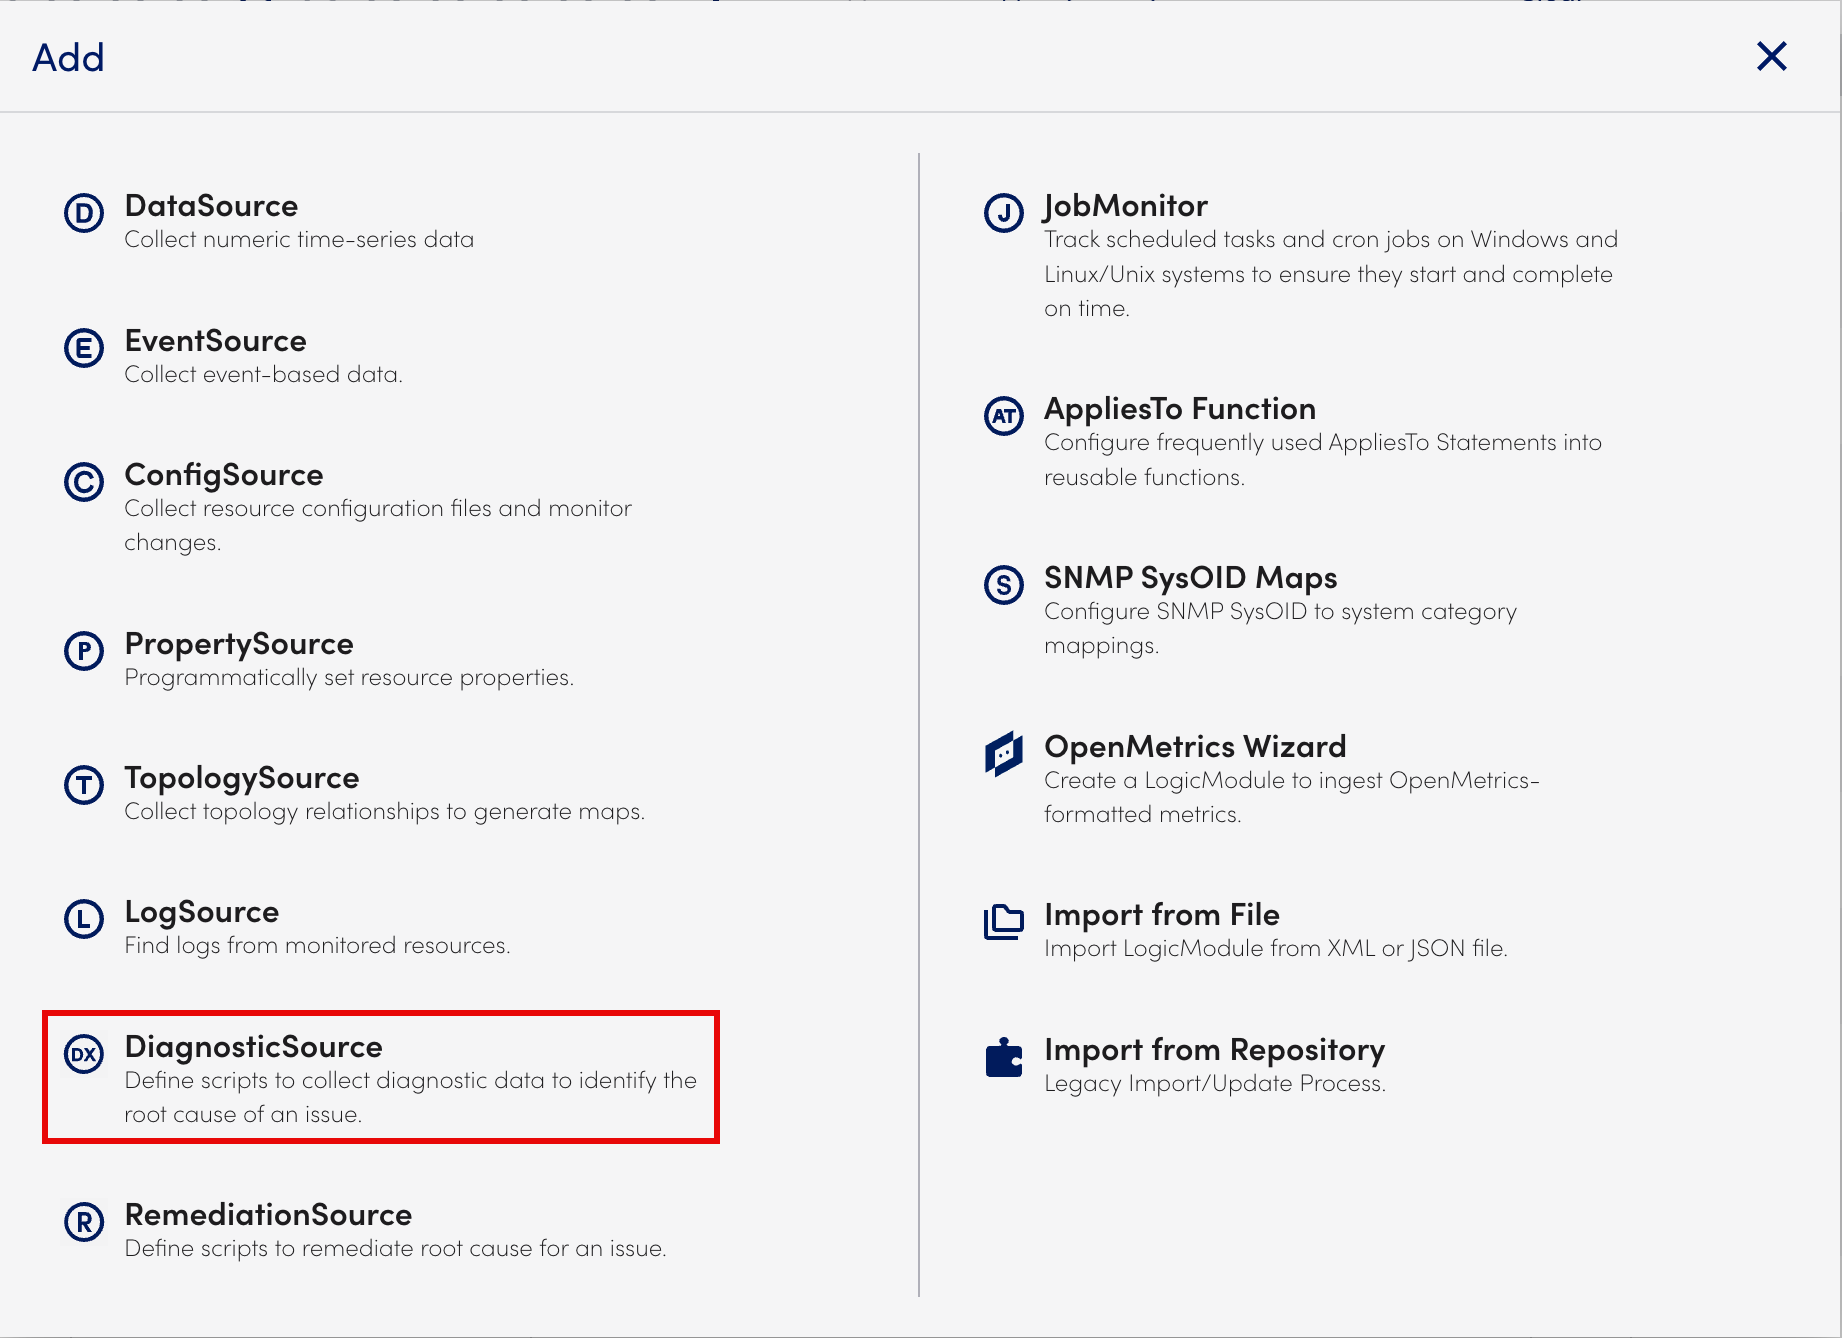
The Add DiagnosticSource page displays.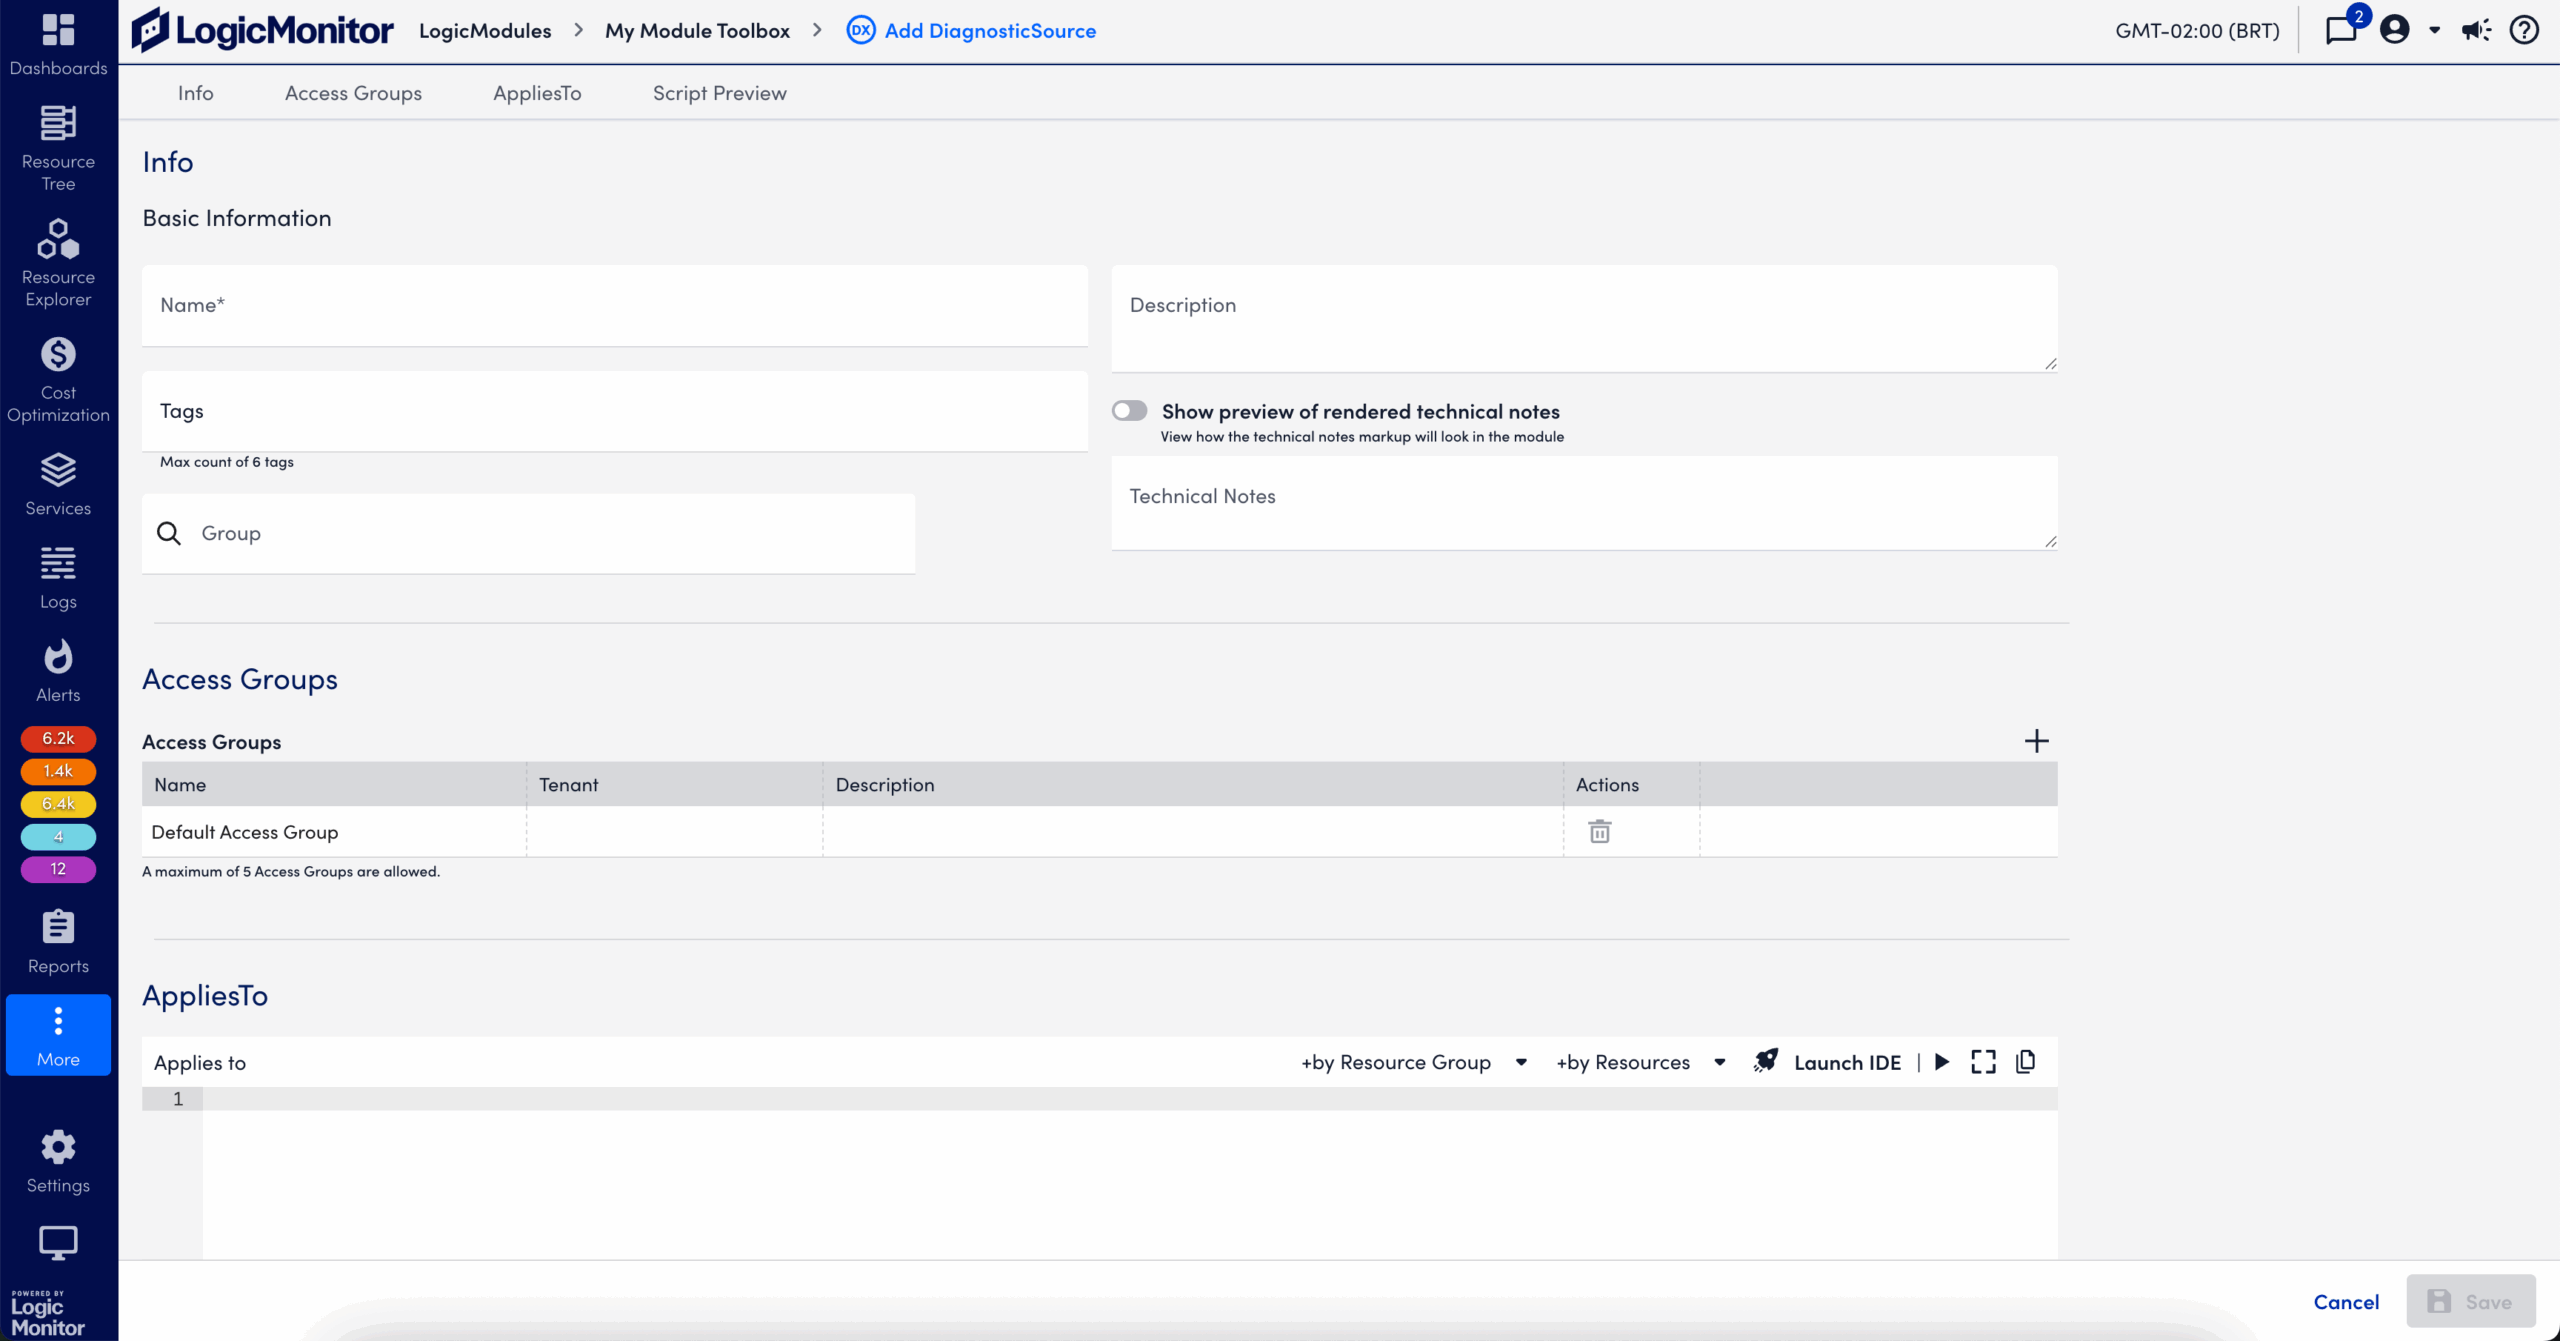
- On the Info tab, do the following:
- In the Name field, enter a unique name for the DiagnosticSource.
For example, you can specify the platform or application and, if necessary, a specific component of the platform. - (Optional) In the Description field, enter enough details to ensure that the DiagnosticSource’s purpose can be determined.
- (Optional) In the Tags field, add tags to filter the module.
- (Optional) In the Group field, specify the group to which the DiagnosticSource is added.
- (Optional) In the Technical Notes field, enter any notes or technical information.
- In the Name field, enter a unique name for the DiagnosticSource.
- Select the Access Groups tab and configure access groups as needed.
For more information, see Access Groups for Modules. - Select the AppliesTo tab, and do the following:
- Enter the applies to criteria.
The Applies to field accepts LogicMonitor’s AppliesTo scripting as input to determine which resources can be associated with the DiagnosticSource. - Select
 Test AppliesTo.
This test returns a count of matching resources, and displays them in the AppliesTo Results panel.
- Enter the applies to criteria.
- Select the Script Preview tab, and do the following:
- From the Collection Type dropdown menu, select the embedded script you want to use.
- Based on the selected collection type, enter a Groovy or PowerShell diagnostics script to gather data and identify the root cause of an issue.
- Select
 Test Script.
The Test Collection Script window displays. - In the Search Resources field, enter a value for a resource.
LogicMonitor attempts to match values as you type. - Select Run Test.
The test result displays in the stdOutput.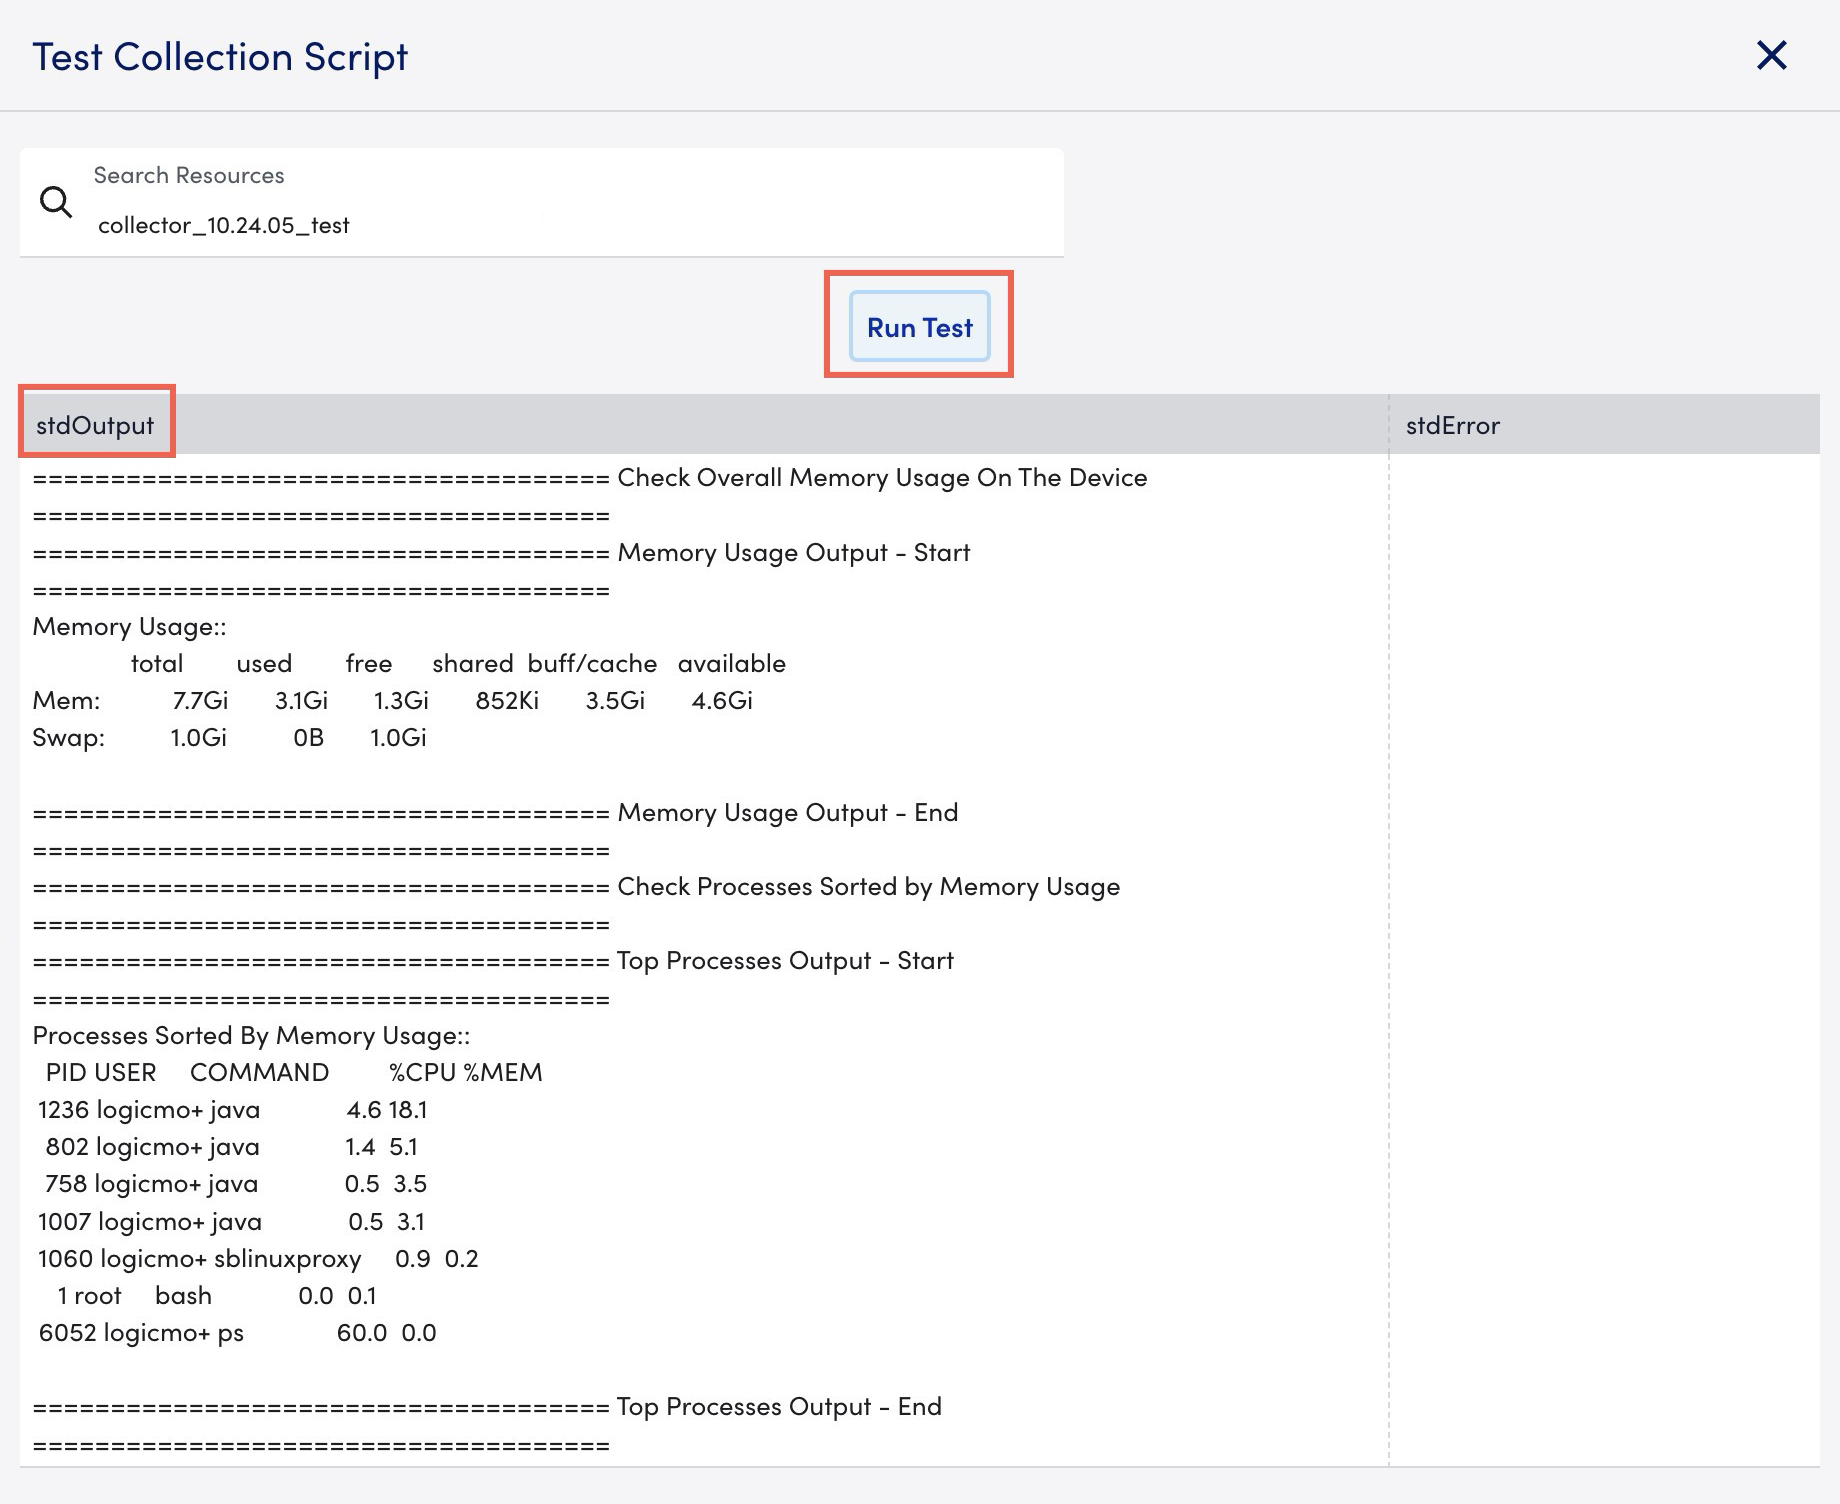
If the test script fails, details of the exception or error are displayed in the stdError. Close the Test Collection Script window to proceed.
- Select Save.
The DiagnosticSource is created and listed on the My Module Toolbox page.
