v.139 Release: Enhanced RBAC
Last updated on 14 September, 2022
v.139 Highlights:
- Feature Highlight: RBAC Enhancements
- Platform Enhancements: Topology mapping for resource groups, ability to set dynamic thresholds at resource group level, LM Exchange enhancements, and more
- New and Updated Monitoring Coverage: Infinidat InfiniBox; Oracle; RADIUS; TACACS; Windows Active Directory; a large number of new AWS, Azure, and GCP cloud services; and more
- Entering Beta: LM Logs
- Looking Ahead: New SiteMonitor external checkpoint location, elimination of percent() function use in complex datapoints
Feature Highlight: RBAC Enhancements
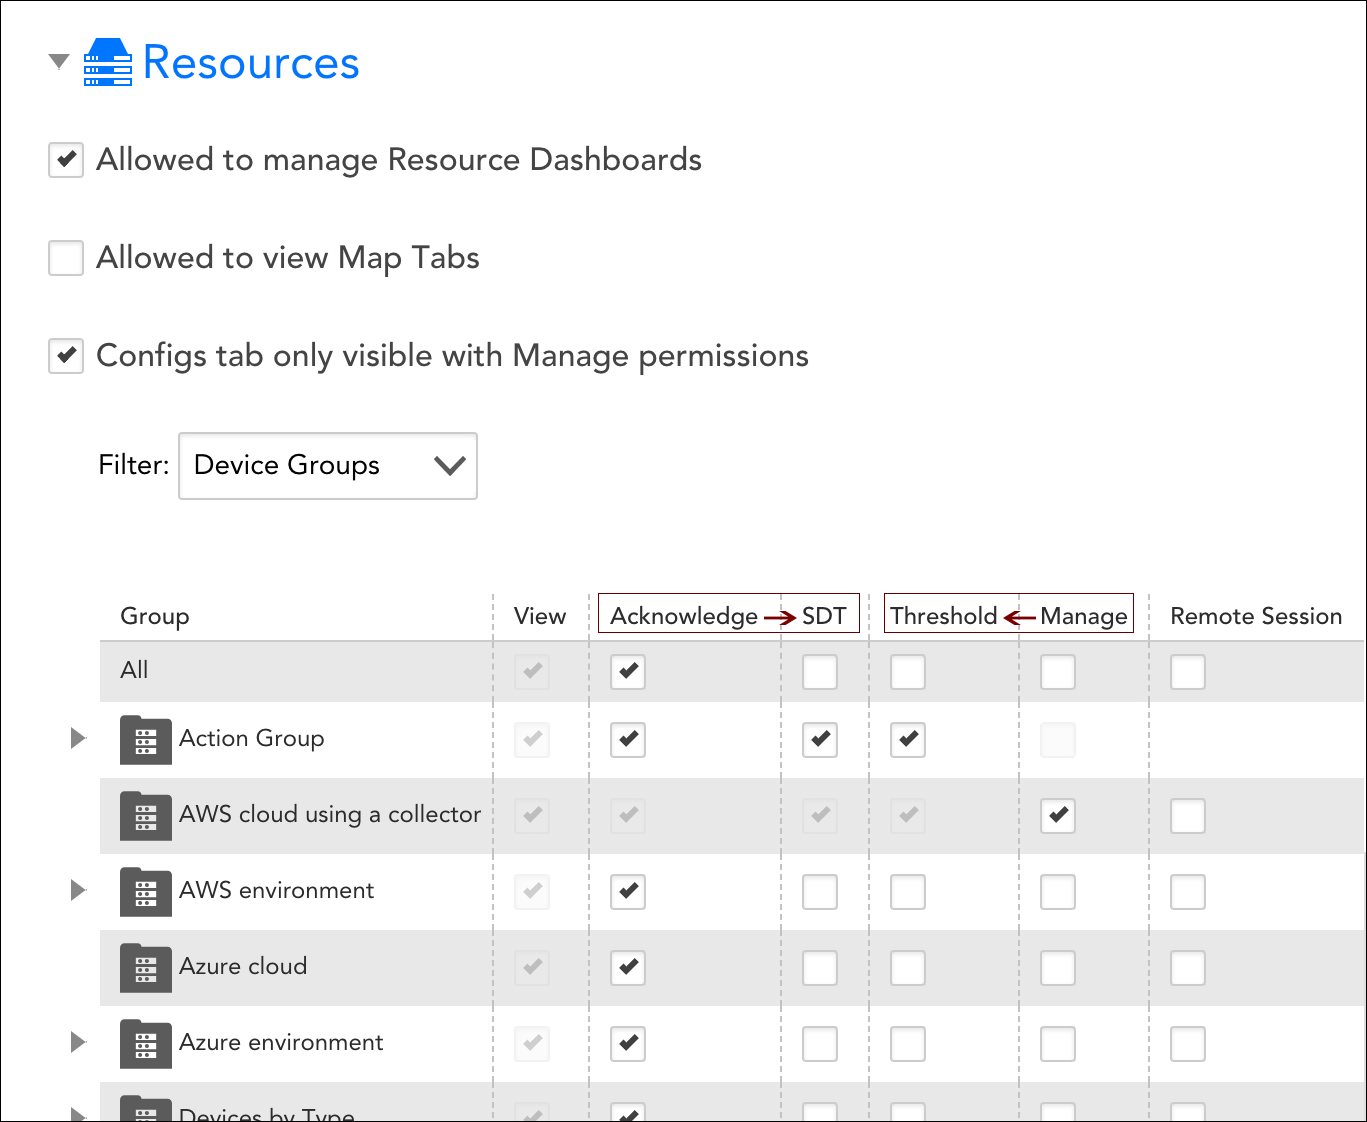
Providing you with more fine-grained control over allowed user activity, LogicMonitor has introduced two new permissions to its role-based access control (RBAC) system:
- Threshold. Threshold permissions allow a user to set or update datapoint thresholds at the resource group, resource, or instance level. Previously, datapoint threshold editing permissions were implicitly provided with manage permissions. And, while this is still the case, threshold permissions can now be assigned explicitly to resources, without the need to provide full manage permissions for those resources.
- SDT. SDT permissions allow a user to place a resource or website into scheduled downtime (SDT). Previously, SDT permissions were implicitly provided with acknowledge permissions; now, however, they must be assigned independently of acknowledge permissions. (As with threshold permissions, SDT permissions are still implicitly provided with manage permissions.)
Note: Upon rollout of v.139, users with administrator and manager roles will automatically be provisioned with these new permissions. In addition, threshold and SDT permissions will automatically be provisioned for any roles that currently have manage permissions in place for one or more resource groups. For example, if a role previously provided manage permissions for Resource Group X, that role will now provide manage, threshold, and SDT permissions for Resource Group X. Similarly, SDT permissions will be automatically provisioned for any roles that currently have acknowledge permissions (independently of manage permissions) in place for one or more website/resource groups.
Other Platform Enhancements
Alerting
- Dynamic threshold configuration at resource group level. Dynamic thresholds can now be configured at the resource group level. As with all group-level configurations, group-level dynamic threshold settings are inherited by all group (and subgroup) members. You may find this new capability useful for more quickly configuring thresholds that vary on a group-by-group basis. Note: Also as with all group-level configurations, If the same resource is a member of multiple sibling groups with varying configurations, the dynamic threshold configurations belonging to the group that was created first take precedence.
- Multi-paged editing of escalation chain stage table. Previously, if an escalation chain (as configured under Settings | Alert Settings | Escalation Chains) had enough stages to warrant pagination of the stages table, all pages past the first page were incorrectly displaying stage 1 only. This issue has been fixed.
Audit Logs
- Logging of device group moves. Previously, the action of moving a device group was not adequately logged in Audit Logs. Now, details for the removed/added parents of the group are added to the Audit Logs.
LM Cloud
- Improved character support for AWS CloudWatch metrics. You can now define custom AWS CloudWatch metrics that include “<” and “>” in the metric path. Because the “>” character is interpreted as a dimension separator, you’ll need to substitute the “<” and “>” characters with “[[” and “]]” respectively. For example, a path of
cloudwatch>pathshould be entered ascloudwatch]]pathwithin LogicMonitor.
LM Config
- Configuration file download. Attempts to download config files from the Configs tab for a ConfigSource (available from the Resources page) resulted in a 401 error. This has been resolved.
LM Exchange
- SNMP SysOID Map LogicModule display. Previously, the names for SNMP SysOID Maps were disappearing from the UI after importing them from LM Exchange. This has been fixed.
- TopologySource status display. Previously, TopologySources were displaying a status of “Customized” after import from LM Exchange.
- SLM display of differences. Previously, even if the Show only unresolved option was selected in the SLM (safe LogicModule merge) interface, all differences between the currently installed and new LogicModule versions were displaying—whether resolved or unresolved. This has been fixed.
- My Repository private/public status display. Previously, after publishing LogicModules as a package to the public repository from the My Repository interface, those LogicModules would incorrectly display as “Private”. This issue has been fixed.
NetFlow
- Netflow_Device_Heartbeat DataSource UI. The netflowHeartbeat and netflowAgentId datapoints were updated to display a type of “heartbeat” in the DataSource definition. This type is selectable via a radio button.
Reporting and Logs
- Graph data export. When exporting graph data in CSV format, the resulting file only included data for a 24-hour time period, regardless of the time range configured in the graph. This has been fixed.
- Logging of EventSource enable/disable activity. Previously, the enabling or disabling of alerting for an EventSource was not being successfully logged in LogicMonitor’s audit logs. This has been fixed.
REST API
- Get graph data. Previously, when using LogicMonitor’s REST API to get DataSource graph data, all “Y” axis units were being incorrectly labeled as “Values”. This has been fixed.
Security
- Miscellaneous security fixes and improvements. Various security fixes and improvements are being released with this version.
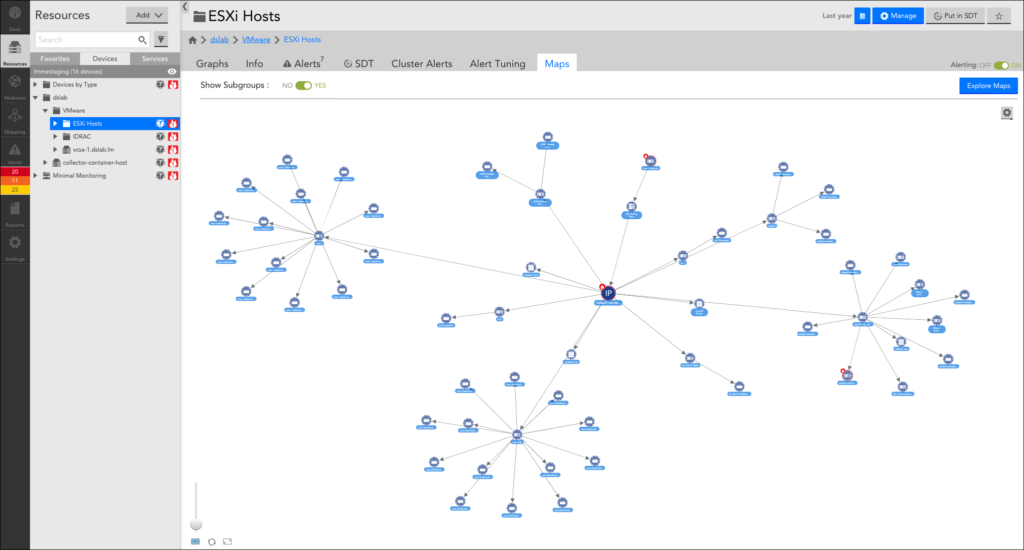
Topology Mapping
- Group-level viewing. Topology maps are now available for viewing at the group level on the Resources page (previously the Maps tab was only available at the individual resource level). A new Show Subgroups slider is available that allows you to toggle between display of just the resources in the current selected group or display of all resources in the current group and its subgroups.
New and Updated Monitoring Coverage
Upon your account’s upgrade to v.139, import our new and updated LogicModules from the LogicMonitor public repository to expand and enhance your monitoring coverage.
New Monitoring Coverage
- APC Rack PDU – 4 DataSources
LogicMonitor has released a new monitoring suite for APC rack PDUs that expands and restructures monitoring. Previously, only PDU load was primarily monitored; with the expanded capabilities made possible by the new suite of DataSources, current, voltage, power on state, and power utilization metrics are additionally monitored. The new suite consists of the following DataSources: APC_rPDU_Banks, APC_rPDU_GlobalPerformance, APC_rPDU_Phases, and APC_rPDU_SwitchedOutlet.
Important: This new monitoring suite deprecates the following legacy APC Rack PDU DataSources: APC Rack PDU Outlet Status-, APC Rack PDU Power Supplies, APCRackPDUBankLoad-, and APCRackPDUPhaseLoad-. If you are currently using these now-deprecated DataSources, you will not experience any data loss upon importing the new set of DataSources because of the name variations that exist between the two sets. However, you will collect duplicate data and potentially receive duplicate alerts for as long as both sets of DataSources are active. For this reason, we recommend that you disable the legacy DataSources after you have imported the new ones and verified that they are working as expected.
- AWS Elemental MediaConnect – 1 DataSource
The new AWS_Elemental_MediaConnect DataSource monitors throughput, requests, and error counts for AWS Elemental MediaConnect flows.
- AWS Elemental MediaPackage – 1 DataSource
The new AWS_Elemental_MediaPackage DataSource monitors throughput, response codes returned, and response time for AWS Elemental MediaPackage channels.
- GCP Cloud Tasks – 1 DataSource
The new GCP_DeveloperTools_CloudTasks DataSource monitors queue depth, latency and request/attempt counts for Cloud Tasks.
- Infinidat InfiniBox – 15 DataSources, 1 PropertySource
Comprehensive monitoring of the Infinidat InfiniBox enterprise storage system using the InfiniBox REST API. For setup and monitoring details, see Infinidat InfiniBox Monitoring.
- Microsoft Azure App Service – 1 DataSource
The Microsoft_Azure_AppService_Environments_MultiRolePool DataSource monitors pool requests, response time, HTTP return codes, and performance metrics for the Microsoft Azure App Service.
- Microsoft DHCP – 3 ConfigSources
LogicMonitor has released three new ConfigSources that monitor various elements of a Windows DHCP server, alert on changes, and, in some cases, provides a history of IP address assignments. For setup and monitoring details, see Microsoft DHCP Monitoring.
- Microsoft Azure Queue Storage Capacity – 1 DataSource
Monitors metrics for Azure Queue storage services (reported hourly by Azure).
- Microsoft Azure Storage Account Capacity – 1 DataSource
Monitors metrics for Azure storage accounts (reported hourly by Azure).
- Microsoft Azure Table Storage Capacity – 1 DataSource
Monitors performance metrics for Azure Table storage services (reported hourly by Azure).
- Oracle Database Tablespaces – 1 DataSource
A new DataSource named Oracle_Database_TableSpaceStatus was added to the Oracle monitoring suite. This DataSource discovers Oracle database tablespaces and determines whether they are online, read-only or offline.
- RADIUS server authentication – 1 DataSource
LogicMonitor has released a new DataSource named RADIUS_SyntheticTransaction that tests authentication to a RADIUS server. Using provided credentials and a specified authentication protocol, this DataSource initiates a synthetic transaction with the RADIUS server and reports on success status, as well as amount of time for transaction connection (or failure).
Note: Collector version 29.100 (or a higher version number) is required for this DataSource.
- SwiftStack – 5 DataSources
LogicMonitor has released five new DataSources for the SwiftStack monitoring suite. In addition to providing greater efficiency and scalability, these DataSources append the cluster UUID for the purpose of making WildValues unique. The new DataSources are: SwiftStack_Cluster_AccountStorageUtlization, SwiftStack_Cluster_AccountTransferUsage, SwiftStack_Cluster_PolicyAccountStorageUtlization, SwiftStack_Cluster_PolicyStorageUtilization, and SwiftStack_Cluster_PolicyUsage.
Important: These new DataSources deprecate the following SwiftStack DataSources: SwiftStack_Cluster_AccountStorageUsage, SwiftStack_Cluster_AccountTransferUtilization, SwiftStack_Cluster_PolicyAccountStorageUsage, SwiftStack_Cluster_PolicyCapacity, and SwiftStack_Cluster_PolicyStorageUsage.
For more information on setup and migration, see SwiftStack Monitoring.
- TACACS server authentication – 1 DataSource
LogicMonitor has released a new DataSource named TACACS_SyntheticTransaction that tests authentication to a TACACS server. Using provided credentials and a specified authentication protocol, this DataSource initiates a synthetic transaction with the TACACS server and reports on success status, as well as amount of time for transaction connection (or failure).
Note: Collector version 29.100 (or a higher version number) is required for this DataSource.
- Windows Active Directory – 9 ConfigSources, 1 PropertySource
LogicMonitor has released nine new ConfigSources to monitor critical elements of a Windows domain, alert on changes, and, in some cases, alert on deviations from recommended Microsoft best practice. For setup and monitoring details, see Windows Active Discovery Monitoring.
Updated Monitoring Coverage
- APC Rack PDU – 4 DataSources (deprecated)
As highlighted in the New Monitoring Coverage section, LogicMonitor has released a new monitoring suite for APC rack PDUs that provides significantly enhanced monitoring. This new monitoring suite deprecates the following legacy APC Rack PDU DataSources: APC Rack PDU Outlet Status-, APC Rack PDU Power Supplies, APCRackPDUBankLoad-, and APCRackPDUPhaseLoad-.
If you are currently using these now-deprecated DataSources, you will not experience any data loss upon importing the new set of DataSources because of the name variations that exist between the two sets. However, you will collect duplicate data and potentially receive duplicate alerts for as long as both sets of DataSources are active. For this reason, we recommend that you disable the legacy DataSources after you have imported the new ones and verified that they are working as expected.
- Cisco_ASA_Temperature – 1 DataSource
Lowered the rejection threshold for temperature estimation to account for erroneous temperature values returned by some ASA devices.
- Cisco Firepower – 7 DataSources, 1 PropertySource
Added support for Cisco Firepower FPR-1140 Security Appliance to the following LogicModules: Cisco_Firepower_Chassis, Cisco_Firepower_CPU, Cisco_Firepower_Fans, Cisco_Firepower_Memory, Cisco_Firepower_PSU, Cisco_Firepower_SecurityModule, Cisco_Firepower_SecurityModule_Filesystems, and addCategory_CiscoFirepowerSNMP.
- Cisco_HyperFlex_ClusterPerformance – 1 DataSource
Changed the sent Referer header to lowercase to accommodate the field’s case sensitivity. Allowed for empty responses from the server.
- Cisco Meraki – 8 DataSources
Updated the Active Discovery script to use serial number instead of device name for WildAlias due to naming conflicts for the following DataSources: Cisco_Meraki_AccessPoint_Interfaces, Cisco_Meraki_AccessPoints, Cisco_Meraki_Gateway_Interfaces, Cisco_Meraki_Gateways, Cisco_Meraki_SecurityAppliance_Interfaces, Cisco_Meraki_SecurityAppliances, Cisco_Meraki_Switch_Interfaces, and Cisco_Meraki_Switches.
Important: Updating to these new DataSource versions will result in loss of historical data due to instance renaming. These DataSources were very recently introduced so data loss will not encompass more than a few weeks of collected data.
- Cisco_UCS_Faults – 1 DataSource
Switched “warning” and “minor” severity status codes for several datapoints. Updated error alert thresholds to alert only if the fault has “major” severity. Added filter to exclude FSM related faults.
- Cisco_Wireless_AP – 1 DataSource
Remove instance level grouping for improved visibility across all access points; created new complex datapoints (AdminStatusDisabled, AdminStatusEnabled, and OperationStatusDisassociated) to support two new overview graphs.
- EMC Avamar – All LogicModules (9 DataSources, 1 PropertySource)
Removed unnecessary try/catch blocks from all LogicModules in the suite. In addition, the following unique updates were made to the following LogicModules:
- EMC_Avamar_Checkpoints. Fixed the Valid Value Range values for the errors and validated datapoints.
- EMC_Avamar_Datasets. Fixed issue that was preventing data collection for instances with spaces in the WildValue. This update will cause historical data loss, but only for instances that were impacted by this issue (which means they were not collecting data in the first place).
- EMC_Avamar_Servers. Fixed issue that was causing collection issues for the bytes_protected datapoint.
- addCategory_EMC_Avamar. Fixed issue that was preventing identification of Avamar version number when the
/usr/local/avamarfolder contained multiple files.
- HP_3PAR_CPG – 1 DataSource
Improved the reliability of the data collection script.
- Linux_SSH_Filesystems – 1 DataSource
Added handling for long filesystem names.
- LogicMonitor_Collector_BufferDataReporterLatency – 1 DataSource
Updated collection script to return 0 for values of minReportLatency and maxReportLatency datapoints that are too high/low.
- Microsoft_Azure_StorageAccount – 1 DataSource
Updated the aggregation type for the Transactions datapoint to use the Microsoft recommended aggregation type.
- Microsoft_Azure_VirtualNetworkGatewayConnection – 1 DataSource
Added a datapoint (named provisioningState), graphs, and alert thresholds to capture and alert on the provisioning state of the connection. Updated the egressBytesTransferred and ingressBytesTransferred datapoints to use counter instead of gauge. Added a Top Connections by Throughput overview graph.
- Microsoft_DHCP_IPv4Scopes – 1 DataSource
Corrected a bad IF statement in the Active Discovery script that was causing discovery to fail.
- NetSNMPCPUwithCores – 1 DataSources
Included the CPURawNice datapoint in the calculation of the CPUBusyPercent complex datapoint.
- Nimble_Volume_Latency – 1 DataSource
Fixed expressions for the WeightedReadLatency and WeightedWriteLatency complex datapoints. Updated both alert messages to indicate that datapoint values are weighted.
- OpenMetrics – 2 (All) DataSources
Fixed regression that was causing collection and Active Discovery scripts to look for the existence of openmetrics.ssl and openmetrics.maphostname properties instead of the actual value of the properties.
- Oracle – 18 DataSources, 1 PropertySource
- For all the DataSources in the Oracle monitoring suite (with the exception of the Oracle_Database_SystemMetrics and Oracle_Database_Troubleshooter DataSources), the Active Discovery return code was changed from 1 to 0, which causes instances that are no longer discovered to be marked for deletion rather than holding on to stale database instances.
- Updated the script for the Oracle_Database_Info PropertySource to properly close connections.
- Pure_Storage_ComponentStatus – 1 DataSource
Added “-1” as a status code for the status datapoint to represent the “not_installed” component state.
- SNMP HR Disks – 2 DataSources
For the snmpHRDisk- and snmpHRLargeDisk- DataSources, updated the AppliesTo logic to associate with UCOS.
- SSL_Certificates – 1 DataSource
- Added a status of “-1” (unknown) to several datapoints to indicate that a particular issue was not explicitly identified, but may have been obscured by detection of another issue with the certificate.
- Added a status of “0” to indicate that the certificate does not have the issue.
- Renamed the UnknownException datapoint to OtherException. Important: Upon updating, LogicMonitor will treat this datapoint as a brand new datapoint and all historical data previously collected for it will be lost. You can avoid this data loss by changing the datapoint’s name to the new name (OtherException) before importing this updated DataSource.
- StatusPageIO_Service_Status – 1 DataSource
Updated the Active Discovery script to replace “:” with “-” in WildValue. Updated the collection script to prevent WildValue mismatch on collection output.
- SwiftStack – 5 DataSources (deprecated)
As highlighted in the New Monitoring Coverage section, LogicMonitor has released five new DataSources for the SwiftStack monitoring suite. These new DataSources deprecate the following SwiftStack DataSources: SwiftStack_Cluster_AccountStorageUsage, SwiftStack_Cluster_AccountTransferUtilization, SwiftStack_Cluster_PolicyAccountStorageUsage, SwiftStack_Cluster_PolicyCapacity, and SwiftStack_Cluster_PolicyStorageUsage.
For more information on setup and migration, see SwiftStack Monitoring.
- Topology Mapping – 8 PropertySources, 4 TopologySources
- Fixed issue that was causing the application of ERTs of “unknown” to devices with sysinfo properties that contained newlines in their values for the following PropertySources: addERI_Arista, addERI_Cisco, addERI_Device, addERI_HPSwitch, addERI_Huawei, and addERI_Juniper.
- Additionally, for addERI_Cisco, the assumption that HSRP support indicates the device is a router has been removed to ensure the correct device type is applied.
- Additionally, for addERI_HPSwitch, updated the regex used for parsing ERTs and updated ERT discovery to use sysOIDs in addition to host properties.
- Additionally, for addERI_Juniper, fixed issue that was causing some security appliances with a value of “Router” in their sysinfo to be classified as routers instead of firewalls.
- The addERI_PaloAlto PropertySource and PaloAlto_L2_HA TopologySource were updated to resolve merges caused by virtual MACs used by Palo Alto High Availability.
- The addERI_Windows PropertySource now blocks various VMware virtual MACs to prevent devices from different environments with duplicate MAC addresses from causing topology mapping issues.
- The Networking_L2_snmpSwitch TopologySource, now uses remotePortID instead of deviceID for LLDP entries where the deviceID starts with ‘vmnic’, and avoids using CDP entries whose deviceId starts with ‘vmnic’.
- For the VMware_ESXi_Topology and VMware_vCenter_Topology TopologySources, updated script to use LLDP chassis ID instead of port ID.
- UNC Monitor- – 1 DataSource
Fixed script output to include response used for setting the Found datapoint value.
- WinAD- – 1 DataSource
Cleaned up datapoint descriptions, graphs, and alert messages.
- Veeam_BackupAndReplication_Jobs_SureBackups – 1 DataSource (deprecated)
This DataSource is a duplicate of the Veeam_BackupAndReplication_Jobs_VMWareSureBackups DataSource and, as such, has been deprecated.
- VMware_vCenter_ResourcePools – 1 DataSource
Updated the Active Discovery and collection scripts to use multi-threading for improved performance.
- VMware_vCenter_VMInterface – 1 DataSource
Added graphs for data throughput and packet transmission.
- VMware_vCenter_VMPerformance – 1 DataSource
Made updates to facilitate the blocking of duplicate MAC addresses causing topology mapping issues.
- VMware_[vCenter][vSphere]_VMStatus – 2 DataSources
- A new datapoint named ConsolidationNeeded has been added to the VMware_vCenter_VMStatus and VMware_vSphere_VMstatus DataSources to indicate when a VM has a virtual disk with snapshots that needs to be manually consolidated.
- The VMware_vCenter_VMStatus DataSource also contains updates to facilitate the blocking of duplicate MAC addresses causing topology mapping issues.
- WinCPUCore- – 1 DataSource
Updated misleading statement about AppliesTo in the DataSource Description field.
- Windows LogicModules – 36 DataSources, 6 EventSources
Updated the AppliesTo logic for Windows LogicModules to exclude association with Windows Server Failover Cluster (WSFC) resources. This will help eliminate the dual alerting that happens with Windows resources that are reporting to the cluster and the node. All of the modules listed next will no longer apply to cluster virtual network names (VNNs) or virtual IP (VIP) addresses. They will only apply to the nodes.
- DataSources:
- .NetCLRExceptions
- .NetCLRLoader
- .NetCLRLocksAndThreads
- .NetCLRMemory
- Application Pools-
- Terminal Services
- Win SMTP
- Win SMTP Server
- Win2k12_HyperV_HypervisorStats
- Win2k16_HyperV_HypervisorStats
- Win2k8_HyperV_HypervisorStats
- Win2k8r2_HyperV_HypervisorStats
- Win_HyperV_CPU
- Win_HyperV_Snapshots
- Win_HyperV_VirtualMachines
- Win_HyperV_VirtualNetworkAdapter
- Win_HyperV_VirtualStorage
- Win_HyperV_VirtualSwitches
- Win_HyperV_VirtualSwitchPorts
- Win_WMI_Access_Denied_ErrorCodes
- Win_WMI_UACTroubleshooter
- WinAD-
- WinCPU
- WinCPUCore-
- Windows DNS Server-
- Windows Stuck Print Jobs-
- Windows_TimeOffset
- WinIf-
- WinLogicalDrivePerformance-
- WinMemory64
- WinOS
- WinPhysicalDrive-
- WinServer
- WinTCP
- WinUDP
- WinVolumeUsage-
- EventSources
- Windows Domain Services Event Log
- Windows Exchange Events
- Windows IIS Events
- Windows Security Event Log
- Windows SQL Events
- Windows System Event Log (note: additionally, the filters for this EventSource were updated to ignore events with event ID 10016)
Entering Beta: LM Logs
LM Logs makes logs usable when they are needed most, before performance issues result in business problems. This new feature offers a unique and unified approach to log analysis centered on algorithmic root-cause analysis.
Actionable log data is correlated with metrics and presented as context to alerts within LogicMonitor to help you more quickly make the leap from what issues are occurring to why they are occurring, reducing mean time to repair.
Initially, we are looking for beta participants with AWS CloudWatch or S3-based logs to test LM Logs’ AWS integration. However, over the beta period, we’ll make additional integrations available for testing and expand customer eligibility.
LM Logs is entering beta within the next couple of weeks. If you’d like to be considered for participation, fill out the LM Logs Beta form.
Looking Ahead
Datapoints
- Elimination of percent() function use in complex datapoints. In an upcoming release, LogicMonitor intends to add validation for the purpose of preventing the use of the
percent()function within complex datapoint expressions. This function is intended to produce a percentile value, but requires data for multiple timestamps to do this. As such, it only works properly in virtual datapoints and its use within complex datapoints introduces ambiguity. As part of this initiative, we will also remove any existing complex datapoints that reference this method to ensure continuity in existing DataSource functionality. Note: If you are using this function in the snmp64_If- DataSource, we recommend updating to the latest SNMP_Network_Interfaces DataSource, which uses Groovy to automatically handle this logic outside of complex datapoints.
Website Monitoring
- Originating IP address updates for SiteMonitor. Beginning with v.137 (and ongoing), LogicMonitor has been updating the originating IP addresses for our SiteMonitor service, which consists of external testing locations used for Web Checks and Ping Checks.
Shortly after your portal is updated to v.139, you will see the location of Web Checks and Ping Checks coming from the “US – San Francisco” checkpoint change to reference the new “US – Oregon” checkpoint, which is replacing the San Francisco checkpoint. This update will be seamless and requires no action on your part. All historical data will be retained.
All potential IP addresses are listed in LogicMonitor’s External Testing Locations. Please ensure that your network’s firewall(s) permits access to all IP addresses on this list in order to maintain continued service.
- DataSources: