


Updated on October 28, 2022
Known Issue
- Setting thresholds at instance group level does not save the threshold at the group level. New instances do not inherit the threshold as expected.
Highlights
- Feature Highlights: New LogicMonitor Notification Center. New support for monitoring Azure PostgreSQL Citus. Released the LogicMonitor OpenTelemetry Collector on Ansible Galaxy.
- General Updates: Expanded cloud monitoring for AWS, Azure, and GCP. Improvements to container monitoring.
- Updated Monitoring: Released new modules to monitor Azure PostgreSQL Citus and AWS Backup.
Feature Highlights
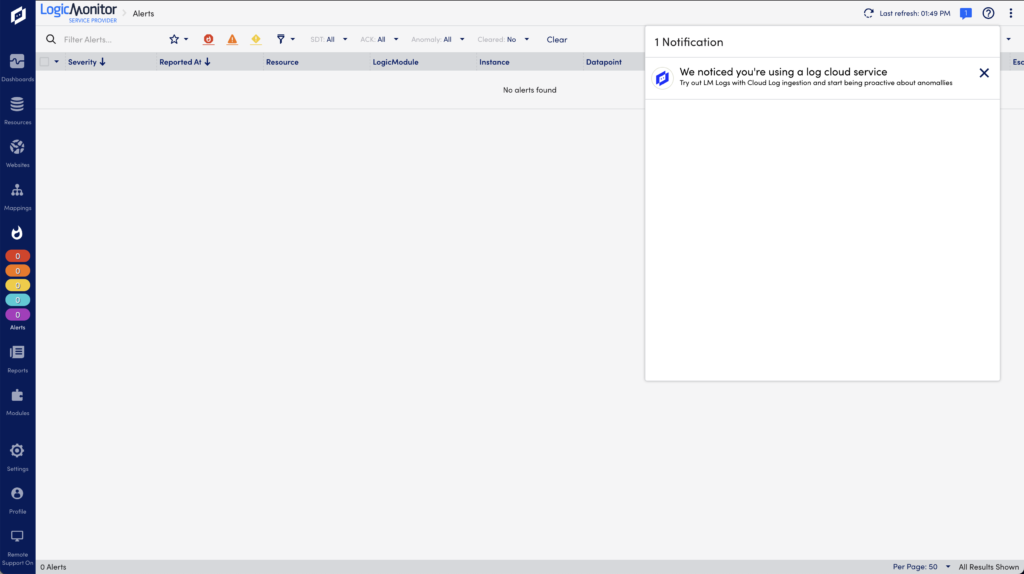
New LogicMonitor Notification Center
Note: Notification Center is currently only available if you have access to the new UI preview. To gain access, contact Customer Success.
LogicMonitor now provides a Notification Center in your LogicMonitor portal to notify you of features that can enhance your experience of LogicMonitor as a platform. For example, your environment may be using a log cloud service and not leveraging LM Logs. LogicMonitor makes you aware of this feature directly in your portal using the Notification Center. From the Notification Center, you can navigate to more information about LM Logs and how you could benefit from the feature. For more information, see Notification Center.
Expanded Monitoring for Microsoft Azure
LogicMonitor cloud monitoring for Azure now includes support for monitoring Azure Database for PostgreSQL – Hyperscale (Citus). Azure PostgreSQL Citus shows you metrics from your Hyperscale (Citus) servers and server groups.
Release of LMOTEL Collector on Ansible Galaxy
The LogicMonitor OpenTelemetry (LMOTEL) Collector is now available as an Ansible Collection on Ansible Galaxy. The collection includes the Ansible modules and plugin for interacting with LogicMonitor. For more information, see the LogicMonitor Ansible Collection.
General Updates
Application Performance Monitoring
Known Issues
- The inline support documentation tab does not display in the LMOTEL Collector installation page.
Cloud Monitoring
Enhancements
- Added the option to “Enable Local Collector” to Azure Postgres monitoring for Hyperscale (Citus).
- Added a datapoint to AWS NetApp ONTAP FSx that calculates free storage from AWS file system metrics.
- Updated the Microsoft_Azure_QueueStorage datasource to return a value of 0 instead of No Data / Null when no data exists. This prevents a gap in data collection.
- Updated the datasource for AWS Lambda services to include metrics for invocations, errors, throttles, duration, concurrent executions, and more.
Bug Fixes
- The Azure NetApp Monitor was getting incorrect metric lists.
- Removed or updated datapoints in AWS Athena that were no longer valid.
Known Issues
- You can no longer create new Azure devices from Resources > Add > Cloud Account (Legacy).
Container Monitoring
Enhancements
- If you are using a custom container registry to store Collector images, you can now specify the name of the container registry as a parameter in the Helm values file.
Logs
Enhancements
- Log Anomalies and Log Alert Severity log information is now displayed in their own respective columns. Previously, anomalies and log alert severity were combined into the Severity column.
Settings
Enhancements
- You can now suspend inactive users in Settings > Account Information.
LogicModule Releases
New and updated LogicModules are available for you to import from the LogicMonitor Public Repository. This section lists the LogicModules that are new in this release, updated in this release, or will be removed in a future release. Changes related to the LogicModule feature will be listed under General Updates.
New LogicModules
| LogicModule Name | Details |
| (2 DataSources) AWS_Backup_ProtectedResourcesNormalized AWS_Backup_VaultsNormalized_1h | New cloud monitoring for AWS Backup that converts No Data/Null values to 0 to prevent displaying gaps in data. |
| (1 DataSource) Microsoft_Azure_PostgreSQLCitus | New cloud monitoring for Azure PostgreSQL Citus. |
Updated LogicModules
| LogicModule Name | Details |
| (1 DataSource) AWS_Athena | Removed the following datapoints: canceledDDLProcessedMB, failedDDLProcessedMB, and succeededDDLProcessedMB. |
| (2 DataSources) AWS_Elasticsearch_MasterNodes AWS_Elasticsearch_DataNodes | Fixed a bug in the metric path. |
| (30 DataSources) Cisco_ASA_Failover Cisco_ASR_ControlPlaneHealth Cisco_ASR_EmbeddedServicesProcessor Cisco_ASR_EmbeddedServicesProcessorCores Cisco_ASR_RouteProcessor Cisco_ASR_RouteProcessorCores Cisco_ASR_SPAInterfaceProcessor Cisco_ASR_SPAInterfaceProcessorCores Cisco_EIGRP_Peers Cisco_FRU_Power Cisco_Firepower_SecurityModule Cisco_IPSec_AggregateTunnels Cisco_Multicast_Groups Cisco_SIP_Client_Errors Cisco_SIP_Traffic Cisco_Wireless_DHCPStatistics Fortinet_FortiGate_ActiveIPSecVPNTunnels Fortinet_FortiGate_Antivirus Fortinet_FortiGate_DialupVPNPeers Fortinet_FortiGate_FirewallPolicies Fortinet_FortiGate_FortiGuard Fortinet_FortiGate_IPSecVPNTunnels Fortinet_FortiGate_IntrusionPreventionSystem Fortinet_FortiGate_LinkMonitor Fortinet_FortiGate_SSLVPNStatsByVDOM Fortinet_FortiGate_Sensors Fortinet_FortiGate_WebFilter Fortinet_FortiGate_WirelessControllerStations Fortinet_FortiManager_IPSessions Fortinet_FortiWLC_Interfaces (14 PropertySources) Cisco_Wireless_Info Fortinet_FortiGate_Info HP_Product_Info PaloAlto_Product_Info Raritan_PowerDistribution_Info Sentry4_Product_Info Viptela_Product_Info addCategory_Cisco_Multicast addCategory_MSSQL addCategory_NetscalersActive addCategory_SolarisNetSNMP addCategory_mGuard addERI_Cisco_EIGRP addERI_Fortinet_FortiGate (2 TopologySources) Cisco_HSRP_L2_HA Fortinet_FortiGate_SDWAN | Increased performance by reducing access of hostProps and passing null instead, since hostProps is already known to SNMP functions. |
| (24 DataSources) Cisco CUCM CTI Devices- Cisco CUCM Gateways- Cisco CUCM Media Devices- Cisco CUCM Phones- Cisco CUCM Voice Mail Devices- Cisco_CUCM_Processes HP LeftHand Cache status- HP LeftHand Disk- HP LeftHand Fan- HP LeftHand NSM- HP LeftHand Power Supply- HP LeftHand RAID Status OS- HP LeftHand RAID Status Storage- HP LeftHand Temperature- Lighttpd- Linux Disk Performance- Linux NFS Server stats- Memcached- Mysql- Quantum Library System Quantum Logical Libraries Quantum Tape Drives Redis Replication- Synology Raid Status Synology Status Varnish- snmpHR_NFSMount- (2 PropertySources) addCategory_AxcientBackup addCategory_MSSQL addCategory_NetSNMP_ExtendMeminfo addCategory_Synology addERI_Linux (1 TopologySource) Docker_Topology | Updated appliesTo functions to exclude Kubernetes pods. |
| (1 DataSources) Cisco_System_PowerSupplies | The logic that was implemented for generating alerts from complex datapoints would evaluate to NaN if their inputs were also NaN and prevented a new instance of an alert to be generated if a poll was missed. |
| (1 DataSource) Cisco_UCS_Sessions | Fixed the host property import and the logic for handling null entries in the collector cache for cookies. |
| (1 DataSource) Cisco_Wireless_AP | Streamlined SNMP for performance improvements. |
| (1 DataSource) Citrix_VAD_MachineSummary | Fixed a bug in the collection script. |
| (1 DataSource) Cohesity_DataPlatform_ProtectionJobs | Removed max value range on BackupStatus datapoint and improved graphs. |
| (6 DataSources) Isilon Fans- Isilon Node Disks- Isilon Node Network Performance Isilon Node Protocol Performance- Isilon Temp Sensor- Isilon Temp Throttle Sensor- (1 PropertySource) addCategory_Isilon | Updated to include more protections against Cloudgenix devices getting the system category applied due to Cloudgenix sharing OIDs with Isilon. AppliesTo statements have been updated to explicitly exclude known Cloudgenix sysOIDs. |
| (2 DataSources) Microsoft_Azure_FileStorage Microsoft_Azure_QueueStorage | Updated the Availability complex datapoint. |
| (1 DataSource) Microsoft_Azure_VirtualDesktopHostPools | Fixed a bug in the metric path. |
| (1 DataSources) Microsoft_Azure_VirtualDesktopSessionHosts | Fixed descriptions in the status datapoint. |
| (1 DataSource) Microsoft_Windows_Cluster_Disks | Improved scripts to correctly exclude volumes with unassigned GUIDs. |
| (1 PropertySource) addCategory_CitrixMonitorServiceV4 | Added a fallback if WMI access is denied to Win32_Service and set a category for CitrixMonitorServicev4 if valid. |
| (1 PropertySource) addCategory_MicrosoftExchange_PowerShell | Expanded functionality to Azure-hosted servers. |
| (1 PropertySource) addERI_Fortinet_FortiGate | Updated default ERT. |
| (1 PropertySource) addERI_PaloAlto | Removed L2 ERI setting. |
| (4 TopologySources) BGP_Topology Cisco_EIGRP Networking_L2_snmpSwitch OSPF_Topology | Maps interface connection details by default. |
| (1 TopologySource) Cisco_Wireless | Updated appliesTo statement to match that of related DataSource Cisco_Wireless_AP. |
| (1 TopologySource) Networking_L2_snmpSwitch | Improved HyperV host connections. |
Deprecated LogicModules
This table lists LogicModules that we are deprecating in this release. This means that these LogicModules will be removed in a future release. If available, a replacement LogicModule is listed. For the history of deprecated modules, see Deprecated LogicModules.
| LogicModule Name Deprecated/Replacement | Details | End of Support Date |
| Deprecated: PaloAlto_SDWAN_Elements PaloAlto_SDWAN_Site_Performance PaloAlto_SDWAN_Site_WANLinkQuality PaloAlto_SDWAN_WatchDog addCategory_PaloAlto_SDWAN addERI_PaloAlto_SDWAN PaloAlto_SDWAN_SiteEvents PaloAlto_SDWAN_Topology Replacement: SNMP_Network_Interfaces SNMP_Host_Uptime snmpTCPUDP | LogicMonitor deprecated the recently released PaloAlto SD-WAN package because it failed to meet our quality standards. Recommendation: Use LogicMonitor’s native SNMP capabilities to monitor Palo Alto Network Prisma SD-WAN Instant-On (“ION”) devices (formerly Cloudgenix). LogicMonitor is actively assessing how to leverage Palo Alto Networks’ Unified SASE SD-WAN API to deliver complementary, additional monitoring value to Prisma SD-WAN customers and partners. | December 31, 2023 |
| Deprecated: AWS_Backup_Vaults_24h Replacement: AWS_Backup_Vaults_1h | This module duplicates AWS_Backup_Vaults_1h and provides no new functionality with the only difference being collection interval. Customers who want to collect data at different intervals should modify DataSources directly or make a clone to customize to suit their needs. | October 21, 2022 |
