


The v.79 release will be rolled out through mid-August. Some of the gems included in this release are: Dashboard Sharing, a new SLA Widget, and additions to our suite of REST API resources.
Dashboard Sharing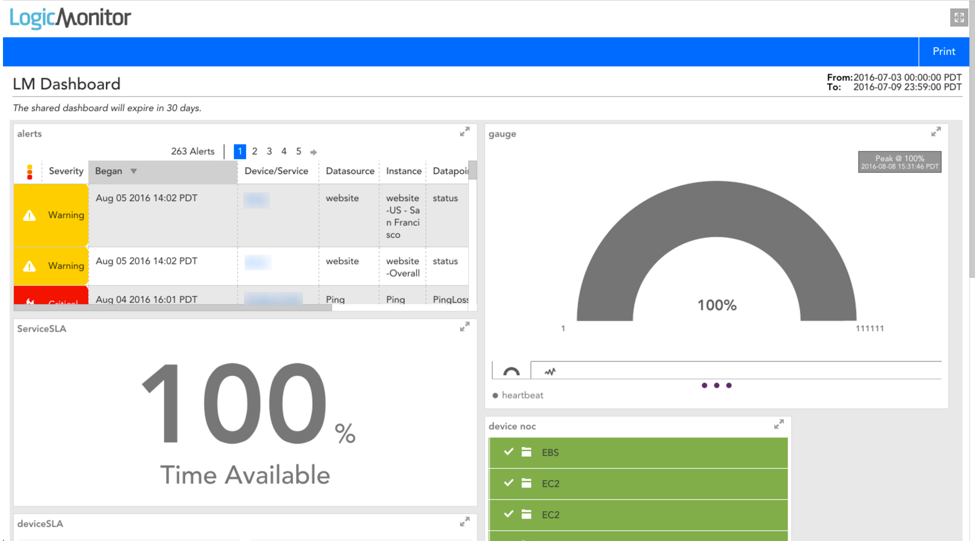
The long-awaited Dashboard Sharing has arrived. After configuring your Dashboard’s view to display a specific time range, you can share the Dashboard via email as a linked webpage. This is particularly useful for generating a snapshot report of your infrastructure’s overall status.
PagerDuty Integration
The PagerDuty integration is bidirectional! Users can now add an extension to their PagerDuty integration to acknowledge LogicMonitor alerts directly from PagerDuty’s platform. Learn more about setting-up your extension.
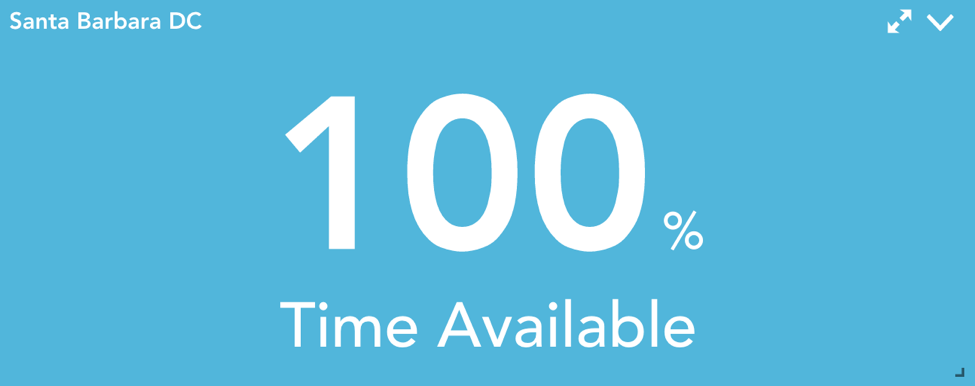
New SLA Widget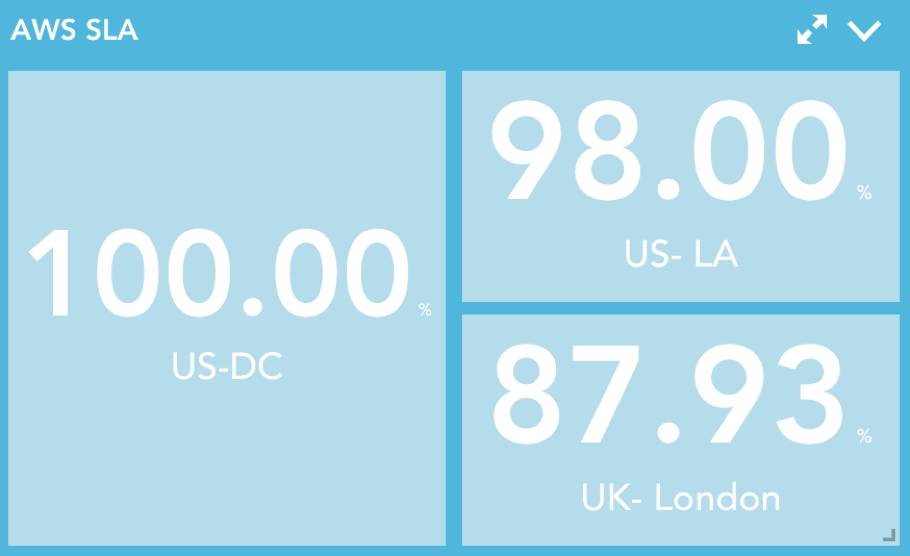
Many of our users are probably familiar with our Services SLA Widget, which allows you to display the availability of a monitored service. We have extended this widget to accommodate device (or application) SLAs, providing availability of a specific metric or the sum availability of multiple metrics.
REST API: Devices
We have published a whole new set of REST API resources to add, get, update, and delete devices. See our detailed documentation for more information.
Other Improvements:
Dashboards and Widgets:
- Alert Forecasting training data and severity levels are now set globally within the Table Widget rather than per datapoint.
- Individual Status Widget now supports Internal Service Checks.
- More configuration options (datapoint type, legend, and line color) have been included in the Custom Widget configuration table.
- SDT status will now be displayed in the NOC widget, even when the device in SDT does not have any alerts.
Devices:
- Cleaned up SDT History display to make the tables more legible.
- We now allow users to configure the number of graph columns in Device Dashboards. Selecting one of the following icons will display all device graphs in one, two, or three columns:

- Improved performance when adding large number of items into the Device Tree.
- Our Instance Level Properties, published last release, have been extended to SNMP Active Discovery.
- Standardized the filters available for unmonitored Netscan devices and added Search Anything functionality to search across all columns in the table.
Netscan:
- AWS (EC2) Netscan includes option to exclude devices that were previously discovered, assigned to specific collectors, or members of specific groups.
- Ability to configure device name based on static text and tags is available in AWS (EC2) Netscan.
- Auto-delete devices based on length of time they have been reported as dead is available in AWS (EC2) Netscan.
- When adding a Netscan Policy, users can now upload their script-based policy via CSV. This will auto-generate the script and allows users to easily add devices based on Excel, CSV, or other previously compiled lists.
Reporting:
- We have introduced a new Custom Report macro that displays the current time. This is used to dynamically timestamp when the reports are generated.
- Graphs can be added to Custom Reports using their unique widget ID.
Services:
- Changed the Services configuration page to only display alert triggering threshold options relevant to the selected Service (Web Service, Ping Service, Internal Service Check, or Internal Ping Check).
- The “Use Defaults” checkbox in Internal Services Checkpoints will only be clickable if Collectors/Sitemonitors have been selected as default configurations.
Settings:
- The Audit Log now records when AWS devices are auto-deleted (e.g. in response to a user unchecking an entire AWS region/service)
- We improved Audit Log records to reflect when the REST API is used to make changes. The Audit Log will record both the username and API access ID used to make the API request.
- Added a new Discovery Type, only-value, to SNMP Active Discovery.
Minor Improvements:
- Internal Service Check has been renamed as Internal Ping Service and Internal Web Service.
- Improved error message displayed when saving/cloning widgets that have an invalid character in a datapoint name.
- We extended the new LogicMonitor branding released in v.78 to our mobile application. You will notice new color schemes and a few adjustments to mobile icons.
Bugs Fixed
Alerts:
- Alert comments longer than 2048 character were not saved. We no longer limit the comments’ character length, however we will only display the first 2048 characters.
Dashboards and Widgets:
- Batchjob widgets with custom time ranges were not displaying data correctly.
- Users were unable to delete their private dashboards.
- Sorting option, “In Alert,” did not function correctly when adding a widget to a device dashboard.
Services:
- ConnectWise service properties were not being applie
d correctly. - Overview Graphs for Internal Service Checks weren’t displaying any data if one of the associated Collectors were down. We now display data for all available Collectors.
Settings:
- AWS Netscan Policies were not saving without being assigned to a group.
- Batchjob executions returning an stdout of more than 8000 characters were resulting in an error. We no longer limit the sdtout length, but will only display the first 8000 characters.
- The ##START## token in Collector Down Alerts was not correctly populated with the time a Collector went down.
- Disabling an Eventsource for one group was effectively disabling the Eventsource for all device groups. This has been corrected.
Minor Bug Fixes:
- Fixed bug in which dropdown arrow icons overlay text in the UI.
Other Releases:
Cloud Metric Collection
- Updates to discovery of Elasticache Memcached devices.
- AWS rejects requests for more than 20 Elastic Load Balancers (ELBs) at a time, we now schedule these requests to provide metrics for all ELBs.
SiteMonitor
NOTE: SiteMonitor upgrades will be applied to the San Francisco testing location the week of August 1st. All following locations will be upgraded the week of August 8th.
- Upgrade to JDK 8, which removes support for RC-4 ciphers. This will cause any services that cannot connect to a website via a modern browser to fail.
- Improved how traceroute is run when multiple services associated with the same IP are unavailable, decreasing unnecessary traffic.
- Fixed a bug where a service would return an unexpected status and wait for the full page load timeout to return an error.
