Release Note


-
LogicMonitor Platform
- Introduction to LogicMonitor
- In-App Resources
-
Account Information
- Portal Information
- Portal Settings
- Financial
-
Usage Reporting
- Usage Reporting Overview
-
Product-Specific Usage Reporting
- Usage Reporting for APM Metrics
- Usage Reporting for LM Logs
- Usage Reporting for SaaS Monitoring
- Usage Reporting for IaaS Monitoring
- Usage Reporting for PaaS Monitoring
- Usage Reporting for APM Traces
- Usage Reporting for APM Synthetics
- Usage Reporting for Devices
- Usage Reporting for Websites
- Usage Reporting for Wireless Access Points
- Audit Logs
- Ops Notes
- Security Settings
- User Access
- Collectors
-
Dashboards
- Dashboards Overview
- Dashboard Creation
- Modern Dashboards
- Adding Dashboard Groups
- Finding Dashboards and Dashboard Groups
-
Widgets
- Widgets Overview
- Widgets Creation
- Widget Datapoint Configurations
-
Widget Types
- Alert List Widget
- Big Number Widget
- Netflow Widget
- NOC Widget
- Log Query Widget
- Pie Chart Widget
- Table Widget
- Text Widget
- Website Status Widget
- Custom Graph Widget
- SLA Widget
- Topology Map Widget
- Gauge Widget
- HTML Widget
- Job Monitor Widget
- Map Widget
- Resource Explorer Widget
- Recommendations Widget
- Billing Widget
- Widget Management
- Standard Widget Configurations
- Enabling Dashboard Text Widget Script Security
- Dashboard Management
- Dashboard Distribution
-
Resource Tree
- Navigating the Resources Page
- Changing the Time Range
- Remote Session
- Using Ops Notes
- Resources Details
- Resource Groups
- Resource Management
- NetScans
- Resource Explorer
- Services
- LM Uptime Overview
-
Websites
- Data Monitored for Websites
- Websites Page Overview
- Alerting on Websites Data
- Trace Route for Websites
-
Websites Management
- Websites Default Settings
- Web Check
- Ping Check
- Testing the Steps of a Web Check
- Creating a Website Dashboard
- Website Properties
- Website Management
- Executing Internal Web Checks using Groovy Scripts
- Web Checks with Form-Based Authentication
- Websites SDT
- Disabling External Website Testing Location Across your Account
- Understanding Website Status Codes
- Websites Groups
- Mappings
- Alerts
-
Reports
- Choosing a Report Type
- Creating a Report Group
- Shared Report Access
-
Report Types
- Alert Forecast Report
- Alert SLA Report
- Alert HealthCheck Report
- Alert Thresholds Report
- Alert Trends Report
- Alerts Report
- Audit Log Report
- Dashboard Report
- Interface Bandwidth Report
- Log Query Report
- NetFlow Resource Metric Report
- Resource Group Inventory Report
- Resource Inventory Report
- Resource Metric Trends Report
- Role Report
- SDT Inventory Report
- Server CPU Report
- Service Level Agreement Report
- User Report
- Website Overview Report
-
Modules
- Modules Overview
- Modules Installation
- Custom Module Creation
- Tokens Available in LogicModule Alert Messages
- Deprecated LogicModules
- Data Collection Methods
- Active Discovery
- Groovy Support
-
Module Configurations
- Types of Modules
- DataSource
- PropertySource
- AppliesTo
- SNMP SysOID Map Configuration
- JobMonitor
- ConfigSource
- TopologySource
- EventSource
-
LogSource
- LogSource Overview
- Configuring a LogSource
- Kubernetes Event Logging LogSource Configuration
- Kubernetes Pods LogSource Configuration
- Log Files LogSource Configuration
- Script Logs LogSource Configuration
- SNMP Traps LogSource Configuration
- Supported MIBs for SNMP Trap Translation
- SNMP Trap MIBs
- Troubleshooting MIBs to JSON Converter Utility Issues
- Troubleshooting SNMP Traps Issues
- Modules Management
- Access Groups for Modules
- Security
-
LM Logs
- LM Logs Overview
- Log Ingestion
- Log Processing
- Logs Partition
- Log Anomaly Detection
- Log Analysis
- Viewing Logs and Log Anomalies
- Reset Log Anomaly Detection
- Log Patterns
- Log Query Language
- Log Processing Pipelines
- Log Alert Conditions
- Logs Roles and Permissions
- LM Logs Usage Data
- Troubleshooting Logs
-
Cloud Monitoring
- Introduction to Cloud Monitoring
- Cloud Services and Resource Units
- Monitored Locations for Cloud Monitoring
- Cloud Monitoring using a Collector for Existing Cloud Resources
- Monitoring Utilized Cloud Service Limits
- Custom Event Integrations Setup
-
Amazon Web Services Monitoring
- AWS Monitoring Setup
- AWS Organizational Unit Monitoring Setup
- Using StackSets to Automate Role and Policy Creation
- AWS Billing Monitoring Setup
- CloudWatch Costs Associated with Monitoring
- Managing your AWS devices in LogicMonitor
- AWS Tag Usage in LogicMonitor
- AWS Cost by Tag Monitoring
- Active Discovery and AWS CloudWatch Metrics
- Customizing AWS CloudWatch DataSources
- Troubleshooting Custom AWS CloudWatch DataSources
- Microsoft Azure Monitoring
- Google Cloud Platform Monitoring
- MongoDB Atlas Monitoring
- Cost Optimization
- Cloud Data Collection with Poll Now
- SaaS Monitoring
-
Edwin AI
- Introduction to Edwin AI
- Key Concepts in Edwin AI
- Edwin AI Roles and Users
- Configure Edwin AI Dashboard
- Edwin AI Models
- Configure Edwin AI Actions
- Edwin AI Rules
- Working with Edwin AI
- Export and Import Edwin AI Configuration
-
Edwin AI Integrations
- Edwin AI Integrations Overview
- Edwin AI Integration YAML File
- Edwin AI Custom Integrations
- Edwin AI Monitoring Integrations
-
Edwin AI IT Service Management Integrations
- LogicMonitor Data Exchange (LMDX)
- Edwin AI Microsoft Dynamics Integration
- Edwin AI PagerDuty Integration
- Edwin AI Jira Server Integration
-
LM Integrations
- LogicMonitor Integrations Overview
- Navigating the Integration Page
- Communications Integrations
- Workflow Integrations
- Automation Integrations
- Custom Integrations for LogicMonitor
- Logs for LM Integrations
-
Container Monitoring
- About LogicMonitor Container Monitoring
-
Kubernetes Monitoring
- Support Matrix for Kubernetes Monitoring
- Kubernetes and LM Containers Key Concepts and Terms
- Kubernetes Monitoring Considerations and Required Permissions
- Resource Sizing for Performance Optimization and Tuning Recommendations
- LM Container Installation
- LM Container Upgrade
- LM Container Uninstallation
- Existing Configuration Migration
- Kubernetes Events and Pod Logs Collection
-
Resource Monitoring
- Monitoring Helm Charts Releases
- Kubernetes Core Components Monitoring
- Monitoring Kubernetes Clusters with kube-state-metrics
- Filtering Kubernetes Resources for Monitoring
- NGINX Ingress Controller Monitoring
- Kubernetes Certificates and cert-manager Monitoring
- Disabling Alerts on Kubernetes Resources
- Default Filtering for Kubernetes Resources
- Filtering Kubernetes Resources using Labels, Annotations, and Selectors
- Disabling Resources from Monitoring
- Retention of Deleted Kubernetes Resources using LM Containers
- Retaining Deleted Kubernetes Resources
- Advanced Configuration
- Monitor Supported Resources
- Topology for Kubernetes Cluster
- Kubernetes Cluster Monitoring as Non-Admin User
- Troubleshooting Kubernetes Monitoring
- Docker Monitoring
-
LM APM
- LM APM Overview
- Quick Steps to Setup LogicMonitor APM
-
Push Metrics
- Getting Started with Push Metrics
- Use Cases for Push Metrics
- About the Push Metrics REST API
- Ingesting Metrics with the Push Metrics REST API
- Python SDK for Push Metrics API
- .NET SDK for Push Metrics API
- Managing Resources that Ingest Push Metrics
- Rate Limiting for Push Metrics
- Updating Instance Properties with the Push Metrics REST API
- Updating Resource Properties with the Push Metrics REST API
- OpenMetrics Integration
-
Distributed Tracing
- Distributed Tracing Overview
- Application Authentication Overview
- Traces Page
- Application Instrumentation for LogicMonitor
- Trace Data Forwarding to LogicMonitor
- OpenTelemetry Collector for LogicMonitor Overview
- Synthetics
-
Monitoring Solutions
- Apache
- APC
- AI Monitoring
- Atlassian
- AWS
- Azure
- Broadcom
- Cato Networks
- Checkpoint
-
Cisco
- Cisco APIC Monitoring
- Cisco ASA/ASR
- Cisco Catalyst Center
- Cisco Catalyst SD-WAN Monitoring
- Cisco CUCM API Monitoring
- Cisco Device SNMP and NTP Configuration
- Cisco Firepower Chassis Manager Monitoring
- Cisco Firepower Threat Defense Monitoring
- Cisco Hyperflex Monitoring
- Cisco Intersight Monitoring
- Cisco IP SLA Monitoring
- Cisco ISE Monitoring
- Cisco Meraki Monitoring
- Cisco UCCX Monitoring
- Cisco UCS Monitoring
- Cisco UCS X Monitoring
- Cisco Unified Call Manager (CUCM) Monitoring
- Cisco VoIP Monitoring
- Cisco Wireless Monitoring
- Citrix
- Cohesity
- Common Config
- CommVault
- ConnectWise
- Couchbase Server
- Dell Technologies
- Email Service
- Extreme Networks
- F5
- FreeBSD
- Fortinet
- HPE
- IBM
- IMPI
- Infinidat
- Infoblox
- Java
- Jenkins
- Juniper
- Kemp
- Kubernetes
- Linux
- LogicMonitor
- LSI MegaRAID Controller
- Microsoft
- MongoDB
- NetApp
- Network Traffic Monitoring
- NTP
- Nutanix Systems
- OpenAI
- Oracle
- Palo Alto Networks
- Panzura
- Perfmon Access
- Pick
- Puppet
- Pure Storage
- Quantum
- RabbitMQ
- Redis
- Rubrik
- Ruckus
- SAP
- Slack
- SSL
- SNMP
- Sonicwall
- SumoLogic
- SwiftStack
- Ubiquiti
- Unomaly
- Varnish
- Veeam
- Versa SD-WAN
- Mobile
-
Developer
-
LogicMonitor REST API
-
REST API Overview
- Using LogicMonitor's REST API
- Migration to LogicMonitor REST API v3
- REST API Change Log
- REST API Authentication
- REST API Status Codes
- REST API Error Codes
- REST API Rate Limit
- REST API Troubleshooting
-
REST API v3
- REST API v3 Swagger Documentation
- LogicMonitor v3 SDK
- REST API Basic Filters
- REST API Advanced Filters
- Creating Services Using LogicMonitor REST API v3
- Delta Support for device/devices API
- Best Practices for Migrating to LogicMonitor v3 SDK
-
REST API v3 Endpoints
- Managing Alerts
- Managing Alert Rules
- Managing Cost Optimization Recommendations
- Managing Recipient Groups
- Managing Roles
- Managing Ops Notes
- Managing Report Groups
- Managing Dashboard Groups
- Managing Collector Groups
- Managing ConfigSources
- Managing EventSources
- Managing Collector Debug Command
- Managing Collector Version
- Managing NetScan
- Managing PropertySources
- Viewing Metrics
- Viewing Integration Audit Logs
- Viewing External APIs
- Managing AppliesToFunction
- Managing Devices
- Managing DataSources
- Managing Escalation Chains
- Managing API Tokens
- Managing DataSource Instances
- Managing Dashboards
- Managing Users
- Managing Audit Logs
- Managing Data
- Managing Access Group
- Managing OIDs
- Managing Device Groups
- REST API v2
-
REST API v1
- REST API v1 Overview
- Getting Data with the REST API
-
REST API v1 Endpoints
- Managing Alert Rules
- Managing Alerts
- Managing API Tokens
- Accessing Audit Logs
- Managing Collectors
- Managing Collector Groups
- Managing Dashboards and Widgets
- Managing Dashboard Groups
- Managing DataSources
- Managing DataSource Instances
- Managing Devices
-
Managing Device Groups
- About the Device Group Resource
- Add a Device Group
- Add Device Group Properties
- AWS Device Groups
- Azure Device Groups
- Delete Device Group Properties
- Delete a Device Group
- GCP Device Groups
- Get all alerts for a Device Group
- Get all SDTs for a Device Group
- Get Device Group Properties
- Get Device Groups
- Get devices for a particular device group
- Update a Device Group
- Update Device Group Properties
- Managing Escalation Chains
- Managing Ops Notes
- Managing Reports
- Managing Report Groups
- Managing Roles
- Managing SDTs
- Managing Websites
- Managing Website Groups
- Getting Websites Test Locations
- Managing Thresholds
- Managing Users
-
REST API Overview
- Scripting Support
- HAR File in LogicMonitor
-
LogicMonitor REST API
- Policies and Compliance
- Training and Education
-
Legacy UI
- Getting Started
- Devices
- Dashboards and Widgets
- AIOps
- LM Service Insights
- LogicModules
- Terminology and Syntax
- LM APM
-
Cloud Monitoring
-
Getting Started with LM Cloud
- LM Cloud Monitoring Overview
- Enabling Cloud Monitoring using Local Collector
- Visualizing your cloud environment with auto dashboards and reports
- Setting up custom event integrations
- Monitoring Cloud Service Limit Utilization
- Optimizing your Cloud Spend
- Cloud Data Collection
- Amazon Web Services Monitoring
- Google Cloud Platform Monitoring
- MongoDB Atlas Monitoring
-
Getting Started with LM Cloud
- Container Monitoring
- Monitoring Solutions
In this article
We have been making many changes and promises, asking you to be patient for features right around the corner. With 2015, the time has come! Along with ongoing performance and functionality improvements, we’re very excited to announce the full beta release of the New UI and Network Traffic (formerly Netflow). Stay tuned as this is just the beginning.
New UI – Full Beta Release
The Devices and Settings sections round out the full beta release of the New UI. It’s worth a scan of the [intlink id=”17245″ type=”page”]documentation[/intlink], particularly as the Devices section brings many changes.
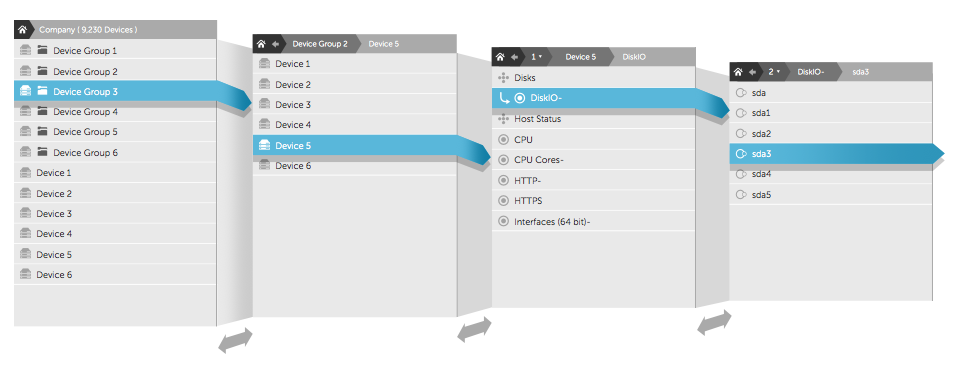
Although they may take some adjustment, you will find many efficiencies have been introduced . We’re working on the polish, but don’t hesitate to submit feedback to the LogicMonitor support team by emailing [email protected] or via the ‘Chat with engineer’ button in your LogicMonitor account.
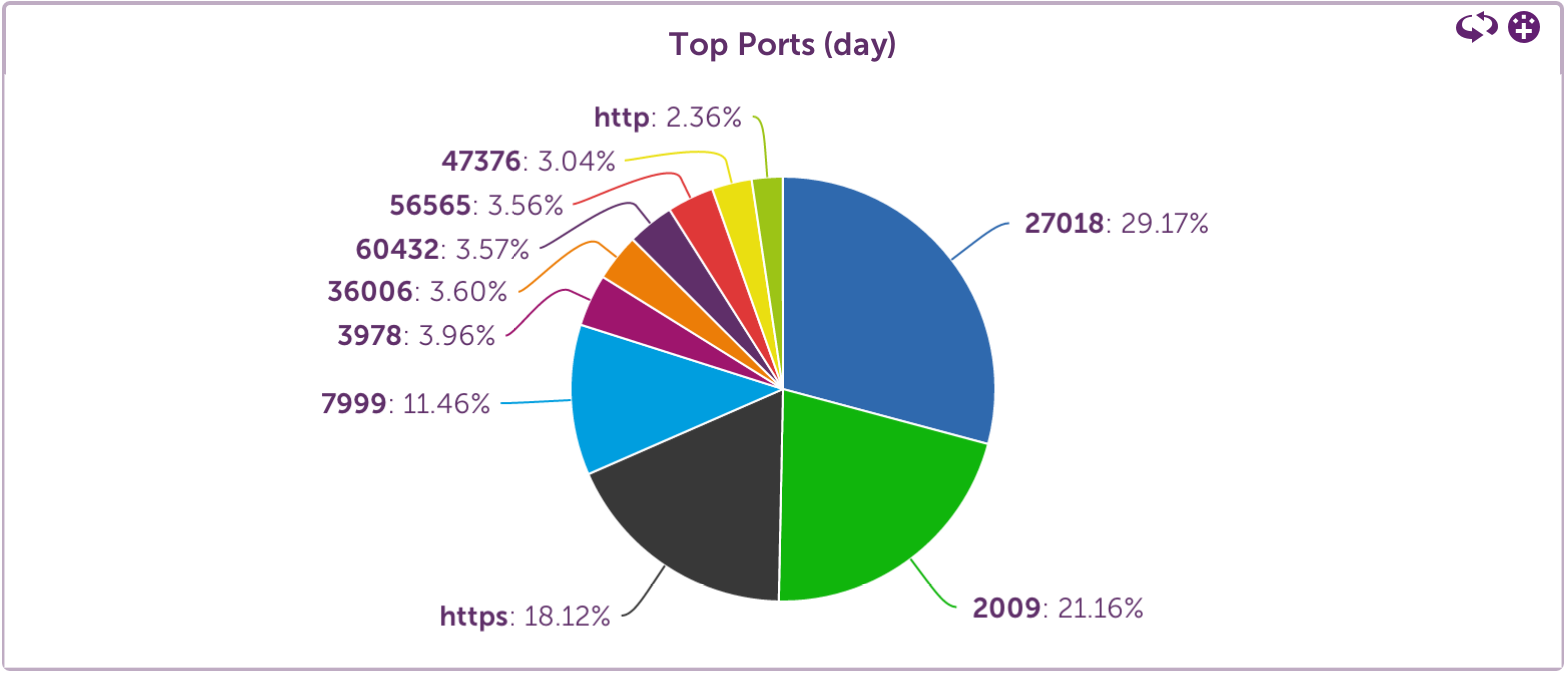
The full beta release also allows us to get the new [intlink id=”17423″ type=”page”]network traffic functionality[/intlink] into your hands.
Everything we’ve promised – pie charts, filtering, issue research, is available in the traffic tab. Give it a try and tell us what you think.
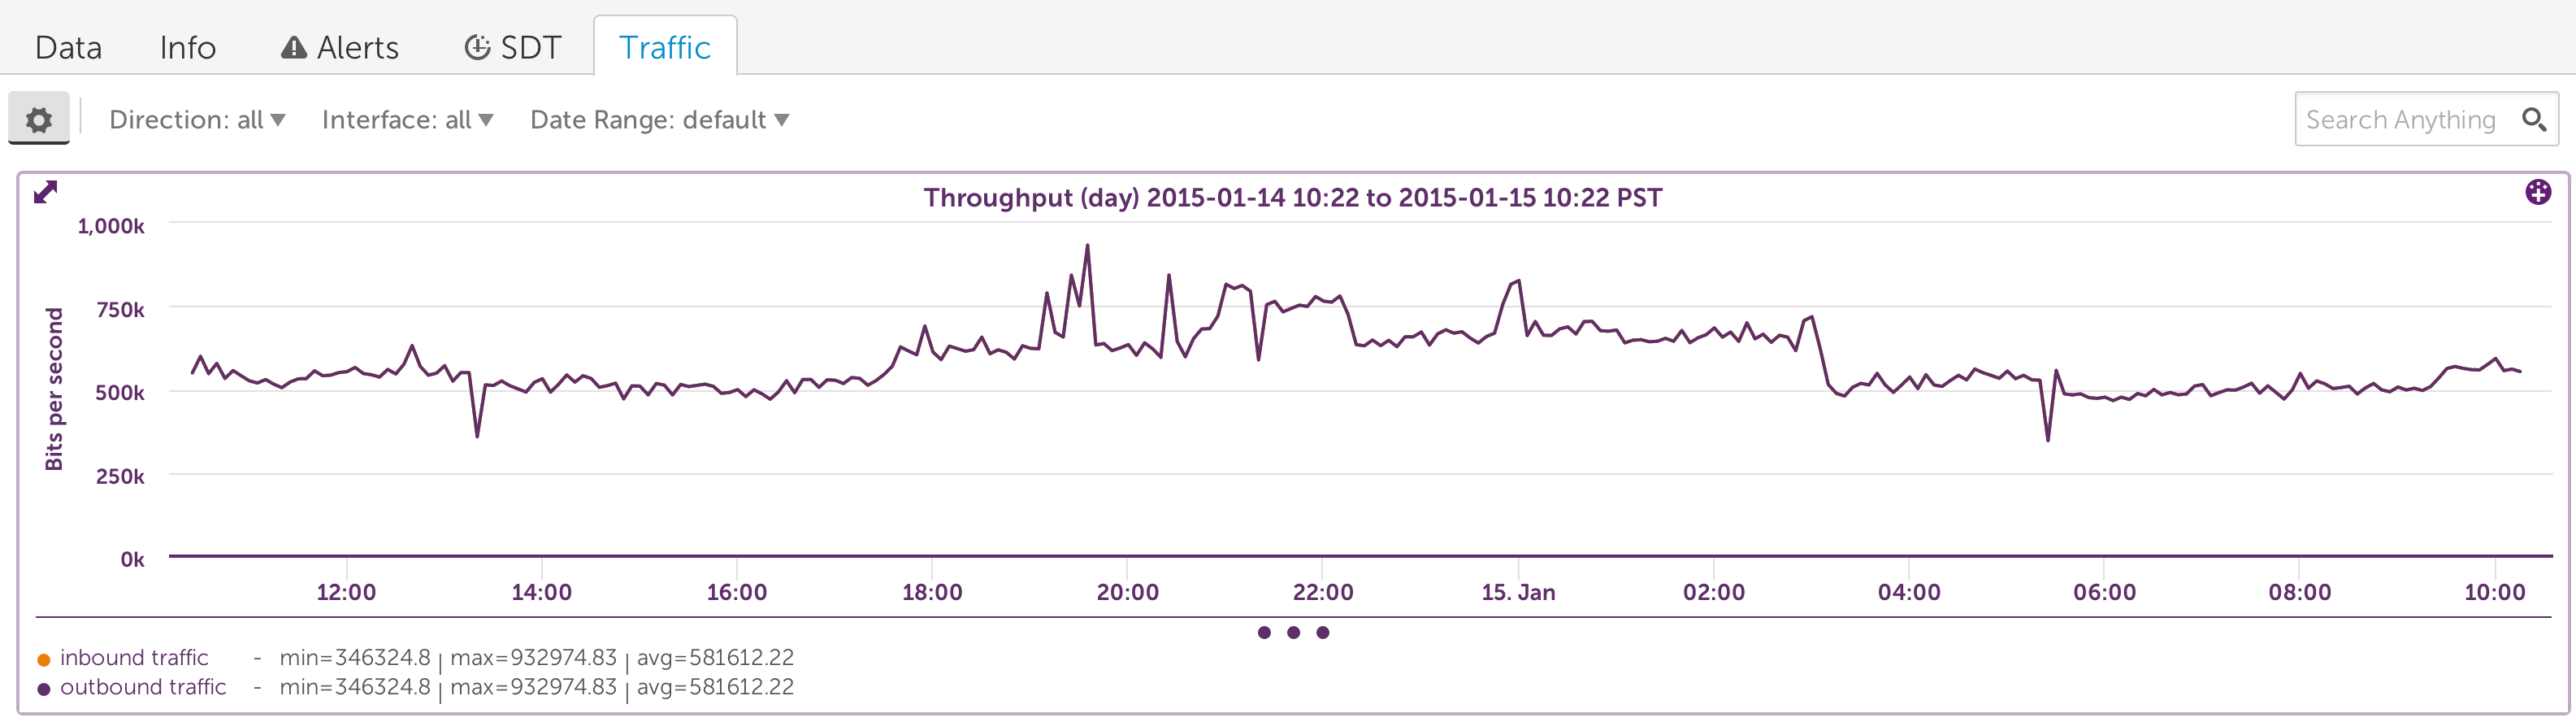
Improvements
- Unanswered voice call alerts now wait for voice mail prompts, to allow for complete message recording.
- Updates to device properties are now fully logged in the Audit Log, including the property changes and type of change.
- Support for ‘system.description’ as a variable reference within an ‘Applies To’ function.
- Support new ‘##POLLINTERVAL##’ token in complex datapoint or user-defined script expression fields (see tokens available for additional details).
Bugs resolved
- Fixed the Import function on datasources to update the collector type where required.
- Audit log now includes user logins from Single Sign On (SAML).
- Correctly handle Windows External Script datasource with ” in pathname
- Updated the getGraphImage() API call to be consistent with the UI image for area type graphs.
- Correctly handle Script datasource with multiple command-line arguments (previously, only the first argument was passed).
- SiteMonitor alerts for individual locations were generated but not escalated when suppress individual location alerts was enabled. No individual alerts will be visible in the UI if suppress alerts is selected.
- Fixed Interface Bandwidth report to exclude interfaces with monitoring disabled.
- Support for large Host Metric Trend reports: if the number of instances exceeds the maximum supported in a real time report, the report will be emailed.
- Fixed alert messages messages that contain special characters such as ‘∞’, which were previously truncated for some customers
- Fixed an issue with changing thresholds on instances whose names contained special characters.
- Corrected an issue with the Alert Report listing an incorrect rule in some situations
- Corrected an issue that prevented parenthesis being used in Datasource names since the last release.
- SiteMonitor alerts were incorrectly being matched to alert routing rules regardless of the value of the rule’s datapoint field.