v.84 Release: Graph Improvements, Alert Sounds, and more
Last updated on 14 September, 2022We are kicking off 2017 with an exciting release. v.84 will be rolled-out through the third week of January and includes an overhauled graph design as well as several nifty new features, such as Dashboard Subgroups and Alert sounds.
Graph Improvements: 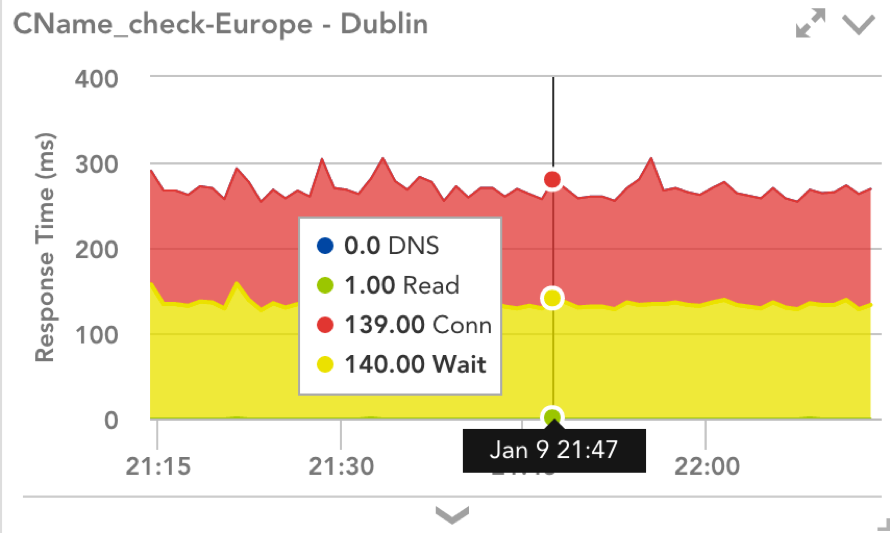
We made a ton of changes to our device and dashboard graphs’ behavior, which amounts to a huge advancement in their performance, legibility, and functionality. Among these improvements, you will notice the ability to:
- simultaneously display the names and values of multiple datapoints in a single graph using multi-line hover
- apply one graph’s modified time range to the rest of a dashboard or device page. This is especially useful if you are drilling down into a single graph for issue remediation and would like to compare it to other events during the same time period.
- set the legend to either deselect or isolate graph lines.
- use a search field within each graph to quickly find a desired graph line.
- preserve graph settings (ie. time range and line isolation) when a page is refreshed
- correlate events across multiple graphs using corresponding hover lines.
Alert Sounds
The wait is over for Alert sounds! If you display the LogicMonitor Alerts page on a NOC screen or keep watch on it from a tab on your computer, you can now configure a sound to play when you receive a critical, error, or warning alert. These sounds are set individually for each alert severity level. As of this release, these sounds will only play from the Alerts page, but we will add similar functionality to the Alert Widget soon.
We now allow dashboard subgroups. These are particularly useful if:
- you want to give individual departments access to a general Dashboard Group which contains further subgroups, each dedicated to an application.
- you’re a managed service provider and you want to grant each customer access to their own general Dashboard Group while retaining the ability to restrict viewing rights for different teams via subgroups.
Please note that in v.84, many of our LogicModules will either be renamed or stylized differently. You can expect the following changes:
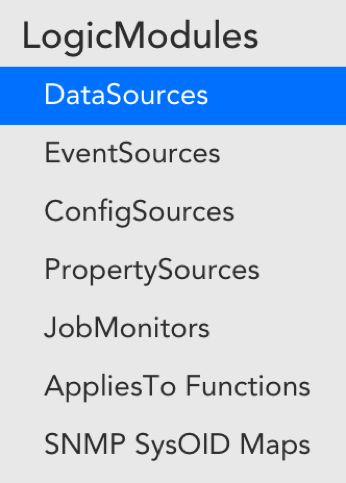
- Datasources – DataSources
- Eventsources – EventSources
- Configsources – ConfigSources
- Property Rules – PropertySources
- Batchjobs – JobMonitors
- Functions – AppliesTo Functions
- OIDs- SNMP SysOID Maps
Make sure to visit our new Status Page where you can find the operational status of LogicMonitor systems, as well as service updates.
Other Improvements
Alerts
- Instance level properties are now supported in the Alert Table custom column.
Collector
- We have improved how we display devices associated with a Collector. Specifically, we added an option to include/exclude cloud devices, added icons to easily distinguish a cloud device from a normal device, and improved the Netflow column’s layout.
Dashboards
- Favorite Dashboards and Private Dashboards now display in alphabetical order.
- Expanded graphs will not auto-refresh. This helps preserve line isolation and ensures the header time range matches the displayed data.
Devices
- Raw Data displayed for Devices (and Services) now respects the overall selected time range. Additionally, we will paginate the data with 25 data rows per page, for up to 500 rows. To view data outside the range covered by these 500 rows, you can change the time range or use our REST API.
- The add device wizard now uses the same duplicate logic checking as the expert mode and Netscan, allowing for the same IP to be added as long as the IP – Collector combination is unique.
- Removed custom property name restrictions imposed in v83
- Simplified the “Delete Device” dialog. It now only displays options available to the specific user and device.
DataSources
- From Settings | DataSources, DataSource graphs will display in the tree based on priority order.
- We have turned off autocomplete for the JDBC Collector Attributes fields.
- Changes to DataSource graphs are now recorded in the Audit Log. Additionally, the users that make changes will now be prompted to specify reason for the update, which goes into the DataSource history.
EventSources:
- Added support for an effectiveInterval option for script EventSources. If effectiveInterval is specified for a script event, it will override the effective alert interval configured in its EventSource definition. This enables you to set a different alert interval per event.
- The windows event log filters ‘Exist’ and ‘NotExist’ evaluate whether the event type exists. As a result, the value will always be ‘*’.
Mobile
- Added Settings page to the Mobile login..
- Favorite Dashboards can now be added and displayed via mobile.
PropertySources
- PropertySources can now be used to append values to the system.categories property. If you set a value for the system.category property via a PropertySource, auto. will not be prepended and the value will be added to the list of existing system.categories. This is very useful in extending the DataSource applies to functions.
REST API
- Updating AWS device groups via a REST API PUT request no longer requires the extra configuration object.
- internalId can now be used to acknowledge alerts via REST API
Settings
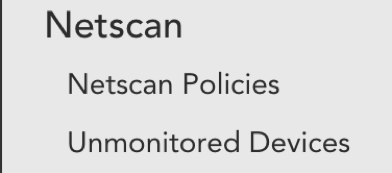
- A new “Unmonitored Devices” page has been added under Settings | Netscan. This page reflects the same information visible in “unmonitored devices” within the device tree. From this new page, you can see all discovered Netscan devices, even those that have previously been deleted.
- We have updated the Netflow Traffic tab to include “other” traffic when Top Talkers doesn’t comprise the top 95% of throughput. This new category bundles minor flows together to make up the top 95%.
- Added a confirmatio
n button when users try to delete any LogicModule. - The Forgot Password workflow has been improved to require users to sign-in after a password update. This also ensures two factor authentication settings are respected.
- Removed the “System Notification” option from role based access control. The functionality related to the permission setting is not currently active.
- Added support for Audit Log messages for recently published REST API resources. Specifically, the Audit Log will now show changes to roles, users, thresholds, SDTs, dashboard groups, dashboards, Collector groups, devices and device groups that are made via the REST API with LMv1 token authentication
- Search anything is available for integrations.
- API requests that failed because of authentication will now be shown in the Audit Log with the associated username or API Token.
Minor Improvements
- Added a field length limit to the eventID for Windows event log monitoring to avoid processing issues.
- We now display a warning when you try to delete functions referenced by a custom query in your account (e.g. dynamic group, DataSource, or device dashboard Applies To)
Bugs Fixed
Alerts
- The escalation chain interval was reset for Collector down alerts after a Collector restart.
- External alerting was not working well for alerts generating faster than once/minute. We have resolved this issue by improving the process for generating these alert notifications for external alerting.
Collector
- Collector device counts on the Settings page were sometimes incorrect because Netflow devices were counted twice if the preferred Collector was the same as the Netflow Collector.
Dashboards
- Fixed a bug that caused Netflow data to not display for some custom time ranges.
- Instance names that ended with a space were not always working well in custom graph widgets
- Dashboards did not support numeric only dashboard group names.
- In the widget configuration, changing a blank device resulted in all dependent fields to be cleared. Blank device names are now recognized as ”*” – or all – and dependent fields are only cleared if they do not match the new selection.
DataSources
- The DataSource tree was not updated correctly after adding a new DataSource graph.
Devices
- Not all AWS S3 instances were correctly auto-detected when a region was selected.
- Only the first 50 instance properties were displayed in the info panel.
Services
- Changed the DNS line type from area to stack for the Initial Connection Performance Services graph
- Internal Service checks with the character $ in the POST body (e.g. in a password) were failing for Collector versions greater than 22.180. This was due to the $ character not being escaped correctly by the Collector and was fixed in EA 22.253. With v.84, we have changed how the POST data is interpreted, specifically using single quotes instead of double quotes, which does not rely on the character being escaped.
- Adding instances manually for Windows processes / services via ‘Add other monitoring’ was sometimes timing-out for heavily loaded Collectors. We have improved how services and processes are requested to prevent this issue moving forwards.
Settings
- Refreshing the login page during the two factor authentication process resulted in a 500 error.