Release Note


-
LogicMonitor Platform
- Introduction to LogicMonitor
- In-App Resources
-
Account Information
- Portal Information
- Portal Settings
- Financial
-
Usage Reporting
- Usage Reporting Overview
-
Product-Specific Usage Reporting
- Usage Reporting for APM Metrics
- Usage Reporting for LM Logs
- Usage Reporting for LM Uptime
- Usage Reporting for SaaS Monitoring
- Usage Reporting for IaaS Monitoring
- Usage Reporting for PaaS Monitoring
- Usage Reporting for APM Traces
- Usage Reporting for APM Synthetics
- Usage Reporting for Devices
- Usage Reporting for Websites
- Usage Reporting for Wireless Access Points
- Audit Logs
- Ops Notes
- Security Settings
- User Access
- Collectors
-
Dashboards
- Dashboards Overview
- Dashboard Creation
- Modern Dashboards
- Adding Dashboard Groups
- Finding Dashboards and Dashboard Groups
-
Widgets
- Widgets Overview
- Widgets Creation
- Widget Datapoint Configurations
-
Widget Types
- Alert List Widget
- Big Number Widget
- Netflow Widget
- NOC Widget
- Log Query Widget
- Pie Chart Widget
- Table Widget
- Text Widget
- Website Status Widget
- Custom Graph Widget
- SLA Widget
- Topology Map Widget
- Gauge Widget
- HTML Widget
- Job Monitor Widget
- Map Widget
- Resource Explorer Widget
- Recommendations Widget
- Billing Widget
- Widget Management
- Standard Widget Configurations
- Enabling Dashboard Text Widget Script Security
- Dashboard Management
- Dashboard Distribution
-
Resource Tree
- Navigating the Resources Page
- Changing the Time Range
- Remote Session
- Using Ops Notes
- Resources Details
- Resource Groups
- Resource Management
- NetScans
- Resource Explorer
- Services
- LM Uptime
-
Websites
- Data Monitored for Websites
- Websites Page Overview
- Alerting on Websites Data
- Trace Route for Websites
-
Websites Management
- Websites Default Settings
- Web Check
- Ping Check
- Testing the Steps of a Web Check
- Creating a Website Dashboard
- Website Properties
- Website Management
- Executing Internal Web Checks using Groovy Scripts
- Web Checks with Form-Based Authentication
- Websites SDT
- Disabling External Website Testing Location Across your Account
- Understanding Website Status Codes
- Websites Groups
- Mappings
- Alerts
-
Reports
- Choosing a Report Type
- Creating a Report Group
- Shared Report Access
-
Report Types
- Alert Forecast Report
- Alert SLA Report
- Alert HealthCheck Report
- Alert Thresholds Report
- Alert Trends Report
- Alerts Report
- Audit Log Report
- Dashboard Report
- Interface Bandwidth Report
- Log Query Report
- NetFlow Resource Metric Report
- Resource Group Inventory Report
- Resource Inventory Report
- Resource Metric Trends Report
- Role Report
- SDT Inventory Report
- Server CPU Report
- Service Level Agreement Report
- User Report
- Website Overview Report
-
Modules
- Modules Overview
- Modules Installation
- Custom Module Creation
- Tokens Available in LogicModule Alert Messages
- Deprecated LogicModules
- Data Collection Methods
- Active Discovery
- Groovy Support
-
Module Configurations
- Types of Modules
- DataSource
- PropertySource
- AppliesTo
- SNMP SysOID Map Configuration
- JobMonitor
- ConfigSource
- TopologySource
- EventSource
-
LogSource
- LogSource Overview
- Configuring a LogSource
- Kubernetes Event Logging LogSource Configuration
- Kubernetes Pods LogSource Configuration
- Log Files LogSource Configuration
- Script Logs LogSource Configuration
- SNMP Traps LogSource Configuration
- Supported MIBs for SNMP Trap Translation
- SNMP Trap MIBs
- Troubleshooting MIBs to JSON Converter Utility Issues
- Troubleshooting SNMP Traps Issues
- Modules Management
- Access Groups for Modules
- Security
-
LM Logs
- LM Logs Overview
- Log Ingestion
- Log Processing
- Logs Partition
- Log Anomaly Detection
- Log Analysis
- Viewing Logs and Log Anomalies
- Reset Log Anomaly Detection
- Log Patterns
- Log Query Language
- Log Processing Pipelines
- Log Alert Conditions
- Logs Roles and Permissions
- LM Logs Usage Data
- Troubleshooting Logs
-
Cloud Monitoring
- Introduction to Cloud Monitoring
- Cloud Services and Resource Units
- Monitored Locations for Cloud Monitoring
- Cloud Monitoring using a Collector for Existing Cloud Resources
- Monitoring Utilized Cloud Service Limits
- Custom Event Integrations Setup
-
Amazon Web Services Monitoring
- AWS Monitoring Setup
- AWS Organizational Unit Monitoring Setup
- Using StackSets to Automate Role and Policy Creation
- AWS Billing Monitoring Setup
- CloudWatch Costs Associated with Monitoring
- Managing your AWS devices in LogicMonitor
- AWS Tag Usage in LogicMonitor
- AWS Cost by Tag Monitoring
- Active Discovery and AWS CloudWatch Metrics
- Customizing AWS CloudWatch DataSources
- Troubleshooting Custom AWS CloudWatch DataSources
- Microsoft Azure Monitoring
- Google Cloud Platform Monitoring
- MongoDB Atlas Monitoring
- Cost Optimization
- Cloud Data Collection with Poll Now
- SaaS Monitoring
-
Edwin AI
- Introduction to Edwin AI
- Key Concepts in Edwin AI
- Edwin AI Roles and Users
- Configure Edwin AI Dashboard
- Edwin AI Models
- Configure Edwin AI Actions
- Edwin AI Rules
- Working with Edwin AI
- Export and Import Edwin AI Configuration
-
Edwin AI Integrations
- Edwin AI Integrations Overview
- Edwin AI Integration YAML File
- Edwin AI Custom Integrations
- Edwin AI Monitoring Integrations
-
Edwin AI IT Service Management Integrations
- LogicMonitor Data Exchange (LMDX)
- Edwin AI Microsoft Dynamics Integration
- Edwin AI PagerDuty Integration
- Edwin AI Jira Server Integration
-
LM Integrations
- LogicMonitor Integrations Overview
- Navigating the Integration Page
- Communications Integrations
- Workflow Integrations
- Automation Integrations
- Custom Integrations for LogicMonitor
- Logs for LM Integrations
-
Container Monitoring
- About LogicMonitor Container Monitoring
-
Kubernetes Monitoring
- Support Matrix for Kubernetes Monitoring
- Kubernetes and LM Containers Key Concepts and Terms
- Kubernetes Monitoring Considerations and Required Permissions
- Resource Sizing for Performance Optimization and Tuning Recommendations
- LM Container Installation
- LM Container Upgrade
- LM Container Uninstallation
- Existing Configuration Migration
- Kubernetes Events and Pod Logs Collection
-
Resource Monitoring
- Monitoring Helm Charts Releases
- Kubernetes Core Components Monitoring
- Monitoring Kubernetes Clusters with kube-state-metrics
- Filtering Kubernetes Resources for Monitoring
- NGINX Ingress Controller Monitoring
- Kubernetes Certificates and cert-manager Monitoring
- Disabling Alerts on Kubernetes Resources
- Default Filtering for Kubernetes Resources
- Filtering Kubernetes Resources using Labels, Annotations, and Selectors
- Disabling Resources from Monitoring
- Retention of Deleted Kubernetes Resources using LM Containers
- Retaining Deleted Kubernetes Resources
- Advanced Configuration
- Monitor Supported Resources
- Topology for Kubernetes Cluster
- Kubernetes Cluster Monitoring as Non-Admin User
- Troubleshooting Kubernetes Monitoring
- Docker Monitoring
-
LM APM
- LM APM Overview
- Quick Steps to Setup LogicMonitor APM
-
Push Metrics
- Getting Started with Push Metrics
- Use Cases for Push Metrics
- About the Push Metrics REST API
- Ingesting Metrics with the Push Metrics REST API
- Python SDK for Push Metrics API
- .NET SDK for Push Metrics API
- Managing Resources that Ingest Push Metrics
- Rate Limiting for Push Metrics
- Updating Instance Properties with the Push Metrics REST API
- Updating Resource Properties with the Push Metrics REST API
- OpenMetrics Integration
-
Distributed Tracing
- Distributed Tracing Overview
- Application Authentication Overview
- Traces Page
- Application Instrumentation for LogicMonitor
- Trace Data Forwarding to LogicMonitor
- OpenTelemetry Collector for LogicMonitor Overview
- Synthetics
-
Monitoring Solutions
- Apache
- APC
- AI Monitoring
- Atlassian
- AWS
- Azure
- Broadcom
- Cato Networks
- Checkpoint
-
Cisco
- Cisco APIC Monitoring
- Cisco ASA/ASR
- Cisco Catalyst Center
- Cisco Catalyst SD-WAN Monitoring
- Cisco CUCM API Monitoring
- Cisco Device SNMP and NTP Configuration
- Cisco Firepower Chassis Manager Monitoring
- Cisco Firepower Threat Defense Monitoring
- Cisco Hyperflex Monitoring
- Cisco Intersight Monitoring
- Cisco IP SLA Monitoring
- Cisco ISE Monitoring
- Cisco Meraki Monitoring
- Cisco UCCX Monitoring
- Cisco UCS Monitoring
- Cisco UCS X Monitoring
- Cisco Unified Call Manager (CUCM) Monitoring
- Cisco VoIP Monitoring
- Cisco Wireless Monitoring
- Citrix
- Cohesity
- Common Config
- CommVault
- ConnectWise
- Couchbase Server
- Dell Technologies
- Email Service
- Extreme Networks
- F5
- FreeBSD
- Fortinet
- HPE
- IBM
- IMPI
- Infinidat
- Infoblox
- Java
- Jenkins
- Juniper
- Kemp
- Kubernetes
- Linux
- LogicMonitor
- LSI MegaRAID Controller
- Microsoft
- MongoDB
- NetApp
- Network Traffic Monitoring
- NTP
- Nutanix Systems
- OpenAI
- Oracle
- Palo Alto Networks
- Panzura
- Perfmon Access
- Pick
- Puppet
- Pure Storage
- Quantum
- RabbitMQ
- Redis
- Rubrik
- Ruckus
- SAP
- Slack
- SSL
- SNMP
- Sonicwall
- SumoLogic
- SwiftStack
- Ubiquiti
- Unomaly
- Varnish
- Veeam
- Versa SD-WAN
- Mobile
-
Developer
-
LogicMonitor REST API
-
REST API Overview
- Using LogicMonitor's REST API
- Migration to LogicMonitor REST API v3
- REST API Change Log
- REST API Authentication
- REST API Status Codes
- REST API Error Codes
- REST API Rate Limit
- REST API Troubleshooting
-
REST API v3
- REST API v3 Swagger Documentation
- LogicMonitor v3 SDK
- REST API Basic Filters
- REST API Advanced Filters
- Creating Services Using LogicMonitor REST API v3
- Delta Support for device/devices API
- Best Practices for Migrating to LogicMonitor v3 SDK
-
REST API v3 Endpoints
- Managing Alerts
- Managing Alert Rules
- Managing Cost Optimization Recommendations
- Managing Recipient Groups
- Managing Roles
- Managing Ops Notes
- Managing Report Groups
- Managing Dashboard Groups
- Managing Collector Groups
- Managing ConfigSources
- Managing EventSources
- Managing Collector Debug Command
- Managing Collector Version
- Managing NetScan
- Managing PropertySources
- Viewing Metrics
- Viewing Integration Audit Logs
- Viewing External APIs
- Managing AppliesToFunction
- Managing Devices
- Managing DataSources
- Managing Escalation Chains
- Managing API Tokens
- Managing DataSource Instances
- Managing Dashboards
- Managing Users
- Managing Audit Logs
- Managing Data
- Managing Access Group
- Managing OIDs
- Managing Device Groups
- REST API v2
-
REST API v1
- REST API v1 Overview
- Getting Data with the REST API
-
REST API v1 Endpoints
- Managing Alert Rules
- Managing Alerts
- Managing API Tokens
- Accessing Audit Logs
- Managing Collectors
- Managing Collector Groups
- Managing Dashboards and Widgets
- Managing Dashboard Groups
- Managing DataSources
- Managing DataSource Instances
- Managing Devices
-
Managing Device Groups
- About the Device Group Resource
- Add a Device Group
- Add Device Group Properties
- AWS Device Groups
- Azure Device Groups
- Delete Device Group Properties
- Delete a Device Group
- GCP Device Groups
- Get all alerts for a Device Group
- Get all SDTs for a Device Group
- Get Device Group Properties
- Get Device Groups
- Get devices for a particular device group
- Update a Device Group
- Update Device Group Properties
- Managing Escalation Chains
- Managing Ops Notes
- Managing Reports
- Managing Report Groups
- Managing Roles
- Managing SDTs
- Managing Websites
- Managing Website Groups
- Getting Websites Test Locations
- Managing Thresholds
- Managing Users
-
REST API Overview
- Scripting Support
- HAR File in LogicMonitor
-
LogicMonitor REST API
- Policies and Compliance
- Training and Education
-
Legacy UI
- Getting Started
- Devices
- Dashboards and Widgets
- AIOps
- LM Service Insights
- LogicModules
- Terminology and Syntax
- LM APM
-
Cloud Monitoring
-
Getting Started with LM Cloud
- LM Cloud Monitoring Overview
- Enabling Cloud Monitoring using Local Collector
- Visualizing your cloud environment with auto dashboards and reports
- Setting up custom event integrations
- Monitoring Cloud Service Limit Utilization
- Optimizing your Cloud Spend
- Cloud Data Collection
- Amazon Web Services Monitoring
- Google Cloud Platform Monitoring
- MongoDB Atlas Monitoring
-
Getting Started with LM Cloud
- Container Monitoring
- Monitoring Solutions
Rolling out through mid-May, LogicMonitor v.119 brings with it two exciting new features: Auto-Balanced Collector Groups and topology mapping. Read on for highlights of these new features, and details on other enhancements included in this v.119 release.
New Feature Highlight: Auto-Balanced Collector Groups
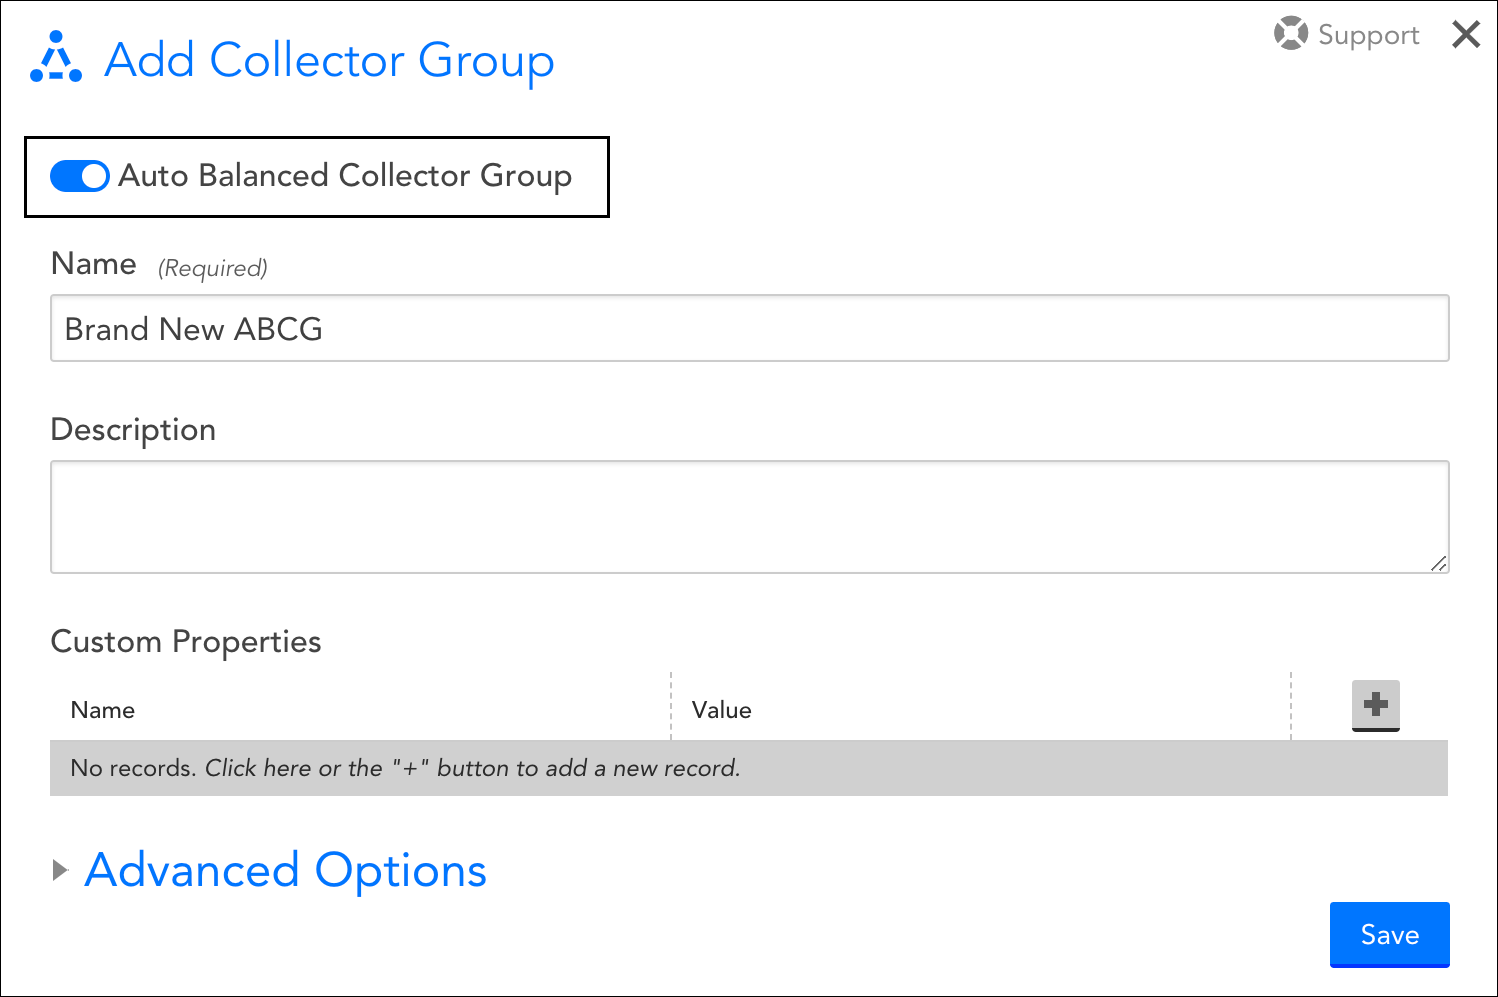
Get better device balancing, scaling, and failover with LogicMonitor’s brand new Auto-Balanced Collector Groups (ABCGs). An ABCG is a group of Collectors that share device load. ABCGs bring more efficient Collector management and monitoring through their ability to:
- Dynamically move devices from one Collector to another within the ABCG in order to prevent any individual Collector from becoming over-subscribed
- Equally distribute devices on a failed Collector to the remaining active Collectors in the ABCG
- Streamline device creation by simply assigning an ABCG and letting the ABCG decide which Collector will perform the monitoring
To learn more, see Auto-Balanced Collector Groups.
New Feature Highlight: Topology Mapping
A few days before the official rollout out of v.119 (on April 26 to be exact), we released topology mapping. Available to users of LogicMonitor Pro and Enterprise packages, LogicMonitor’s topology mapping allows you to visualize the logical relationships between elements in your network environment.
This additional context can be very beneficial to your monitoring operations, providing you with the ability to:
- Discover and map relationships between resources
- Generate topology maps based on alerts to streamline your troubleshooting workflow
- Navigate resources based on topology relationships
- Save relevant and frequently-used topology maps for monitoring continuity
Topology is auto-discovered by LogicMonitor! Once you’ve downloaded all necessary LogicModules, relationships are dynamically generated. To learn more, see Topology Mapping Overview.
Other v.119 Enhancements
Alerting
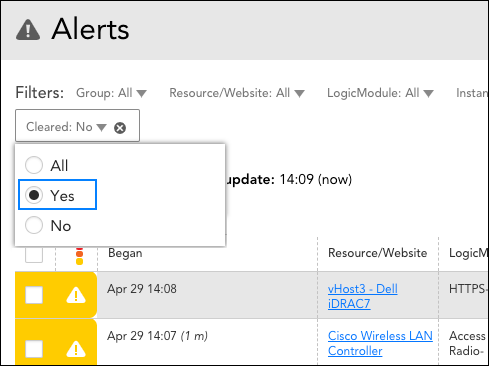
Cleared alerts only filtering. When filtering alerts on the Alerts page (or Alerts tab), you now have the ability to see only those alerts that have been cleared. This is accomplished by checking the new “Yes” option available for the Cleared filter. Previously, you could only see cleared alerts in addition to active alerts (the “All” option) or explicitly exclude cleared alerts (the “No” option).
LM Cloud
- Amazon Web Services (AWS) monitoring updates:
- Tag discovery filter for DynamoDB. Added a tag discovery filter for the AWS DynamoDB service. We will not be removing the previously implemented name filter; the new tag filter will be connected with a logical AND to the name filter. You may find this new tag filter useful for preventing DynamoDB tables from being discovered based on tags that already exist in your AWS environment.
- AWS DMS replication instances monitoring. Added discovery and monitoring support for AWS Database Migration Service (DMS) replication instances.
- Google Cloud Platform (GCP) monitoring updates:
- UI text update for clarity. A term used in the text of the Add and Manage cloud account dialogs for GCP was updated to eliminate confusion. The dialogs now indicate that automatic disablement of alerting is available for deleted instances. Previously, the dialogs used the term terminated which, in GCP terminology, implies a stopped state.
LM Container
- Improved warning for manual deletion of Kubernetes resources. Added a more helpful warning when users attempt to delete monitored Kubernetes resources that are auto-managed by Argus.
LM Service Insight
- Adding member graphs to dashboards. Service member (i.e. instance and device) graphs can now be added to dashboards as widgets directly from the Service’s Graphs tab. This new capability parallels that already in place for adding a resource’s graphs to dashboards. You may find this useful for quickly building dashboards for your Services.
REST API
- Cleared-only alerts retrieval. The LogicMonitor REST API supports the new “Yes” option (added in this release) for the Cleared filter. This new option retrieves only those alerts that have been cleared. It is referenced in the API as cleared:true.
Topology Mapping
- New debug commands. To support LogicMonitor’s brand new topology mapping capabilities, two new commands are now available in the Collector Debug Facility that allow users to debug issues related to the unintended existence of duplicate external resource IDs (ERIs):
- !erimergelist [threshold=xxx] – This command lists all ERI values that appear across resources/instances (or those that meet a designated threshold if specified)
- !erimergedetail <eriValue> – This command lists all the resources/instances bound to an ERI value
- Edge collapsing. When multiple edges connect two vertices, the default behavior is to collapse those edges into a single edge for cleaner viewing. A new Display all edges option allows you to override this default behavior on a per-map basis from the map’s settings. Alternately, right-clicking on a collapsed edge will also show all edges between two vertices.
- Capturing multiple vertices for dragging. In addition to dragging and dropping a single vertex into a new position within a topology map, you can now also move multiple vertices in a topology map at once. To do so, position the cursor in approximation to the desired vertices and hold down a left click until the cursor becomes a plus sign. Then, with the click still held, draw a box that encompasses all the vertices you would like to move. Click any one of the vertices that you drew a box over to drag all selected vertices to a new location.
LogicModule Releases
LogicModules that have been added or updated since the last release.
New Monitoring Coverage
- Cisco IPSec Tunnels – 1 DataSource
- The existing Cisco IPSec Tunnels DataSource has been deprecated and removed; this new module is named with a slight variance (Cisco_IPSec_Tunnels) so as to not accidentally overwrite existing DataSource
- Layer 2 Topology – 8 PropertySources, 2 TopologySources
- Supporting auto-discovery of topology mapping for Arista, Cisco, HP, Juniper, Linux, and Windows network components
- SwiftStack – 10 DataSources, 1 PropertySource
- Veeam Backup and Replication – 8 DataSources, 1 PropertySource
- VMware vCenter Server Appliance (VCSA) – 11 DataSources
- VMware vCenter Topology – 5 DataSources, 2 PropertySources, 1 TopologySource
- Supporting auto-discovery of topology mapping for VMware components
Monitoring Improvements
- addCategory OracleDB – 1 PropertySource
- Improved exception handling
- AWS EBS – 1 DataSource
- Minor fix to datapoint descriptions and alert messages
- AWS Network ELB & Network ELB Target Groups – 1 DataSource
- Removed alert thresholds on TCP ELB Reset datapoints due to unpredictable HealthCheckIntervalSeconds behavior
- Cisco CUCM Processes – 1 DataSource
- Added Cisco known bug report to tech notes field
- Cisco NXOS – 1 ConfigSource
- Increased ExpectJ timeouts which were preventing instance discover
- Cisco QoS – 1 DataSource
- AD script improvements to reduce execution times and timeouts
- Citrix XenApp DataStore Status – 1 DataSource
- Updated script to convert IP to FQDN to resolve connection failure issues within PowerShell
- Dell Networking – 1 ConfigSource
- Updated AppliesTo function to include Dell PowerConnect hosts
- GCP HTTP Load Balancer – 1 DataSource
- Fix applied to datapoint response code for HTTP 400 requests
- Host Resources Memory – 1 DataSource
- Added various datapoint descriptions; graph cleanup
- LogicMonitor Collector JVM Status – 1 DataSource
- Added datapoint to capture max heap memory; adjusted heap percent utilization complex datapoint calculation; updated alert message
- Microsoft SQL Server – 1 PropertySource
- Added timeout support for testing instances
- Microsoft SQLServer Databases – 1 DataSource
- Wildvalue improvements for appropriate special character and space handling
- NetApp Cluster Aggregate – 1 DataSource
- Corrected issue in collection script to address NetApp ONTAP API not accepting all UUIDs properly
- NetApp Cluster Logical Interfaces – 1 DataSource
- Corrected issue in collection script wildvalue assignment
- NetApp E-Series Dynamic Disk Pools and Volume Groups – 1 DataSource
- Corrected issue with AD script to ensure proper matching of multiple storage controller arrays on SANtricity Web Services Proxies (WSPs) with multiple storage systems registered
- NetSNMP Memory – 1 DataSource
- Improved complex datapoint calculation
- Nimble HDD Disks – 1 DataSource
- Improved exception handling in collection script
- Nutanix Virtual Machines – 1 DataSource
- Numerous improvements to AD and collection to properly capture and convert hex output to ASCII; script execution time improvements and graph cleanup
- Terminal Services – 1 DataSource
- Added virtual datapoint to adjust for existing console and service sessions already active; improved datapoint description
- VMware ESXi Datastore Performance – 1 DataSource
- Fixed issue in AD script to ensure correct wildvalue is accessed
- VMware Horizon Troubleshooter – 1 DataSource
- Improved troubleshooting instance discovery and alert messages
- VMware LM Troubleshooter – 1 DataSource
- Improved troubleshooting script execution and alert messages
- VMware Object Count – 1 DataSource
- Fixed null exception handling on VM counts
- VMware vCenter VM Performance – 1 DataSource
- Updated calculation for CPUReadyperVCPU datapoint to properly display average per vCPU
- VMware vCenter VM Snapshots – 1 DataSource
- Updated snapshot age label for graph from “Age” to “AgeInHours” for clarity
- VMware vSphere VM Status – 1 DataSource
- Corrected issue with heartbeat alerts and mapping status; various improvements to exception handling
- Windows WMI Access – 1 DataSource
- Provided additional support for WMI access troubleshooting codes