Release Note


v.132 Highlights:
- Feature Highlight: Graphs Included in Email Alerts
- Platform Enhancements: New AWS locations; glob expression support for Interface Bandwidth report
- New and Updated Monitoring Coverage: New out-of-the-box monitoring for Office 365 and a large number of AWS, Azure, and GCP cloud resources; significantly enhanced monitoring for Microsoft SQL Server
- Entering Beta: Integrations page
Feature Highlight: Graphs Included in Email Alerts
Alert notifications arriving via email now automatically include DataSource graphs for faster time to resolution. All graphs relevant to the instance and datapoint in alert will display at the end of the alert notification. These are the same graphs that are available when viewing the alert from the Alerts page (from the Graphs tab). All graphs will feature 60 minutes of data immediately preceding the alert.
Note: Graphs are only included in email alerts generated by DataSources; email alerts for monitored websites do not currently include graphs.
Platform Enhancements
Alerting
- Absolute delta% comparison calculation. The “absolute delta%” comparison method (available when setting thresholds for static datapoints) was being calculated incorrectly. the percent change was calculated against the new value, not the older value). This has been corrected.
- Failed escalations. In some cases, alerts escalated within one minute of triggering were failing to escalate. An error is now returned when this occurs so that escalation can be reattempted.
Alert Integrations
- ServiceNow (Incident Management) Integration. When configuring an alert integration for ServiceNow, entering a space character in the Company field (versus selecting from the auto-complete dropdown) caused an error. This has been corrected.
LM Cloud
- New AWS locations. Added support for AWS eu-west-3 and eu-north-1 locations. You can now select these locations and LogicMonitor will automatically discover and begin monitoring supported services in these regions.
- New property for EC2 instance IPs. A new property named system.aws.additionalPrivateIpAddresses is now available for storing multiple private IP addresses for EC2 instances. When applicable, this new property will be automatically populated by the Cloud Collector. You may find the data stored by this property useful (in conjunction with the cloud.primaryIP property) when customizing an IP for data collection.
- Improved naming for AWS MSK brokers. AWS MSK clusters recreated or resized with the same cluster name were not successfully rediscovering brokers. This was due to duplicate broker naming, which resulted in LogicMonitor seeing the new brokers as duplicates of the previous ones. To ensure successful broker discovery of recreated or resized clusters, MSK broker names now additionally include broker size to make names more unique and less easily duplicated.
Remote Session
- RDP session issues. Recurring issues for failed and dropped remote sessions using the RDP protocol have been resolved.
Reports
- New filtering for Interface Bandwidth report. The Interface Bandwidth report now supports interface filtering via a glob expression in addition to previously supported filtering via resource and resource group.
New and Updated Monitoring Coverage
Upon your account’s upgrade to v.132, import our new and updated LogicModules from the LogicMonitor repository to expand and enhance your monitoring coverage.
New Monitoring Coverage
- AWS Athena – 1 DataSource
- Discovers and monitors CloudWatch metrics for AWS Athena workgroups including query state, amount of data scanned per query, total execution time, and more.
- AWS DocumentDB – 1 DataSource
- Discovers and monitors CloudWatch metrics for AWS DocumentDB clusters including replication lag, disk usage, CPU usage, and more.
- AWS OpsWorks – 1 DataSource
- Discovers and monitors a large number of CPU, memory, load, and process metrics for AWS OpsWorks stacks, as reported by CloudWatch.
- AWS Step Functions – 1 DataSource
- Discovers and monitors a large number of execution, activity, service integration, service, and API metrics for AWS Step Functions state machines, as reported by CloudWatch.
- Checkpoint – 7 DataSources, 1 PropertySource
- New Checkpoint DataSources and one new PropertySource named addCategory_Checkpoint have been released. These new DataSources feature significant efficiencies in their AppliesTo logic, effectively deprecating the existing legacy Checkpoint DataSources. The new DataSources feature underscores in their names (for example, Checkpoint_HA_Status). If you are currently using the legacy DataSources, you will not experience any data loss upon importing the new DataSources because names have been varied to eliminate module overwriting. However, you will collect duplicate data and potentially receive duplicate alerts for as long as both sets of DataSources are active. For this reason, we recommend that you disable the legacy DataSources after importing the new ones.
- F5 GTM – 1 PropertySource
- A new PropertySource named addCategory_F5GTM will now automatically add the value of “F5GTM” to the system.categories property for hosts identified as having F5 GTM. Previously, this category needed to be manually added into a host’s properties.
- GCP Memorystore for Redis – 1 DataSource
- Discovers and monitors StackDriver data for GCP Memorystore Redis instances including number of blocked clients, number of connected clients, total time of calls, average time per call, and many more metrics.
- Microsoft Azure Data Factory – 1 DataSource
- Discovers and monitors a large number of run (pipeline, activity, trigger), integration runtime, and resource entity metrics for Azure Data Factory, as reported by Azure Monitor.
- Microsoft Azure Event Grid – 1 DataSource
- Discovers and monitors Azure Monitor metrics for Azure Event Grid topics.
- Microsoft Azure Load Balancers – 1 DataSource
- Discovers and monitors Azure Monitor metrics for Azure Load Balancers.
- Microsoft Azure Logic Apps – 1 DataSource
- Discovers and monitors a large number of run, action, trigger, and billing metrics for Azure Logic App workflows, as reported by Azure Monitor.
- Microsoft Azure Public IP – 1 DataSource
- Discovers and monitors a large number of inbound and outbound packet metrics, IP availability, and DDoS metrics for Azure public IP addresses, as reported by Azure Monitor.
- Microsoft Azure Replication Jobs (within Recovery Vaults) – 1 DataSource
- Discovers and monitors Azure Replication jobs within recovery vaults.
- Microsoft Azure Stream Analytics – 1 DataSource
- Discovers and monitors Azure Monitor metrics for Azure Stream Analytics jobs including resource utilization and the number of input/output events, errors, and callout requests.
- Microsoft DHCP Servers – 1 DataSource
- A new DataSource named Microsoft_DHCP_IPv4Servers has been released that moves from Get-WMI to CIM for performance efficiency and avoidance of unnecessary log generation. Important: This new DataSource deprecates the legacy Microsoft_DHCP_IPv4Server DataSource (note the lack of pluralization in the legacy DataSource name). If you are currently using the legacy DataSource, you will not experience any data loss upon importing the new DataSource because of the name variation. However, you will collect duplicate data and potentially receive duplicate alerts for as long as both DataSources are active. For this reason, we recommend that you disable the legacy DataSource after importing the new one.
- Microsoft Exchange – 1 PropertySource
- The new addCategory_MicrosoftExchange_PowerShell PropertySource uses either remote PowerShell or a CIM session to identify the installed version of Microsoft Exchange Server. Applying only to Microsoft Windows hosts monitored by Windows-based Collectors, this PropertySource offers more authentication methods and improved CIM classes. If the host is monitored by a Linux Collector, then the addCategory_MicrosoftExchange PropertySource is applied instead.
- Microsoft Office 365 – 14 DataSources, 2 PropertySources, 10 ConfigSources
- Provides a view into the state of Microsoft Office 365 deployment and the underlying services and license usage, allowing you to quickly identify faults and manage performance and license utilization accordingly. See Microsoft Office 365 Monitoring for details on what this package monitors, as well as instructions for setting up monitoring.
- Microsoft SQL Server – 1 PropertySource
- The Microsoft SQL Server monitoring suite has been extensively updated for improved efficiency in connecting to SQL instances. The updated DataSources require the new Microsoft_SQLServer_Connections PropertySource, which is responsible for creating the JDBC connection strings used by the DataSources to connect to SQL Server. For details on upgrading, see the Migration to Latest LogicModules section of the Microsoft SQL Server Monitoring support article.
- Netgear ReadyNAS – 4 DataSources, 1 SNMP SysOID Map
- Monitors various aspects of Netgear ReadyNAS devices including chassis temperature; physical disk capacity, temperature, and errors; fan health status and RPM; and volume storage metrics and operating status.
- OSPF_Neighbors – 1 DataSource, 1 PropertySource
- A new OSPF_Neighbors DataSource and addCategory_OSPF PropertySource have been released to support SNMPv3 multi-context. Important: The new DataSource deprecates the legacy OSPF Neighbors DataSource (note the lack of underscore in the legacy DataSource name) and additionally provides improved alerting and graphs. If you are currently using the legacy DataSource, you will not experience any data loss upon importing the new DataSource because the name has been varied to eliminate module overwriting. However, you will collect duplicate data and potentially receive duplicate alerts for as long as both DataSources are active. For this reason, we recommend that you disable the legacy DataSource after importing the new one.
- Veeam Backup & Replication: Backup Sessions – 1 DataSource
- Collects metrics for backup job sessions. These metrics were previously collected by the Veeam_BackupAndReplication_Jobs_Backups DataSource, but this functionality has been pulled out of this DataSource and improved upon in the new Veeam_BackupAndReplication_BackupSessions DataSource for the purpose of reducing alert noise.
Updated Monitoring Coverage
- Checkpoint – All 7 DataSources
- New Checkpoint DataSources, as mentioned in the previous section, have been released that deprecate the legacy Checkpoint DataSources.
- Cisco Entity Sensors – 1 DataSource
- Added an Active Discovery filter to prevent instances for sensors that have never worked from being created. Upon download of updated DataSource, existing instances that do not meet the new Active Discovery filter parameters will expire within 30 days. Added alert trigger interval.
- Cisco FRU Power – 1 DataSource
- Minor script improvements.
- Cisco UCS Component Health – 1 DataSource
- Added Active Discovery filtering to exclude “Not Specified” CPU instances.
- Citrix NetScaler – 1 ConfigSource
- Updated filter criteria.
- Updated the threshold and alert message for the Status datapoint.
- Updated this convenience function to return TRUE if the value of “Sophos” or “SophosXG” is contained within a resource’s system.categories
- Fixed default port usage issue in Active Discovery and collection scripts.
- Updated OID to use product ID instead of description for improved identification with newer Meraki devices types/models.
- Moved from Get-WMI to CIM for performance efficiency and avoidance of unnecessary log generation; updated Technical Notes field.
- A new DataSource, as mentioned in the previous section, has been released that deprecates the legacy Microsoft_DHCP_IPv4Server DataSource.
- The addCategory_MicrosoftExchange and Microsoft_Exchange_Info PropertySources feature new AppliesTo logic that associates them only with Microsoft Windows hosts that are being monitored by Linux Collectors. Hosts being monitored by Windows-based Collectors will associate with the new addCategory_MicrosoftExchange_PowerShell PropertySource, discussed in the previous section.
- The Microsoft SQL Server monitoring suite has been extensively updated for improved efficiency in connecting to SQL instances. The updated DataSources require the new Microsoft_SQLServer_Connections PropertySource, which is discussed in the previous section. Some DataSources have been deprecated. For details on upgrading, see the Migration to Latest LogicModules section of the Microsoft SQL Server Monitoring support article.
- Wrapped in try/catch to prevent script failure.
- Fixed issue with ID matching. If you have any E/EF-Series devices with only 1 IP address set, all historical data generated by devices associated with the same Web Services Proxy instance should be considered suspect.
- Added support for MacOS memory monitoring.
- Fixed issue in Active Discovery and collection script that was incorrectly interpreting Boolean values.
- Datapoint and graph cleanup.
- A new DataSource, as mentioned in the previous section, has been released that deprecates the legacy OSPF Neighbors DataSource.
- Improved datapoint alert message and graphs.
- Made various improvements to graphs and datapoint alert messages.
- Fixed issue in “PercentUsed” complex datapoint that was causing incorrect rounding of the value.
- Added generic key blocking for LLDP chassis ID for the following PropertySources: addERI_Arista, addERI_BarracudaLoadBalancer, addERI_Cisco, addERI_Device, addERI_HPSwitch, addERI_Huawei, addERI_Juniper, addERI_Linux, addERI_Meraki, addERI_NetScaler, addERI_PaloAlto, and addERI_Ubiquiti.
- Moved backup session monitoring from this DataSource into the new Veeam_BackupAndReplication_BackupSessions DataSource for the purpose of reducing alert noise.
- Supports monitoring of duplicate jobs.
- Fixed issue in Active Discovery script that was preventing this DataSource from applying to multiple devices.
- Blocked loopback MAC address for improved topology mapping.
- Converted collection method to batchscript for performance improvement and efficiency; various Active Discovery script improvements; graph cleanup.
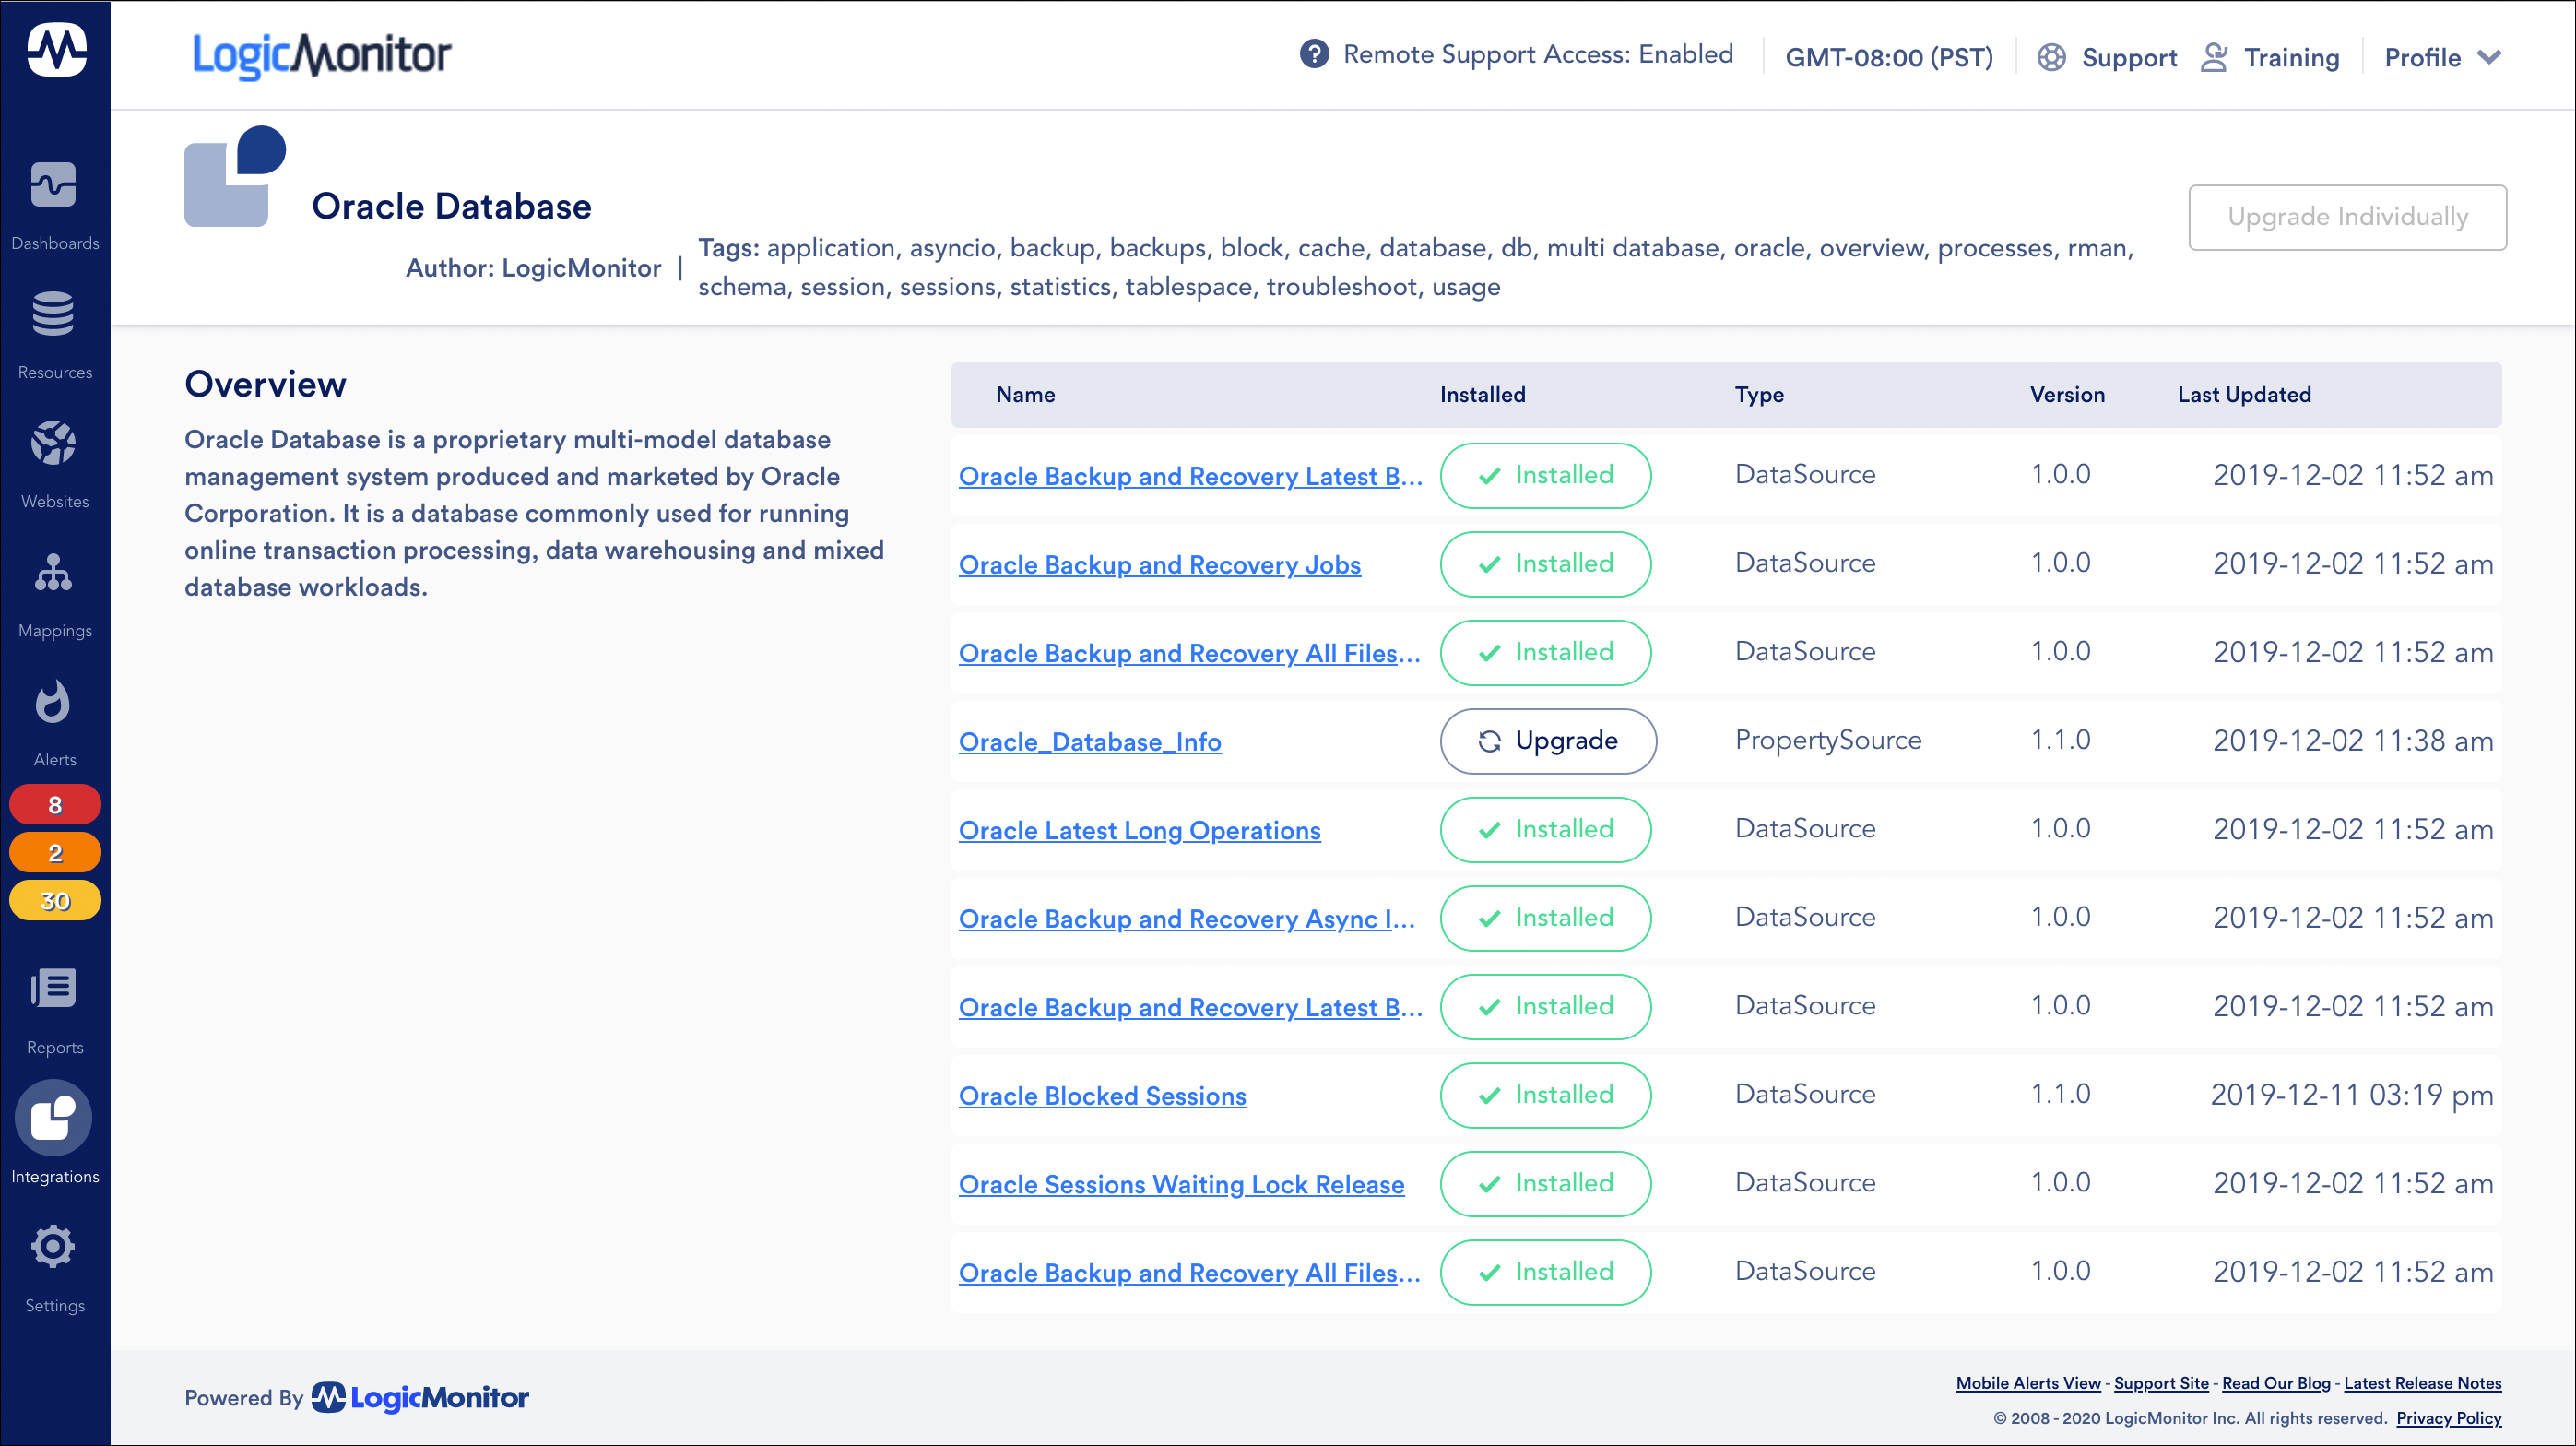
Entering Beta: Integrations Page
With v.132, LogicMonitor will begin beta for the Integrations page, a new interface for the management of LogicModules. The Integrations page provides a centralized view into all LogicModule integrations (e.g. DataSources, PropertySources, EventSources, etc.) that are available for use in your monitoring activities.
Several new features will be delivered with the new Integrations page, including:
- LM Exchange. The LogicMonitor repository will be available right from the Integrations page UI. You’ll be able to browse, search, and import new and updated LogicModules—whether published by LogicMonitor or by a member of the LogicMonitor user community.
- Safe LogicModule Merge (SLM). Global-level customizations you’ve made to a LogicModule (e.g. collection interval, alert thresholds, datapoints, AppliesTo logic, Active Discovery filters) are now highlighted when importing updates for easy merging and preservation.
- Integration packages. An integration package is a grouping of LogicModules that work together to provide full monitoring coverage for a device or system. By packaging LogicModules according to the technologies they serve, the Integrations page not only provides a birds-eye view of the LogicModules required to successfully monitor a particular resource, but also the ability to efficiently import a package as a whole to ensure full monitoring coverage.
- New editor UI. A fresh redesign of the LogicModule editor (beta will only support DataSource definition editing to start).
Interested in participating? Contact your Customer Success Manager for more details.