


The development team continues to be focused on some big surprises, but we’ve managed to get some fun new features into this release (v.46). Expect the following by the end of October:
New Features
EMail Address as User Name
We recognize that many of you prefer to use email addresses as user names and we’ve decided you know best. When adding or updating an account, the user name can be set to an email address.
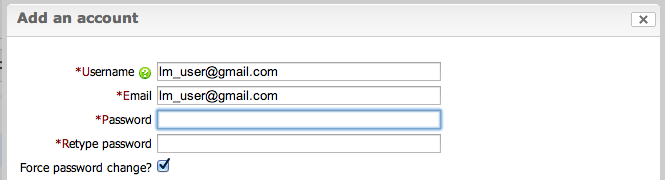
To accommodate existing user names (and those users who prefer to fight this trend), the user name and email address fields will remain distinct. All email notifications will continue to be sent to the address stored as the account Email.
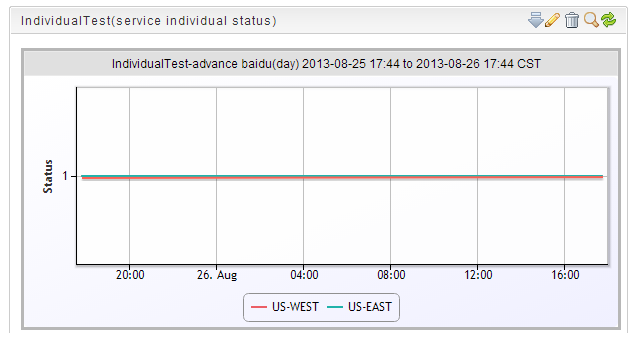
Service Individual Status Widget
Our last release introduced an Overall Services Widget, which enabled you to view the overall status of services from your dashboard. In this release we’ve added and Individual Services Widget which will display the status of all test locations for one specific service.
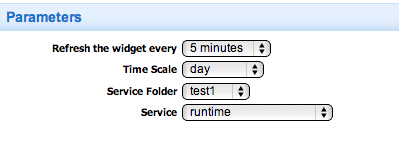
To add the widget to your dashboard, select Service Individual Status Widget from the Add Widget drop down. Add a name, set refresh time, time scale, and select the service you want represented in the widget.
The lasts step is to select which testing locations you want represented in the widget:
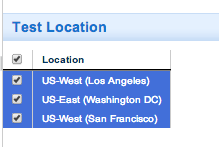
Click submit and you’re widget is ready to go!
CPU Report Template
While the Host Metric Trends report allows you to aggregate just about any datapoint, we recognize this can be cumbersome. The CPU Report brings you all server CPU datapoints in one easy to generate report.
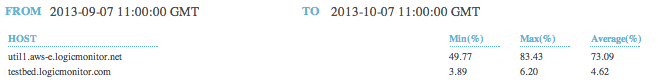
The report will include servers for all Hosts in the group with Minimum, Maximum, and Average busy percent for the time range selected. If you select Top 10 Only graphs will be included.
Reporting Improvements
We made a variety of changes to how our reports are displayed and generated. The most exciting of these are:
- The ability to only include Top 10 matches in the Host Metric Trends report. Simply select the Top Ten Only check box in the parameter section.
- We removed the Report Title field from the Report configuration page, it was an extra step that didn’t add much value.
- If you’ve disabled or removed a host and it is included in a report we will provide a more useful error message and will display the report without the specific host data.
Bugs fixed:
- When creating an alert widget the parameters were not auto-completing as expected
- Services alert storage was refactored to address issues around duplicate alerts, alert counts, and alert history
- The Netflow report will display both the host name and interface name
- We had trouble with math and displayed the host group count from the parent group on subgroups. The subgroup host count has been corrected.
- When ‘*’ was used to indicate all host groups in a custom widget, deleting a host group would result in an error.
- SLA reports no longer round up to the nearest whole number, they will round to the nearest hundredth.
