


The v.86 release will be rolled out through the second week of March. The changes you will see were designed to improve our platform’s ease-of-use and put more helpful data right at your fingertips.
Network Flow Improvements
We have added another round of improvements to our network traffic flow monitoring. This release debuts network flow groups, which display the aggregate of network flow data from each device assigned to a group. This is a fundamental improvement to the way we display your network flow data because it permits a traffic view (total bandwidth/flows) of all interfaces, which is generally more pertinent than the flows from a single device.
Why you care: consider each of your office locations. Every location may contain multiple routers and switches. The individual traffic for each of those devices is likely not nearly as important as the overall traffic flow for the office. Grouping the traffic of each device into a single aggregate flow will provide insight into the latter.
Alert Threshold History
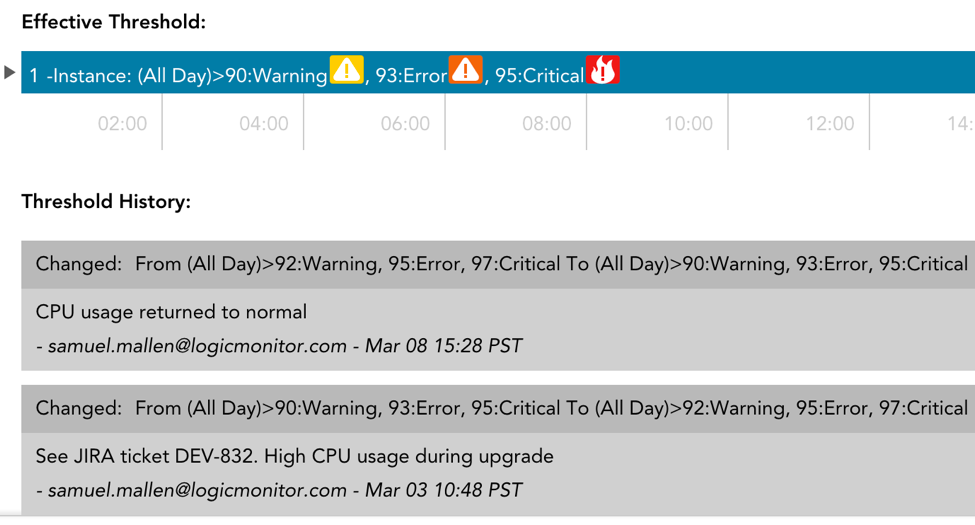
When adding, editing, or removing an alert threshold, you will have the option to add a note describing the purpose/reason for the change. These notes are stored at the datapoint-level and displayed in a history log within the Manage Alert Thresholds dialog. This is a powerful new feature that will contextualize your alert thresholds, which can explain why a threshold was set at a certain value; who last edited the threshold; and what historical changes have been made to a threshold, which can facilitate issues identification and remediation.
Why you care: knowing the full history of when and why your alert thresholds were established is critical for determining future action. For instance, consider the following scenario: “We have excessive CPU usage on a device and we are not alerting on it because of an exceptionally high alert threshold. With a threshold history, I can go back and see that the threshold was intentionally changed due to a recent JIRA ticket. Now that I have this context, I do not need to worry about the lack of triggered alerts.”
Raw Data Tab
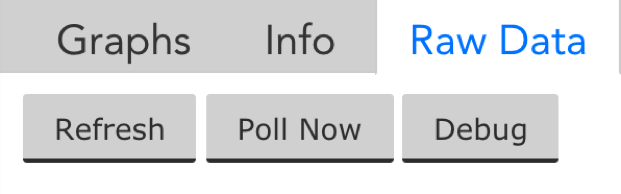
We made two major improvements to the Raw Data Tab:
- You can now launch the debug window directly from the Instance Raw Data tab. Previously, when you wanted to investigate an instance value, you had to track down the associated Collector and open the debug window from Settings | Collectors | Manage. Now, this process can be done in a single click.
- We expanded the details available from Poll Now results. Specifically, error messages are available for NaN or No Data results. In addition, you now have the ability to view the raw data returned.
Why you care: Using these improvements in conjunction with one another enables a quicker time to resolution when troubleshooting unexpected DataSources information.
Other Improvements
Dashboards
- Increased support of up to 200 locations in the Google Map widget.
- We have extended the option to play sounds when an alert is triggered to Dashboards.
Devices/Services
- Added timestamp to Poll Now results.
- Standardized graph displays and colors for legibility purposes.
- Improved graph legends. Highlighted graph datapoints will be displayed at the top of the legends and scrolling legend menus will display the number of datapoints not visible.
- We have added two new system properties for all devices: system.collectorversion and system.collectorplatform. This is useful because it enables you to target devices based on the version of their associated Collector.
- We removed all case sensitivity in reference to service properties.
Integrations
- We now support v2 of ConnectWise’s API. Beginning with v.86, you will only be able to create ConnectWise integrations with v2.
LogicModules
- We have added the “Test AppliesTo” button to ConfigSources, PropertySources and JobMonitors to easily determine which devices will be impacted by a LogicModule.
- A new AppliesTo Scripting function, getCollectorVersion(), is available. This is primarily designed to ensure Collector DataSources are aligned with the Collector version.
- Added a maximum of 256 system.categories to avoid performance issues with PropertySources.
Network Flow
- We have updated the Network Flow Traffic tab to now include “other” traffic when Top Talkers doesn’t comprise the top 95% of throughput. This new category bundles minor flows together to make up the top 95%.
- Minor improvements have been made to the Network Flow traffic tab, most notably the renaming of “Top Servers” to “Top Ports”.
Reports
- We now provide the option to include DNS mappings in the Netflow Device Metrics report.
REST API
We’ve added the following functionalities to v1 of our REST API:
- add notes to alerts
- get devices for a specific device group
- schedule Active Discovery
- get unmonitored devices
Settings
- The Audit Log will now display the name, LogicModule Locator, and type of LogicModule published or imported to the Registry.
- Standardized password requirements to exclude spaces.
Bugs Fixed
- Certain Netflow widgets displayed partial data when shown on shared versions of a dashboard.
- Network traffic flow pie widgets were displaying as tables in shared dashboards.
- The “Created by” field was not populating correctly in the Audit Log when creating a new user.
- Alert widgets without a sort order were not displaying correctly in dashboard reports.
- All No Data values were displaying as NaN throughout the UI. This has been changed back to No Data.
- Dashboard reports with special characters in the title weren’t working properly.
- Failed API requests recorded in the audit log weren’t showing an associated user in some cases.
- Some widget titles were displaying incorrectly.
- Widget tokens for virtual datapoints were not resolving in custom graph legends.
- Event alert end time was not stored correctly if the alert was cleared by an acknowledgement.
- Invoices were unavailable from the Financial tab.
