Disclaimer: This content applies to the legacy UI and is no longer maintained. It will be removed at a future time. For up-to-date content, see NOC Widget. At the time of removal, you will automatically be redirected to the up-to-date content.
NOC Widget
Last updated - 24 July, 2025
The NOC widget provides at a glance insight into the health of a group, device, application, or website. You can:
- Select specific alert levels for display.
- Include device groups, devices, DataSources, instances, datapoints, websites, and website groups
- See entities that are functioning in the normal ranges represented with green.
- Include custom information in item names.
Create a NOC Widget
Click on the Add drop-down and select NOC widget from the display. The Configuration form for setting up the widget will be displayed. See these instructions if you need help filling out the title, description, dashboard and refresh frequency fields.
NOC Options
The real power of the NOC widget comes from the NOC options. NOC options allow you to add your NOC items and choose how they should be displayed. Select which alert severities should be displayed and how NOC items should be sorted. When adding NOC items you can choose what each NOC item should represent using the Group By field (each NOC item can represent a group, device, datasource, or instance)
Alert severities
Select which alert severities & statuses should be displayed in the NOC widget:
- Warning (will display as yellow)
- Error (will display as orange)
- Critical (will display as red)
- Acknowledged (will display with a blue checkmark)
- In Scheduled Down Time (will display with the SDT icon)
The displayed statuses for entities in a NOC widget will only reflect the selected alert severities/statuses (entities without an alert that matches a selected alert severity/status will be displayed as green).
Sort by
Selecting Name will display the items in the widget in alphabetical order. Selecting Alert Severity will display items starting with any alerts in the top left corner, listing them in order of severity. The remaining items with no alerts will be listed after.
NOC Items- Devices
If you want to include Devices in the NOC widget, begin by following our general instructions on adding datapoints to your widget. You have the additional option to set the datapoint field to all – this will show the status for all datapoints. Additional configuration options for each NOC item include Group By and Name:
Group By
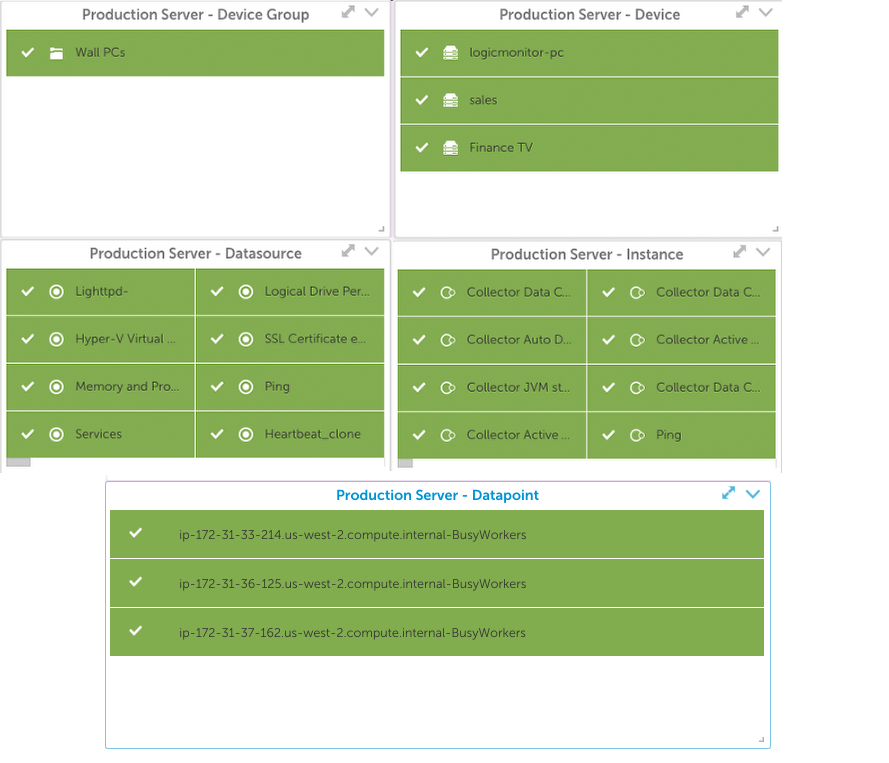
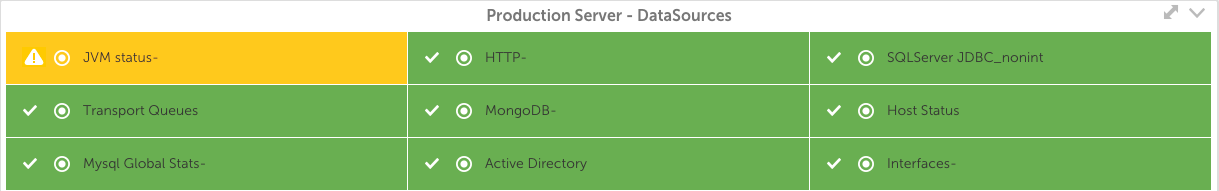
This field determines how the data is displayed on the widget. The choices range from Device Groups to individual datapoints. For example, if All Devices (*) are selected for a particular Device Group and Group By is set to ‘Device’ a separate NOC item will be created for each Device in the Group.
Name
This field can contain any text. However, NOC items are not automatically named, so the Insert Token function can add the appropriate context to the item. Inserting the token associated with your Group By selection will display the associated names of the entity you chose in Group By.
Initially, you may find it easier to keep this field in sync with the Group By field.
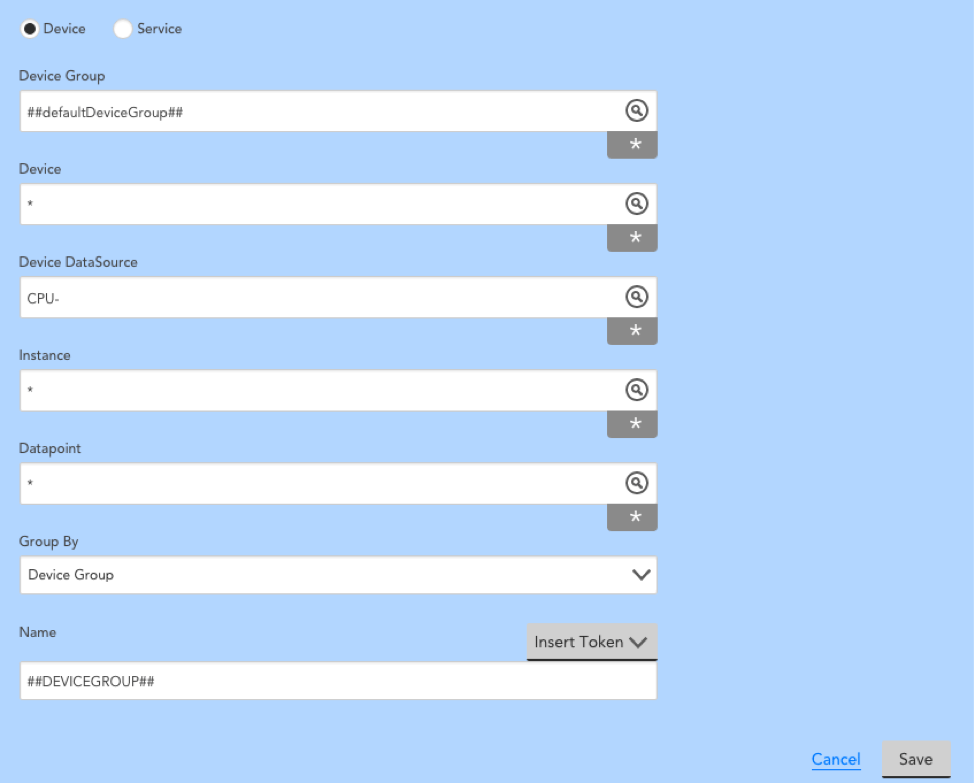
Example Configuration for Adding Devices
The following configuration will display each device in Subgroup1 as a NOC item. The name of each item will be the device name, based on the token selected.
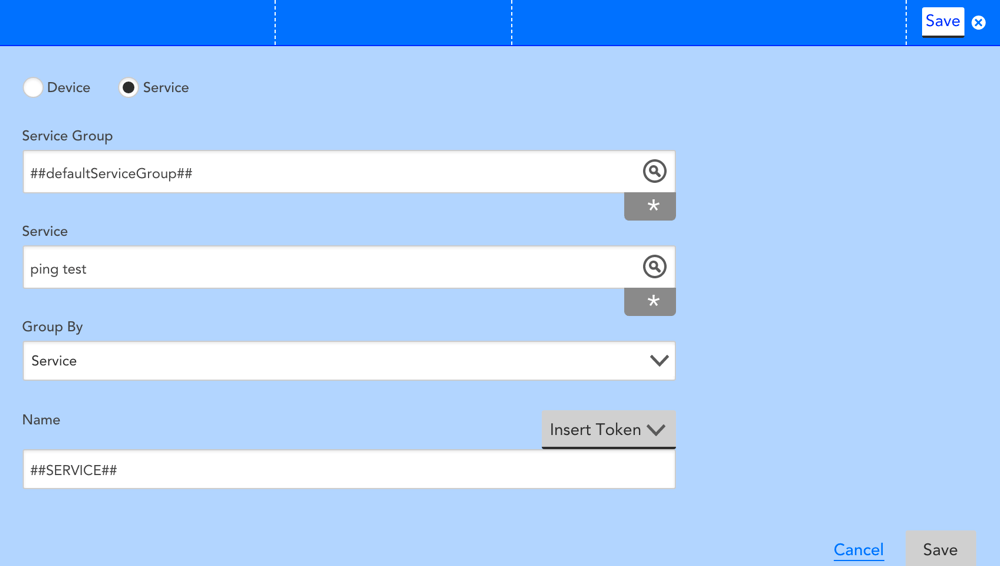
NOC Items- Websites
If you wish to add a website(s) to your NOC widget, begin by selecting one or all groups to filter the website field. Then select a website to add.
Group By
This field determines how the data is displayed on the widget.
Select Website Group to display all websites in that group as one item on the widget. If any of the websites in the group have an alert, the NOC item will reflect the alert. If multiple websites in the group have alerts, the most severe alert will display.
Select Website to display all websites within that website group in alphabetical order.
Name
This field can contain any text. However, NOC items are not automatically named, so the Insert Token function can add the appropriate context to the item.
Initially, you may find it easier to keep this field in sync with the Group By field.
Example Configuration for Adding Websites
Max Display Columns
This field sets the number of columns of NOC entities that will be displayed in the widget. If there are more entities in your widget configuration than can fit in the number of columns you have selected, a horizontal scroll bar will be included in the widget display to enable viewing of all items.
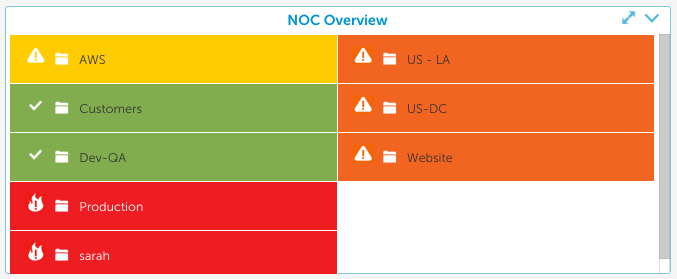
Example NOC
The following NOC widget is configured to display the alert status for all top level groups in the account: