
Configuring Monitoring for NetFlow
Last updated - 24 July, 2025
Overview
Network traffic flow monitoring is the ability to collect IP network traffic as it enters or exits an interface. LogicMonitor can monitor network traffic flow data for any devices that support common flow export protocols.
Specifically, LogicMonitor Collectors are configured to receive and analyze exported flow statistics for a device. The statistics that a LogicMonitor Collector can report on include:
- Top talkers
- Top source/destination endpoints
- Top flows
- Top ports
- Top applications
- Quality of service (QoS)
System Requirements
Before assigning a LogicMonitor Collector as the recipient of a device’s exported network flows, review the following system requirements and recommended best practices.
Protocols Supported
LogicMonitor Collectors support a variety of network flow export protocols, including:
- NetFlow versions 5, 7 and 9
- Flexible NetFlow (requires same configurations as version 9)
- IPFIX (sometimes referred to as NetFlow version 10)
- sFlow versions 1, 3, and 5 (version 5 requires Collector version 29.105 or higher) (version 2 is not supported)
- JFlow (version 5)
- NBAR2 (only available for LogicMonitor Enterprise users)
Note: NetFlow Lite is not supported.
LogicMonitor Collector Requirements
Ensure that your Collector has the capacity to comfortably monitor network traffic flows. See Collector Capacity for a sample set of network flow capacity limits across various environments.
Requirements for NBAR2
If you intend to collect Next Generation Network based Application Recognition (NBAR2) data, you must set the netflow.nbar.enable property on the LogicMonitor Collector to TRUE (it is FALSE by default), as discussed in the Configuring the LogicMonitor Collector for Network Traffic Flow Monitoring section of this article.
Note: The ability to collect NBAR2 data within LogicMonitor is only available to LogicMonitor Enterprise users. Additionally, the LogicMonitor Collector that is collecting this data must be version 29.101 or higher.
Recommended Best Practices
- Minimize network hops between the LogicMonitor Collector and the device. Network flow records are sent using the UDP communications protocol. Because UDP delivery is not guaranteed, try to ensure the LogicMonitor Collector has the fewest network hop as possible to the device generating network traffic flow records in order to minimize potential flow disruption due to network congestion or complexity.
- Synchronize clocks. Network traffic data consists of detailed, real-time statistics on network traffic. Therefore, to avoid confusing discrepancies, it is critical to synchronize clocks between the transmitting device and the device that is hosting the LogicMonitor Collector. This is best accomplished via the NTP protocol. Additionally, if the devices are located in different time zones, consider using UTC or standardizing on a single timezone.
- Eliminate port conflict. The Collector host that is collecting network traffic data must not have any other application (i.e. another network traffic analyzer) listening on the specified port. This can potentially cause contention and prevent traffic data from displaying in LogicMonitor.
Enabling Network Traffic Monitoring in LogicMonitor
Network traffic monitoring is enabled in LogicMonitor on a per-device basis. It can be enabled when first adding a device into monitoring (in expert mode) or at any point thereafter.
To enable network traffic monitoring for a device:
- Navigate to the Resources page and, from the Resources tree, find the device for which you want to enable network traffic monitoring.
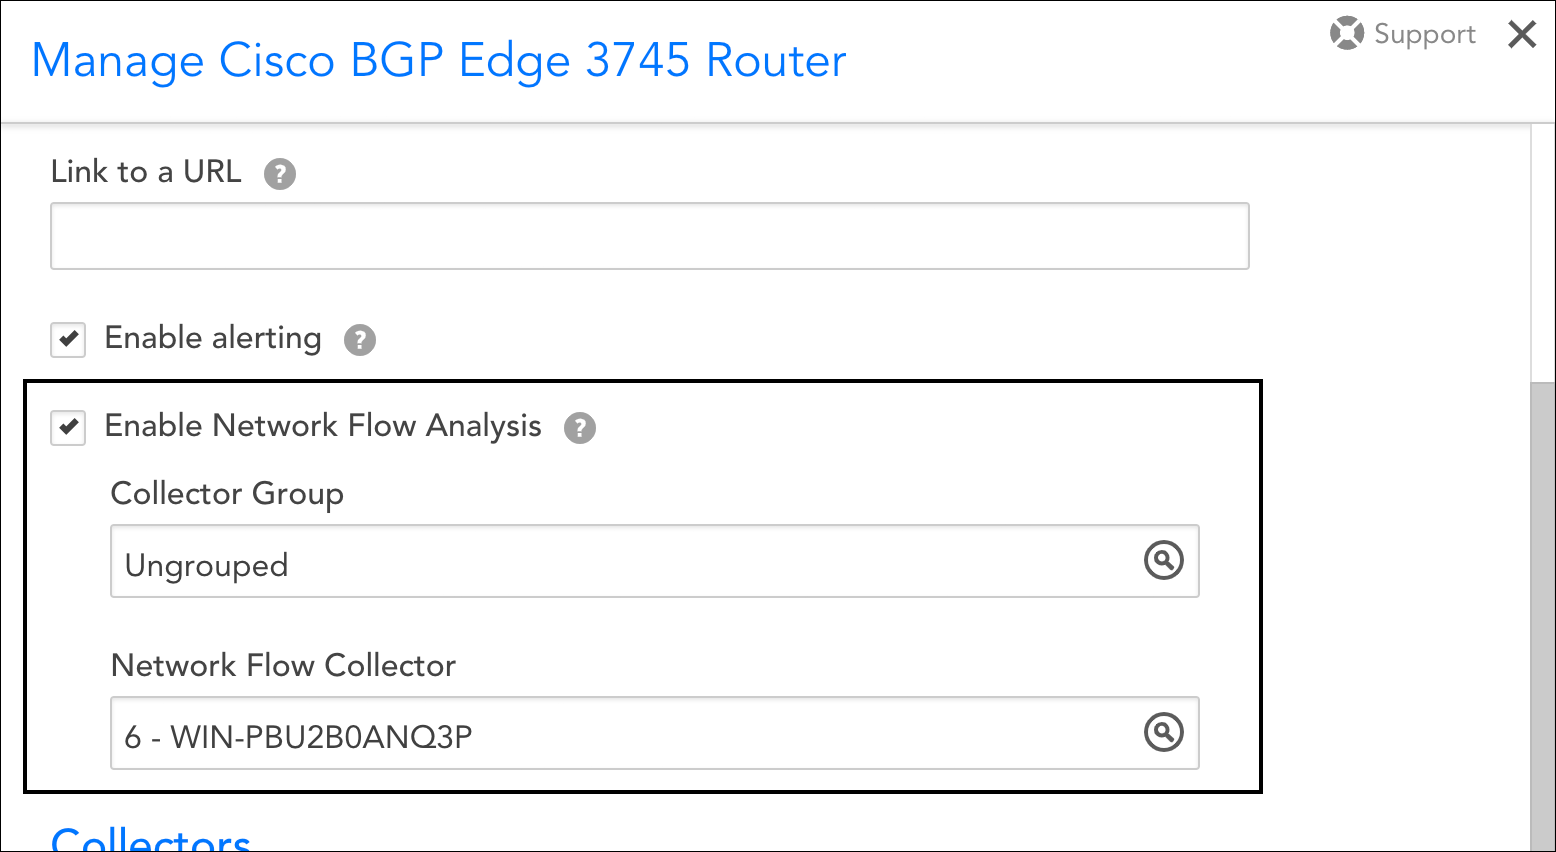
- With the device selected, click the Manage button located in the header.
- From the Manage dialog, check the Enable Network Flow Analysis option. (This sets the system.enablenetflow property on the device to TRUE.)
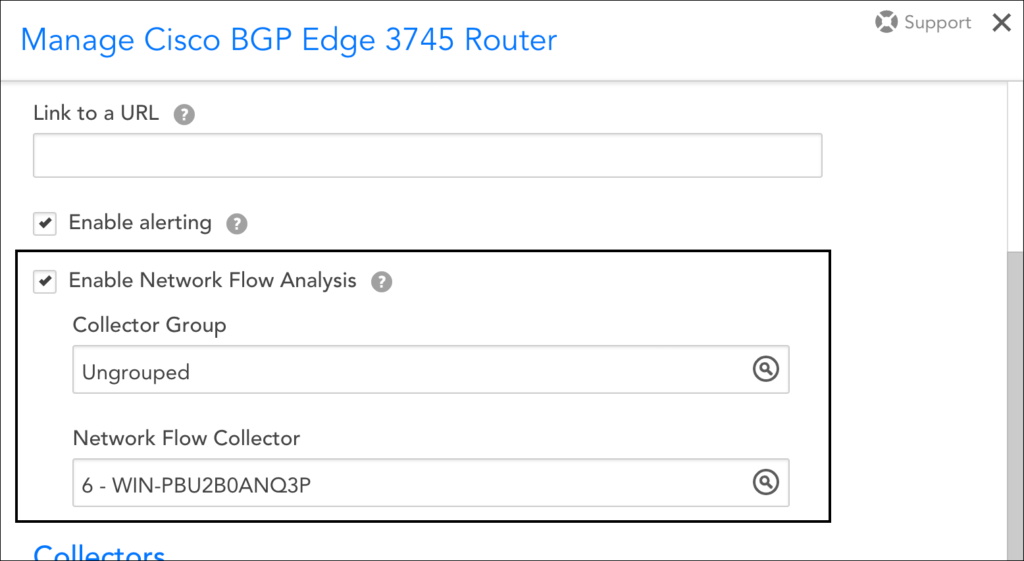
- From the Network Flow Collector field that dynamically displays, identify the Collector that will be used to receive exported network flow data. A specific Collector must be specified; you cannot assign network flow collection duties to an Auto-Balanced Collector Group.
Note: The Collector assigned to network traffic flow monitoring can be different than the Collector assigned to device monitoring. The ability to dedicate a Collector to network traffic flow data only allows you to better control load or to centralize all network flow activity to a few Collectors, minimizing the number of firewall ports that need to be opened on Collector hosts.
Note: If you intend to collect NBAR2 data for a device, which requires LogicMonitor Enterprise and Collector version 29.101 or higher, you must additionally set the netflow.nbar.enable property on the LogicMonitor Collector to TRUE (it is FALSE by default). See the Configuring the LogicMonitor Collector for Network Traffic Flow Monitoring section of this article for more information.
- Click Save.
Note: If your network flow exporter is sending data from an IP address that is not the same as the monitored IP of the device (as configured in LogicMonitor), customize the netflow.allowips property on the device with the IP address(es) from which network flow originates. This property accepts either a single IP or a comma-separated list as its value; it does not accept a range. For more information on properties, see Resource and Instance Properties.
Configuring the LogicMonitor Collector for Network Traffic Flow Monitoring
By default, Collectors install with standard network traffic flow monitoring settings that, for most use cases, do not require modification. However, these settings are configurable, allowing you to override defaults to meet the unique needs of your monitoring environment.
| Name> | Type | Default | Details |
| netflow.enable | Boolean | TRUE | If TRUE, the network flow module is enabled on Collector. |
| netflow.ports | Integer | 2055 | The UDP listening port for network flow protocol data. The UDP port on the device that is sending the flow data must match the UDP port specified here. Multiple ports can be configured here if you need to support multiple protocols on multiple ports (for example, netflow.ports=2055,4739).
|
| netflow.sflow.ports | Integer | 6343 | The UDP listening port for sFlow protocol data. |
| netflow.datadir | String | netflow | The path of the HSQL database. |
| netflow.datadir.maxSizeInMB | Integer | 10240 | The maximum size (in megabytes) of the network flow data directory. |
| netflow.log.maxNumPerMinute | Integer | 5 | The maximum log count allowed to be written during one minute of network flow monitoring. |
| netflow.netflow9.templateLife | Integer | 720 | The expiration time (in hours) of NetFlow version 9 template. |
| netflow.topFlowSamples | Integer | 1000 | The maximum sample number of top flows. Allowed range is from 100 to 2000. |
| netflow.ignoreTimestampValidate | Boolean | FALSE | If TRUE, the Collector ignores network flow device time information. Currently, the only known devices that necessitate overriding the default FALSE value are SonicWalls. |
| netflow.nbar.enable | Boolean | FALSE | If TRUE, the Collector begins parsing the applicationID and ApplicationType. LogicMonitor Enterprise and Collector version 29.101 or higher are required. |
| netflow.ipv6.enabled | Boolean | TRUE | If FALSE, the Collector will ignore flows from with IPv6 addresses |
| netflow.log.largeBytesOrPackets | Integer | 1073741824 | Logs flows in Audit Logs with packets or bytes larger than the integer specified |
Network flow settings are available for editing on a per-Collector basis from the Collector’s config file. For instructions, see Editing the Collector Config Files.
Enabling Network Traffic Flow Monitoring on Your Device
In addition to enabling network traffic flow monitoring in LogicMonitor, it must also be enabled on your device. Configurations vary widely depending on the device, vendor, network topology, and protocol you are using. In fact, there are more combinations and options than can possibly be covered in this document, and you will want to review manufacturer guidelines for your specific setup.
However, we have listed some basic requirements next, as well as sample NetFlow configurations.
Basic Device Configuration Requirements
Device configurations applicable to all protocols:
- Network flow monitoring must be enabled per interface.
- A version number should be specified.
- A source interface for the flow exporter must be specified.
- The UDP port configured for the exporter must match the port specified in the Collector’s agent.conf file, as discussed in the Configuring the LogicMonitor Collector for Network Traffic Flow Monitoring section of this article.
- The clock on the device should be synchronized with the clock on the Collector host.
- The IP address of the destination (the LogicMonitor Collector) must be specified.
Device configurations applicable to NetFlow version 9:
- For NetFlow version 9, additional template configuration options must be set.
Device configurations applicable to sFlow:
- For sFlow, packet data must be provided in the
enterprise=0andformat=1packet configuration as described in RFC2233. - sFlow uses port 6343.
Device configurations applicable to NBAR2:
- In order for NBAR2 application information to be collected, the option application-table and option application-attributes must be enabled on the exporter configuration of the device. See Cisco’s NBAR Configuration Guide for more information.
Note: NBAR2 data collection requires LogicMonitor Enterprise and Collector version 29.101 or higher.
Sample Configurations
Next we’ve highlighted sample NetFlow version 9 device configurations. Because these sample configurations have the potential to become outdated as Cisco makes updates, please refer to Cisco’s NetFlow Configuration and Flexible NetFlow Configuration guides to ensure up-to-date information.
Cisco IOS 3745 router – NetFlow Version 9, Main Cache Export
Configure global settings: source interface, NetFlow version, target NetFlow Collector, and UDP port.
To begin, enter the following at the command line:
Router#conf t
Then, enter the configurations for the global settings:
Router(config)#ip flow-export source FastEthernet0/0
Router(config)#ip flow-export version 9
Router(config)#ip flow-export destination 10.0.0.10 2055
Configure global template settings: refresh-rate, timeout-rate, and options.
To begin, enter the following at the command line:
Router#conf t
Then, enter the configurations for the global template settings:
Router(config)#ip flow-export template refresh-rate 15
Router(config)#ip flow-export template timeout-rate 90
Router(config)#ip flow-export template options export-stats
Router(config)#ip flow-export template options refresh-rate 25
Router(config)#ip flow-export template options timeout-rate 120
Configure the interface settings: enable route-cache flow
To begin, enter the following at the command line:
Router#conf t
Then, enter the configurations for the global template settings:
Router(config)#interface fa0/0
Router(config-if)#ip route-cache flow
Note (Palo Alto users): There is a limited ability to customize the name of Palo Alto interfaces. According to Palo Alto, the interface name cannot be edited. However, you do have the ability to append a numeric suffix to the interface name for subinterfaces, aggregate interfaces, VLAN interfaces, loopback interfaces, and tunnel interfaces.
Note (for Barracuda users): Those using Barracuda NG Firewalls exporting IPFIX/NetFlow v9 will need to consult Barracuda documentation for proper configuration. Specifically, you will need to adjust the following settings: change “Byte Order” to “LittleEndian” and change the IPFIX template for Export to “Default without Barracuda fields”.
Required and Supported Fields for NetFlow Exports
| Field Type | Number | Description | Comments |
| PROTOCOL | 4 | IP protocol type | Mandatory |
| IPV4_SRC_ADDR | 8 | IPv4 source address | Mandatory for IPv4 addresses (if the Collector is IPv6 enabled and flows have IPv6 addresses, IPv6 source and destination fields (IPV6_SRC_ADDR and IPV6_DST_ADDR) should alternately be used) |
| IPV4_DST_ADDR | 12 | IPv4 destination address | |
| DIRECTION | 61 | Flow direction | Optional (if not provided, the default value of 0 will be used, which indicates ingress) |
| SRC_TOS | 5 | Type of Service byte setting when entering incoming interface | Optional |
| DST_TOS | 55 | Type of Service byte setting when exiting outgoing interface | Optional |
| TCP_FLAGS | 6 | Cumulative of all the TCP flags seen for this flow | Optional |
| LAST_SWITCHED_FT | 21 | System uptime at which the last packet of this flow was switched | Optional (if not provided, current epoch time will be used as the default value) |
| FIRST_SWITCHED_FT | 22 | System uptime at which the first packet of this flow was switched | Optional (if not provided, current epoch time minus 60 seconds will be used as the default value) |
Multicast Group |
|||
| IS-MULTICAST | 206 | The first bit of this octet is set to 1 if the Version field of the IP header has the value 4 and if the destination address field contains a reserved multicast address in the range from 224.0.0.0 to 239.255.255.255; otherwise, this bit is set to 0.
The second and third bits of this octet are reserved for future use. |
Optional |
| REPLICATION_FACTOR | 99 | Multicast replication factor | Optional |
| MUL_DST_PKTS | 19 | IP multicast outgoing packet counter with length N x 8 bits for packets associated with the IP Flow | Optional |
| MUL_DST_BYTES | 20 | IP multicast outgoing byte counter with length N x 8 bits for bytes associated with the IP Flow | Optional |
Interface Group |
|||
| INPUT_SNMP | 10 | SNMP ingress interface index | At least one of these fields must be present |
| OUTPUT_SNMP | 14 | SNMP egress interface index | |
Bytes Group |
|||
| IN_BYTES | 1 | Incoming counter with length N × 8 bits for number of bytes associated with an IP flow | At least one of these fields must be present |
| OUT_BYTES | 23 | Outgoing counter with length N x 8 bits for the number of bytes associated with an IP flow | |
Source/Destination Port Groups |
|||
| L4_SRC_PORT | 7 | TCP/UDP source port number | At least one of these fields must be present |
| L4_DST_PORT | 11 | TCP/UDP destination port number | |
Packets Group |
|||
| IN_PKTS | 2 | Incoming counter with length N x 8 bits for the number of packets associated with an IP flow | At least one of these fields must be present |
| OUT_PKTS | 24 | Outgoing counter with length N x 8 bits for the number of packets associated with an IP flow | |
NBAR Group |
|||
| APPLICATION DESCRIPTION | 94 | Description of the application | At least one of these fields must be present |
| APPLICATION NAME | 96 | Application name associated with a classification | |
| APPLICATION TAG | 95 | Eight bits of engine ID, followed by n bits of classification | Mandatory |
| APPLICATION GROUP | 12234/45002 | Groups applications that belong to the same networking application | At least one of these fields must be present |
| CATEGORY | 12232/45000 | Provides first-level categorization for each application | |
| ENCRYPTED | 290 | Specifies whether the application is an encrypted networking protocol | |
| P2P TECHNOLOGY | 288 | Specifies whether the application is based on peer-to-peer technology | |
| SUB-CATEGORY | 12233/45001 | Provides second-level categorization for each application | |
| TUNNEL TECHNOLOGY | 289 | Specifies whether the application tunnels the traffic of other protocols | |
IPv6 Group |
|||
| IPV6_SRC_ADDR | 27 | IPv6 source address | Mandatory for flows with IPv6 addresses |
| IPV6_DST_ADDR | 28 | IPv6 destination address | |
| IPV6_SRC_MASK | 29 | Length of the IPv6 source mask in contiguous bits | Optional |
| IPV6_DST_MASK | 30 | Length of the IPv6 destination mask in contiguous bits | Optional |
| IPV6_FLOW_LABEL | 31 | IPv6 flow label as per RFC 2460 definition | Optional |
Sampling Group |
|||
| FLOW_SAMPLER_ID | 48 | Identifier shown in “show flow-sampler” | Optional |
| FLOW_SAMPLER_MODE | 49 | The type of algorithm used for sampling data: 0x02 random sampling | Optional |
| SAMPLING_ALGORITHM | 35 | The type of algorithm used for sampled NetFlow: 0x01 Deterministic Sampling ,0x02 Random Sampling | Optional |
| FLOW_SAMPLER_RANDOM_INTERVAL | 50 | Packet interval at which to sample. Use in connection with FLOW_SAMPLER_MODE | Optional |
| SAMPLING_INTERVAL | 34 | Packet interval at which to sample | Optional |
| SAMPLER_NAME | 84 | Name of the flow samp | Optional |
Extended Cisco ASA Device Group |
|||
| NF_F_CONN_ID | 148 | An identifier of a unique flow for the device | Optional |
| NF_F_FLOW_CREATE_TIME_MSEC | 152 | The time that the flow was created, which is included in extended flow-teardown events in which the flow-create event was not sent earlier. The flow duration can be determined with the event time for the flow-teardown and flow-create times. | Optional |
| NF_F_EVENT_TIME_MSEC | 323 | The time in which the event occurred, which comes from IPFIX. Use 324 for time in microseconds, and 325 for time in nanoseconds. Time has been counted as milliseconds since 0000 UTC January 1, 1970. | Optional |
| NF_F_FLOW_BYTES | 85 | Mandatory for Cisco ASA 9.0 | |
| NF_F_FW_EVENT_90 | 40005 | At least one of these fields must be present | |
| NF_F_FW_EVENT_91 | 233 | High-level event code. Values are as follows:
|
|
| NF_F_FWD_FLOW_DELTA_BYTES | 231 | The delta number of bytes from source to destination | Mandatory for Cisco ASA 9.1 |
| NF_F_REV_FLOW_DELTA_BYTES | 232 | The delta number of bytes from destination to source | Mandatory for Cisco ASA 9.1 |
IPFIX/NetFlow Version 10 Group |
|||
| flowStartSeconds | 150 | The absolute timestamp of the first packet of this flow | Optional |
| flowEndSeconds | 151 | The absolute timestamp of the last packet of this flow. | Optional |
| flowEndMilliseconds | 153 | The absolute timestamp of the last packet of this flow | Optional |
| systemInitTimeMilliseconds | 160 | The absolute timestamp of the last re-initialization of the IPFIX device | Optional |
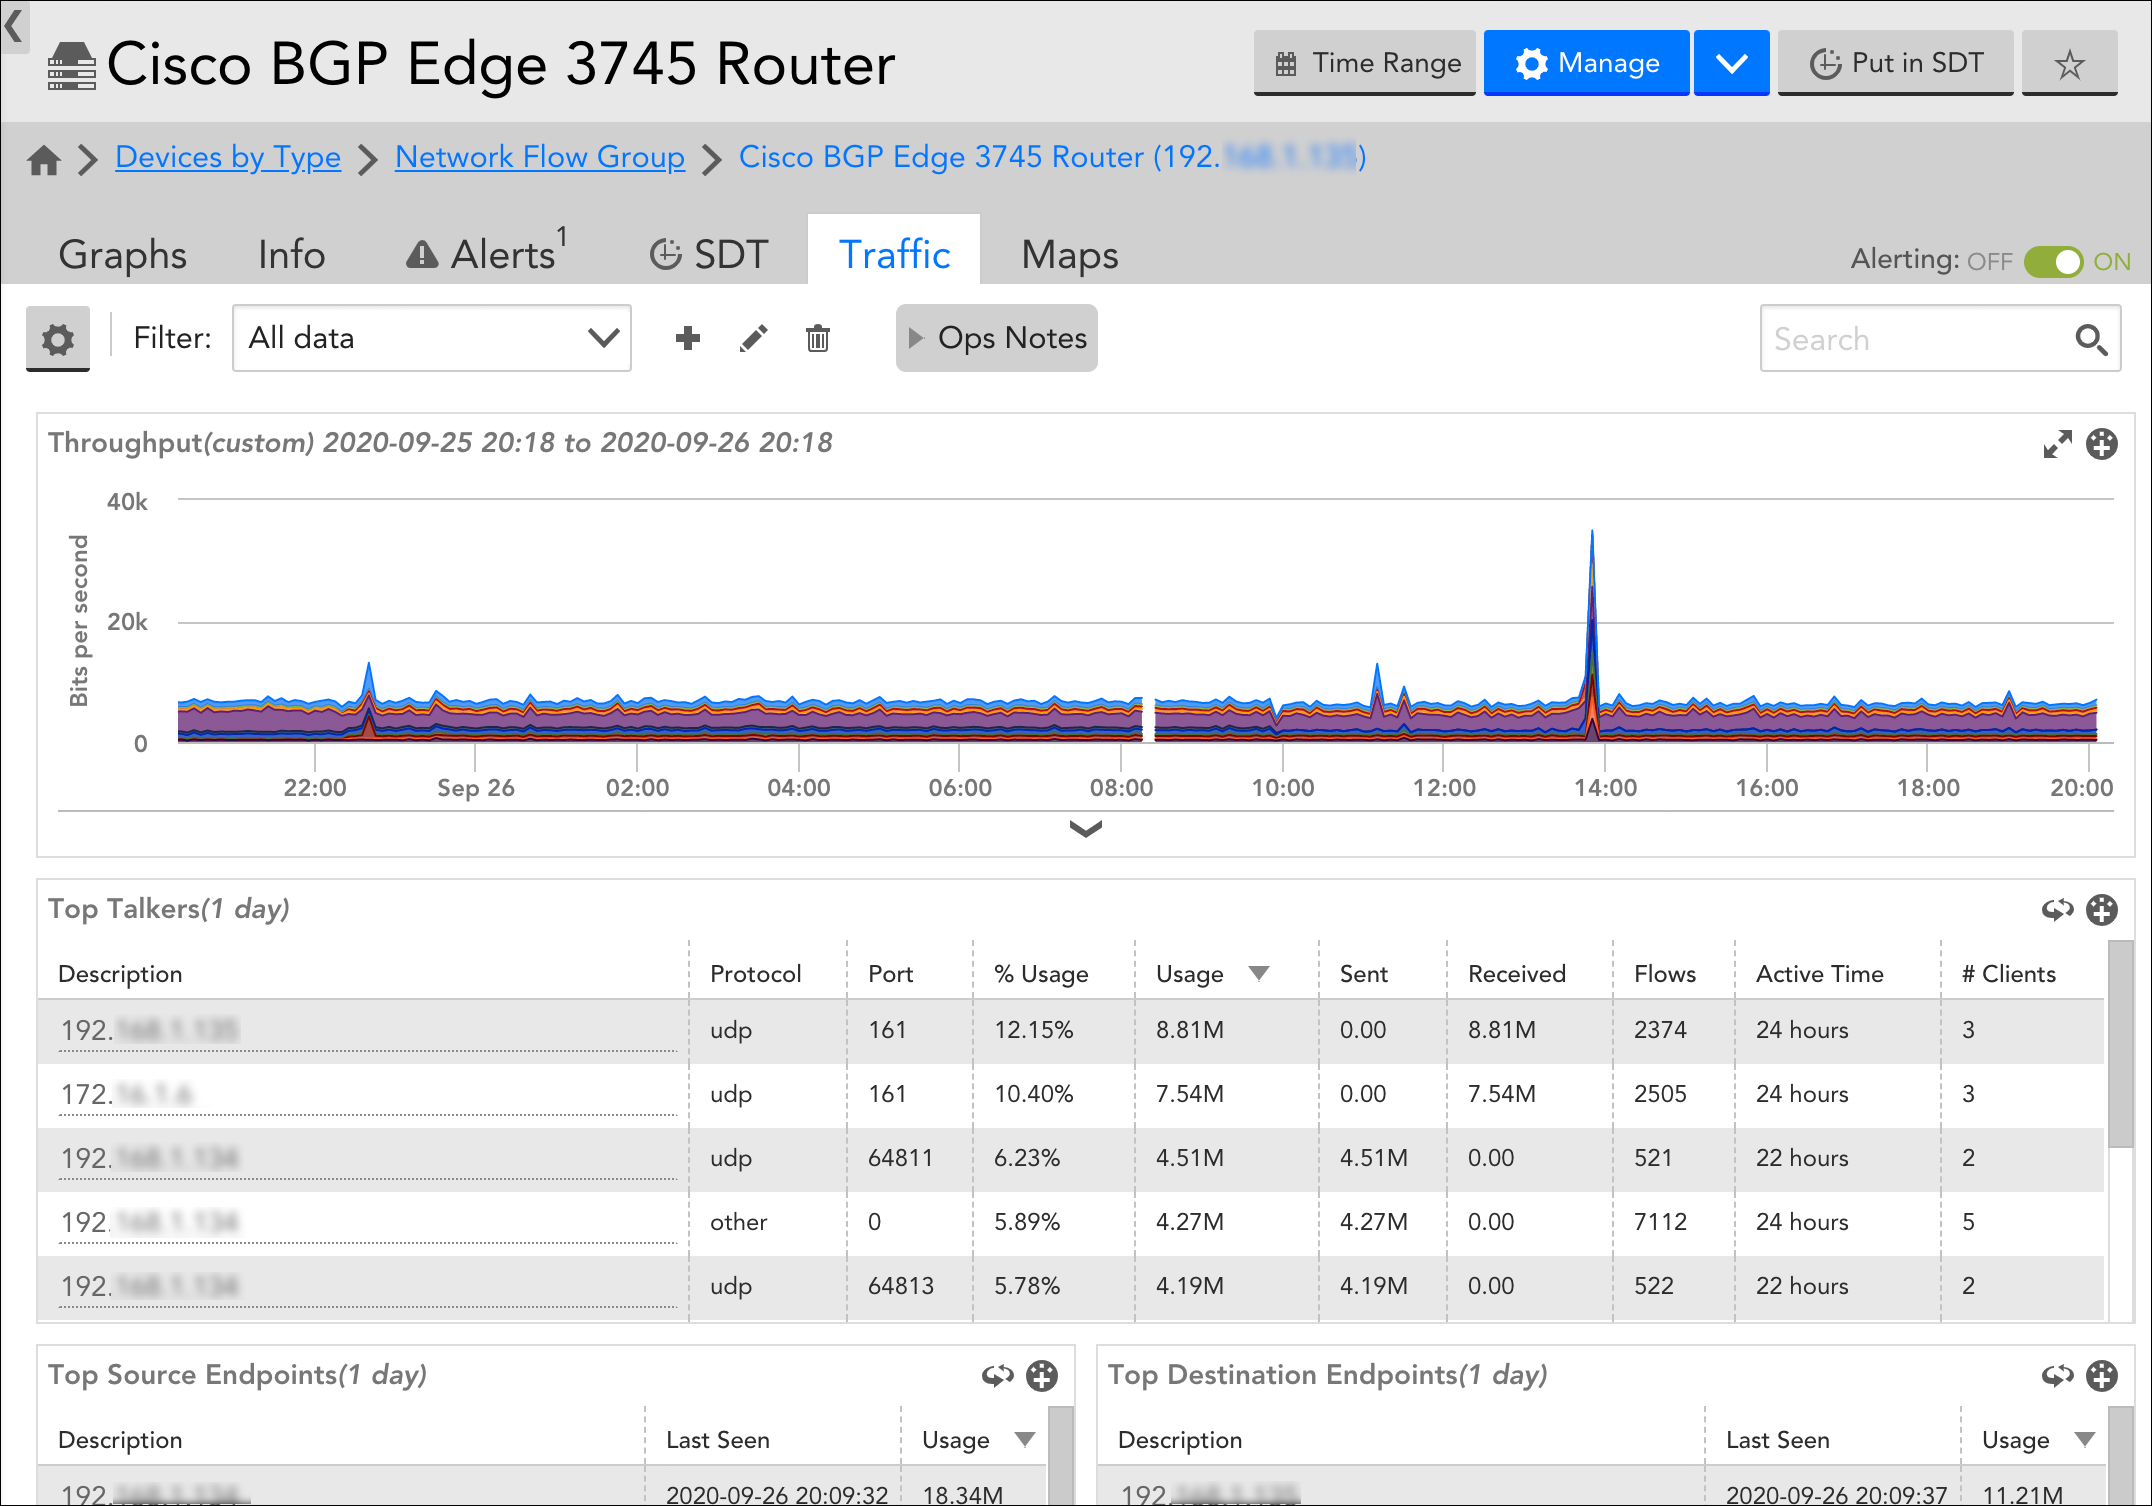
Viewing Network Traffic Flow Data
Network traffic flow data is displayed on the Resources page (specifically the Traffic tab) for an enabled device. For more information, see Viewing, Filtering and Reporting on NetFlow Data.
