


After a handful of feature heavy releases, this one brings you a centralized improvement around the Reports Page and a variety of smaller fixes and improvements.
New Reports Page
The new reports page moves away from the paradigm of a ‘tree for everything’ and into a more easy to use management layout.
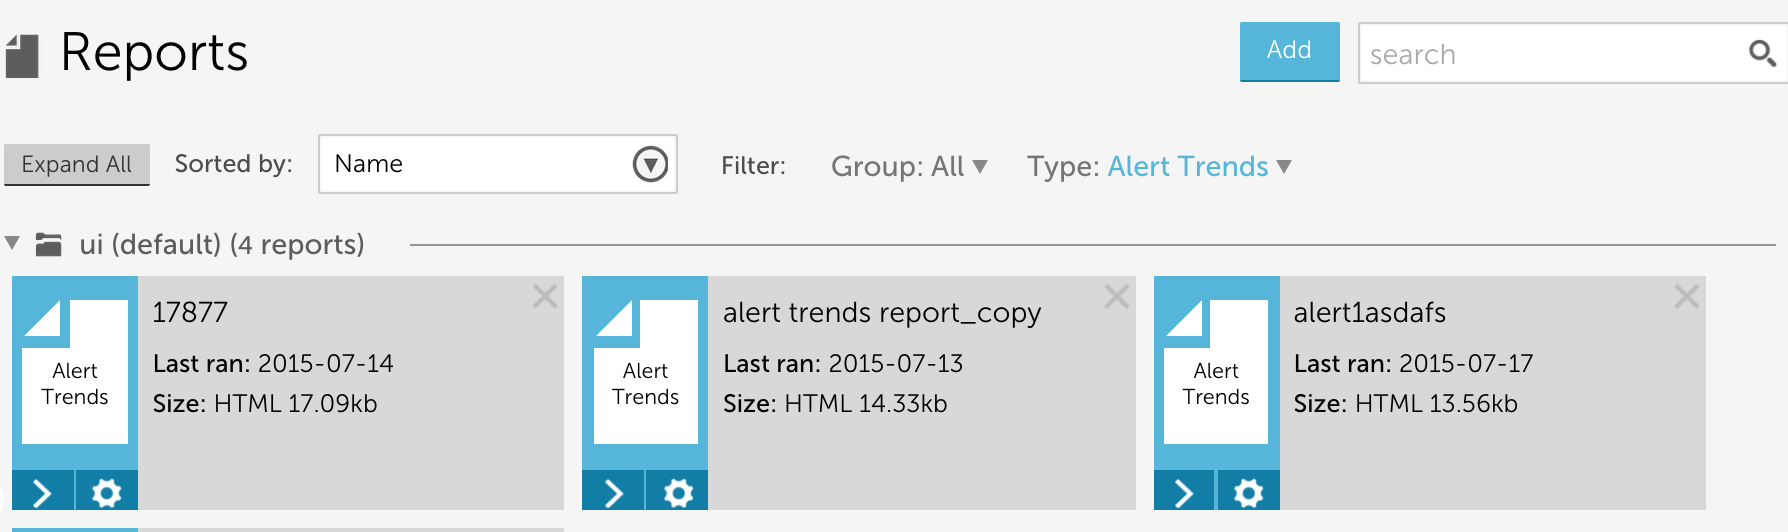
Along with a simpler layout, you now have the ability to:
- See the type, last ran date, and most recent size of each report.
- Filter reports by report type
- Sort by Group and Report Name or Last ran date.
- Run a report directly from the overview page by clicking >, or select the gear icon to configure.
- When you make report updates, easily save as a new report or overwrite the existing report.
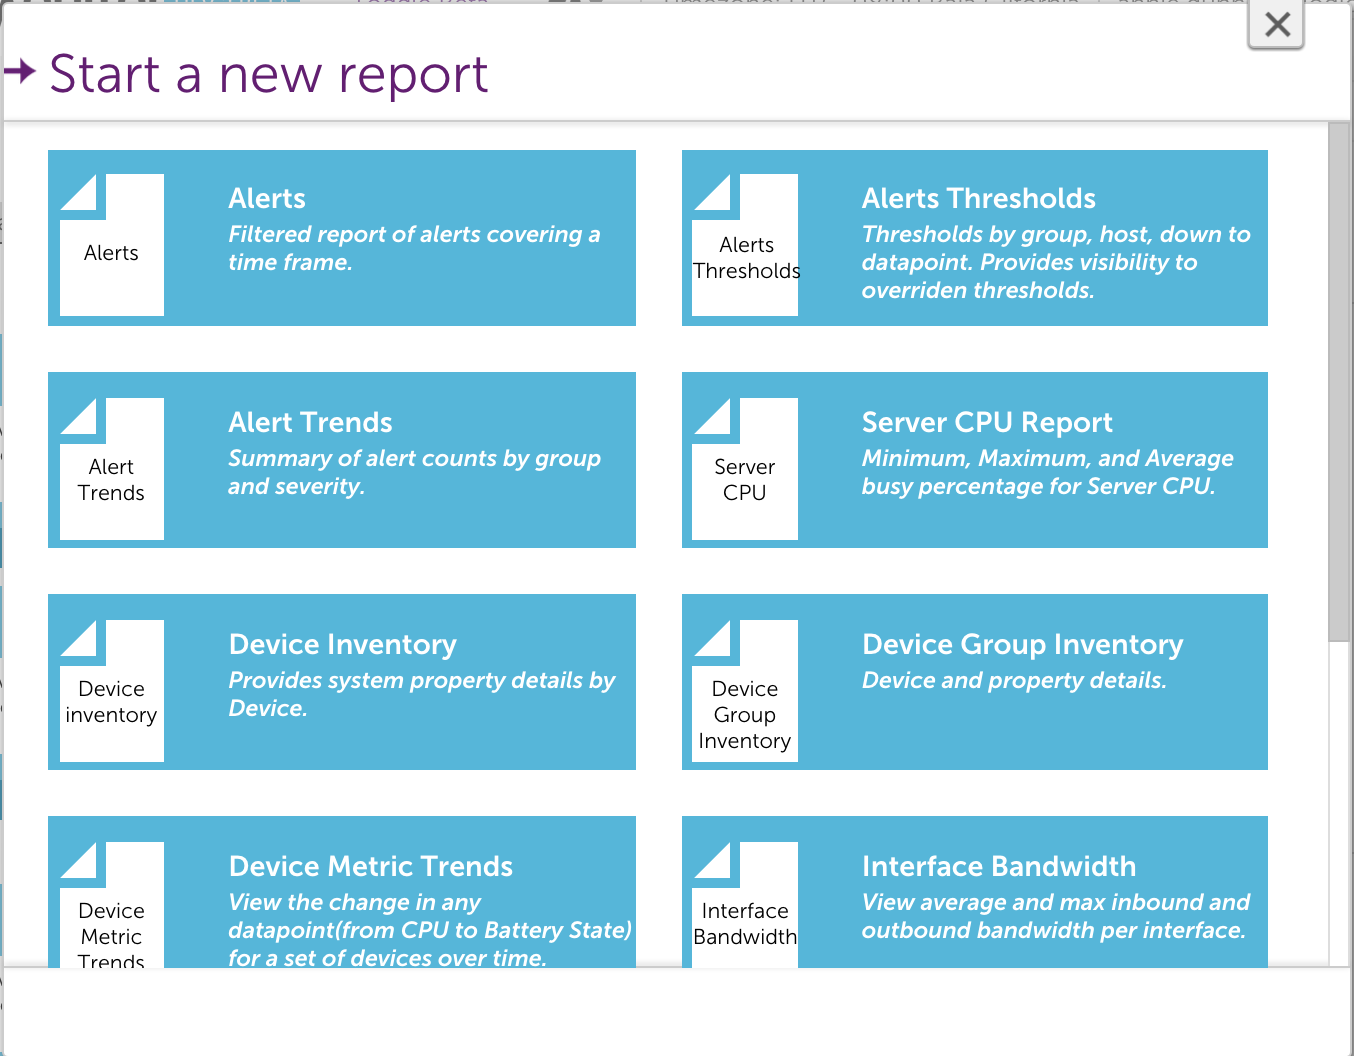
Adding a report now includes basic information about each report type to help you determine which report type meets your needs:
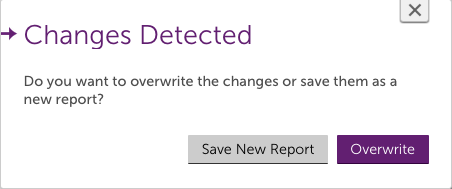
Copy a report has changed. To create a variation of an existing report, edit the existing report and when you click save you will have the option to either save the variation as a new report or overwrite the existing report.
Alerts Report Updates
You can now filter your alerts report in the same manner as your alerts page or widget.
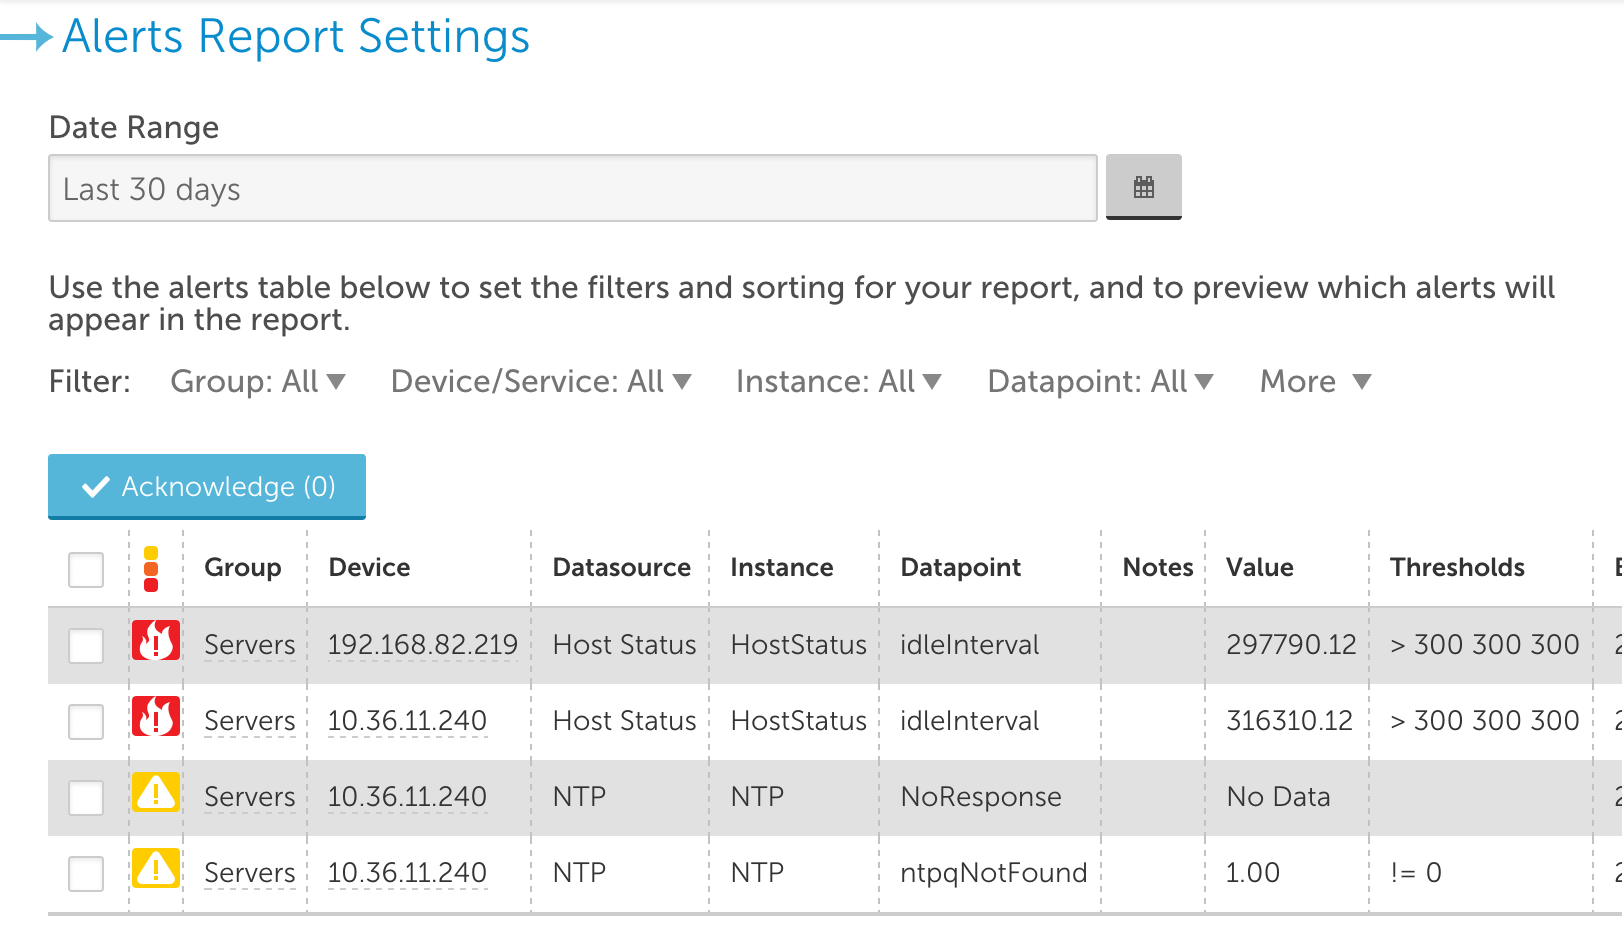
The alert view will update as you change your filters, giving you a preview of what will be included in your report.
Note: To support the new filters, the exclude option has been removed from the Alerts Report. To exclude an item (or items), use a glob expression (!host1|host2, or !*dev)
Services Alert Improvements:
The following new tokens are available for Service Alert Messages:
- ##SERVICEDESCRIPTION## – returns the custom description of the Service
- ##URL## – returns the URL of the Service
- ##SERVICEGROUP## – returns the group the Service is a member of
See [intlink id=”2950″ type=”page”]this page[/intlink] for a complete list of our Service Alert Message tokens.
Other Improvements:
Please note, user interface improvements and bug fixes are assumed to apply to the new UI view.
- Added option to clone an entire dashboard.
- Updated debug commands as they are displayed in the access log to only include the initial command, to limit length and to avoid password information from being included.
- Confirmed that all actions on the settings tab (add, update, delete) are logged in the Access Log.
- The Google Map widget now includes alert status.
- Datasources are now arranged by datasource group in the ‘All Datasources’ device dashboard.
- Removed the limit on how many datasources were displayed for search results in the Datasource tree of the Settings tab.
- Search is standardized to use glob rather than glob and regex, enabling more control over results.
- Thresholds column added to the datapoint table for datasource templates in the Settings | Datasources.
- Password change will require users to re-sign in.
- Manage button is removed completely if user does not have rights to manage a device or service.
- Item name in the NOC widget will default to the Group By value.
- Upon login, collector down messages will only appear for users with access to the Collectors page.
- Specifying a user is not required for a recipient group to allow for recipient groups that send to arbitrary emails.
- Rather than always attempt to display all devices in a group in the device tree, potentially causing delays in display time, an option for “See More” will display for groups with over 100 devices.
- Updated the account management page to include more clarification and flexibility with logo sizes and types.
- When adding Processes and Services to be monitored from the Device | Manage | Add Other Monitoring | Additional Monitoring screen the dropdown list now displays in alphabetical order.
Bugs fixed:
Bug fixes related to the User Interface are assumed to be fixed in the new UI view.
- A blank device or device group property could previously be created, causing collector issues. Blank properties are no longer allowed, and will not disrupt data processing if they occur.
- When a website overview report is executed data will only appear for services the user has access to view.
- Extra columns in the CSV version of the Alert Status report were removed.
- All datasource imports are recorded in the Access Log, addressing an issue where datasources with long display names resulted in an exception.
- Alert thresholds can be now be set to a negative number in the new UI.
- The Alert widget has been corrected to display critical alerts first when sorted by severity.
- Fixed an issue that resulted in dashboard graphs not being appropriately reordered.
- Deleting a host no longer resets the device panel view back to the top of the tree.
- When adding a device from the not monitored group, collectors will display in numerical order.
- The time 00:00 can now be added as an end time in time-based escalation chains.
- Fixed a bug that occasionally caused column width to revert to default rather than the last configured size.
- New UI now supports an empty escalation chain stage.
- Execute Now was previously only available for Netscan policies where a change was made, and is now available for all Netscan policies regardless of whether a change was made or not.
- Clarification has been added to the Gauge widget for defining virtual datapoints.
- Alerts with no escalation chain are now appropriately filtered from the alerts table when the escalation chain filter is used.
- Alerts were not displaying in the device page for datasources with a comma in the display name. The comma is now handled correctly.
- Alert durations were calculated based on start time until current time. That’s too long. They are now calculated based on start time until clear.
- User table in Settings | Users has been corrected to enable sort by Role.
