
LogPatterns
Last updated – 22 March, 2026
LogPatterns in LM Logs automatically group similar log messages, highlight high-frequency events, and surface trends and anomalies. This feature reduces log noise, accelerates troubleshooting, and helps identify the root cause of issues, especially in environments with high log volume.
LogPatterns are valuable for Managed Service Providers (MSPs), DevOps teams, and site reliability engineers by improving log visibility and reducing mean time to resolution (MTTR).
LogPatterns condense raw log data by identifying recurring structures. Each monitored resource generates a log profile, which stores the pattern structure, count, and timestamp of the first match. These profiles support both:
- Pattern grouping— Organizes logs with the same structure.
- Anomaly detection— Flags logs that do not match existing profiles.
For more information, see Log Anomaly Detection.
LogPatterns provide the following benefits:
- Automated log grouping—Reduces noise and simplifies identification of patterns and outliers.
- Pattern-based filtering—Highlights rare or unique logs by filtering on structure, not individual lines.
- Faster troubleshooting—Surfaces unusual logs quickly, improving MTTR and root cause analysis.
They streamline analysis by surfacing only what is new or unusual. This approach makes it easier to detect early signs of issues and scale log monitoring effectively.
LogPatterns are accessible from Alerts, enabling you to analyze log activity in the context of active issues. From the alerts, you can use the Compare Patterns capability to evaluate how log patterns change across different time ranges. It is designed to support anomaly investigation and incident response workflows.
LogPatterns Use Cases
The following are some of the LogPatterns use cases:
- Efficient issue troubleshooting in Alerts—In any LM alert with logs, use the Logs tab to filter and highlight rare messages. This helps teams focus on potential issues while ignoring common noise, making troubleshooting faster and more effective. Example: A rare log appearing just before an incident could reveal the root cause.
- Managing Log Overages and Costs—Exceeding log limits can lead to unexpected costs. Instead of disabling logs entirely, LogPatterns helps filter out unnecessary recurring logs, reducing ingestion without losing critical visibility. You can use the Logs tab on a Resource or the Logs Homepage to optimize costs efficiently.
- Anomaly Review and Log Hygiene—Many teams review logs weekly to keep them clean and error-free. LogPatterns help by:
- Identifying if an anomaly has become a recurring log
- Confirming when an issue is resolved and no longer appears
Using LogPatterns within the alert workflow supports troubleshooting, while using them from the Logs page or Resource tree supports broader, proactive analysis.
Requirements for Accessing LogPatterns
An active Logs subscription or trial SKU must be available.
Considerations for Accessing LogPatterns
The following limits ensure LogPatterns remain efficient and usable:
- LogPatterns does not replace traditional log search but acts as a supplementary analysis tool to improve troubleshooting speed and log hygiene.
- On the Alert Overview page, results are limited to 20,000 logs. The default time window includes 1 minute before and 1 minute after the alert.
- On the Resource Tree page, logs are displayed for the most recent 15 minutes of the selected time range by default.
- On the Logs home page, results are limited to 20,000 log entries. To avoid missing data, refine your query by selecting a smaller time range or adjusting your search filters. If the result exceeds 20,000 entries, no warning message is displayed.
Viewing LogPatterns from Alerts page
You can access LogPatterns from Alerts page, enabling you to view log patterns directly in the context of a single alert. Additionally, you can use the Compare functionality to evaluate how log patterns change for that alert across different time ranges, helping you identify meaningful shifts in log behavior.
- In LogicMonitor, go to Alerts, and select the alert you want.
- From the alert details panel, select the Logs tab.
- Toggle the Show as Patterns switch to view logs in patterns.
When Show as Patterns is enabled, you can use the Compare functionality to evaluate the log pattern changes.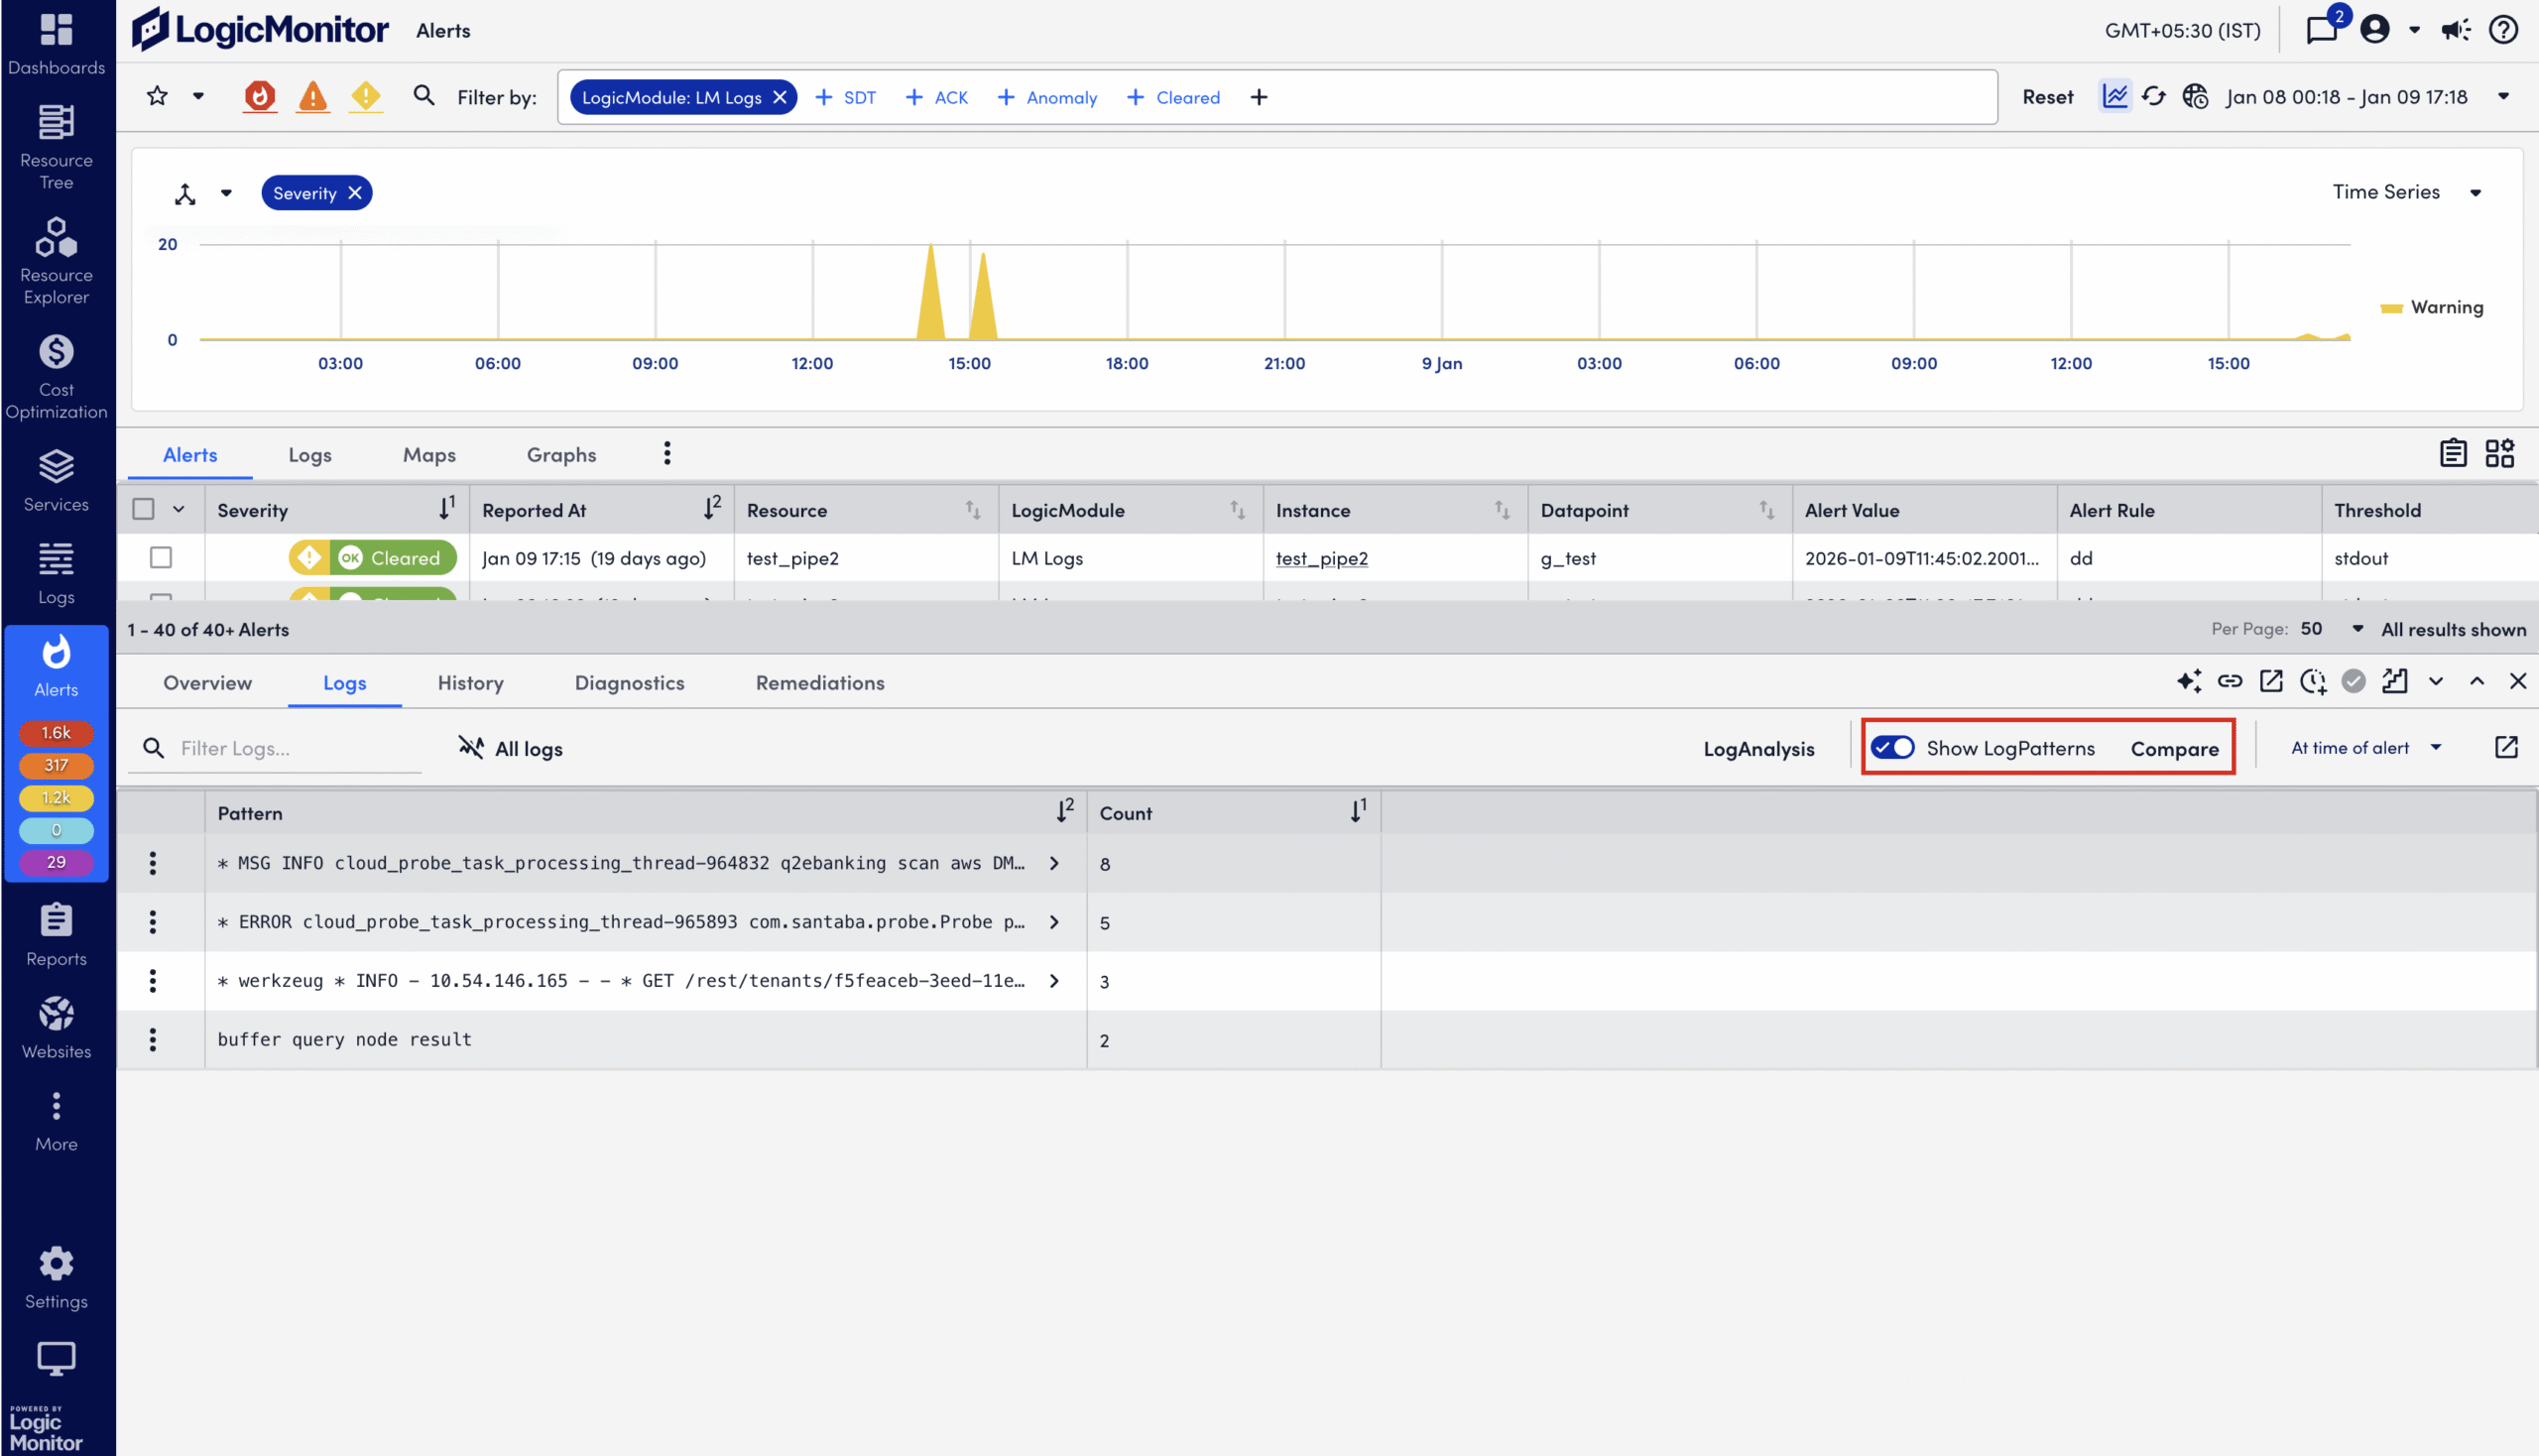
- To compare LogPatterns, select Compare and do the following:
- In the Compare Patterns dialog box, select the Second Time Period.
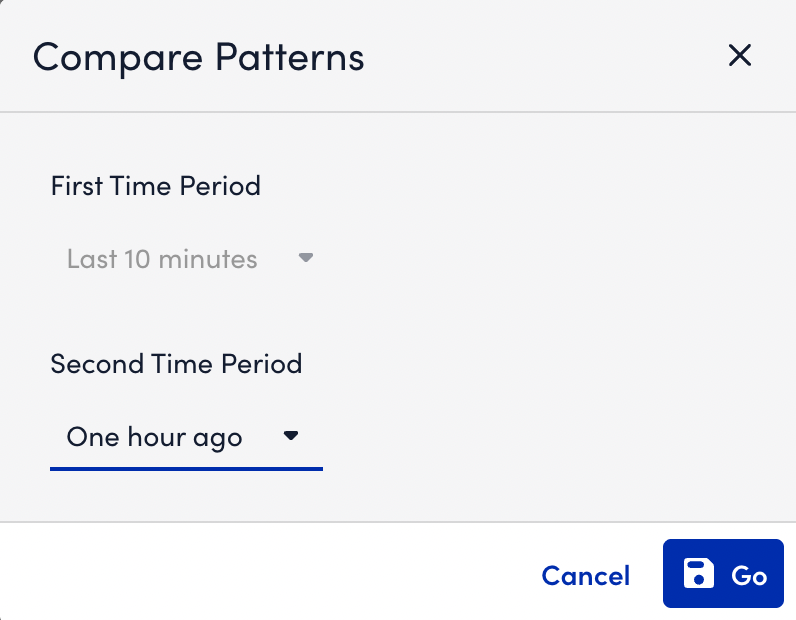
- You can choose one of the following compare ranges:
- 1 hour ago
- 1 day ago
- 1 week ago
- 1 month ago
- Custom range
- (Optional) If you select Custom range, choose a start date and end date, then apply the selection.
- In the Compare Patterns dialog box, select the Second Time Period.
Note: The first time period is automatically set based on the time range selected in the time picker before opening the Compare dialog box. When using a custom range, the start time must be earlier than the end time.
Review the updated comparison results in the table.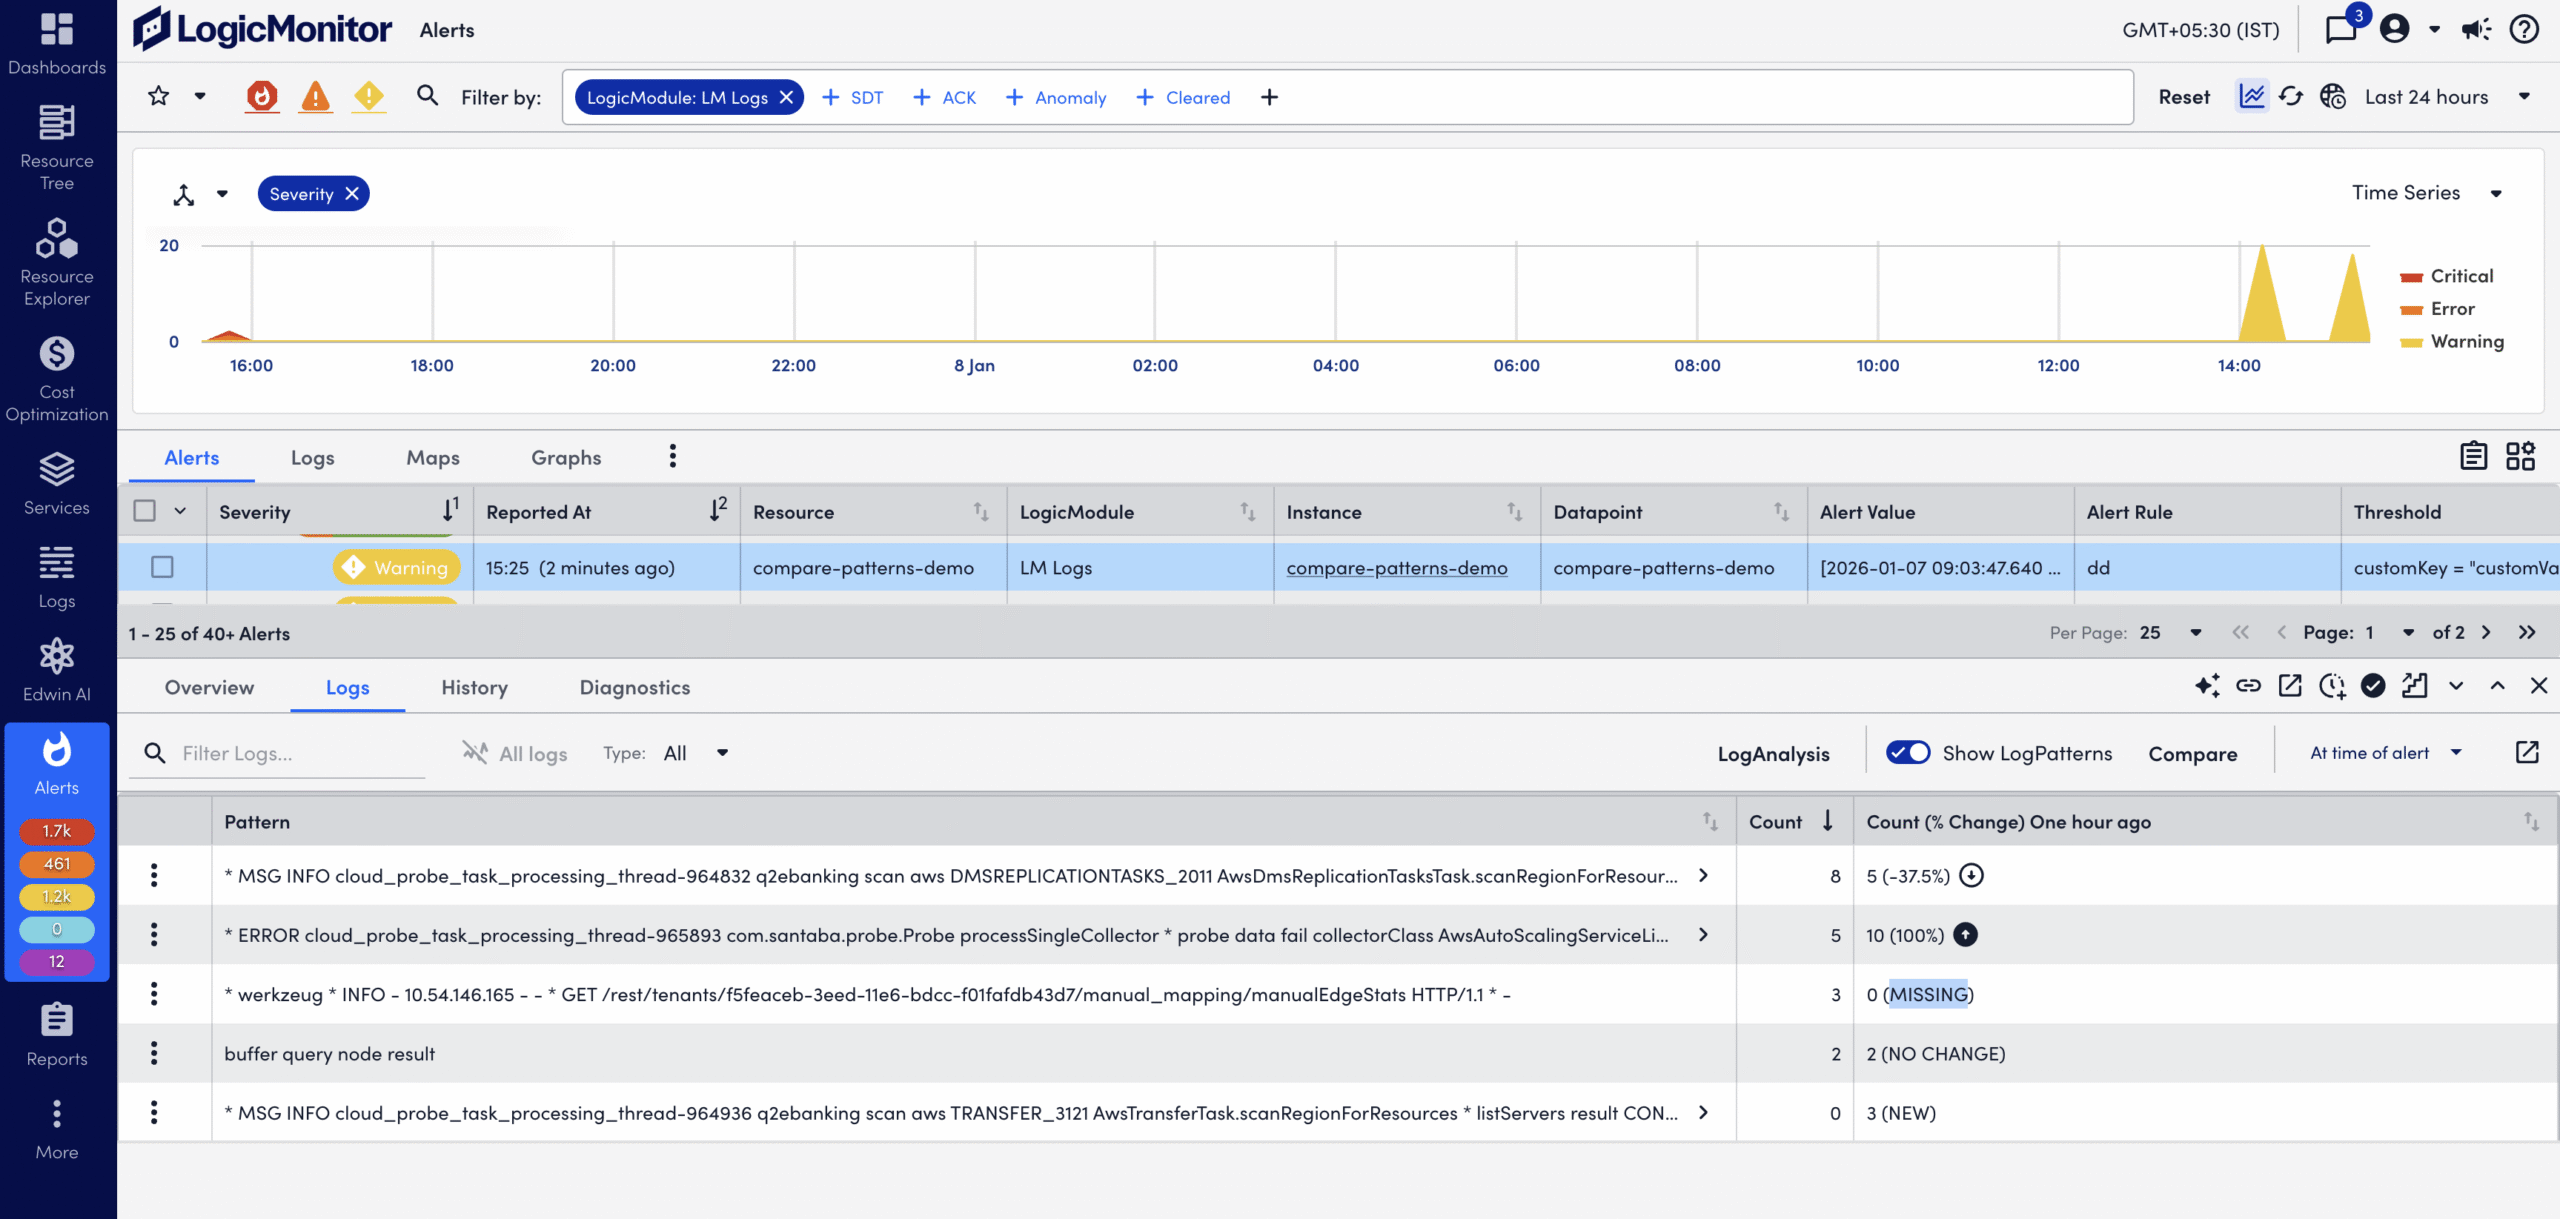
After comparison, LogicMonitor updates the table with additional columns that describe how each pattern changed between the two time periods.
Pattern Type values are determined as follows:
- Increase —
CompareCountis greater thanCount - Drop —
CompareCountis less thanCount - Missing —
Countis greater than 0 andCompareCountequals 0 - New —
Countequals 0 andCompareCountis greater than 0 - NoChange —
CountequalsCompareCount
Viewing LogPatterns from Resource Tree
- In LogicMonitor, go to Resource Tree, and select the resource or resource group you want.
- From the Resource details panel, select the Logs tab.
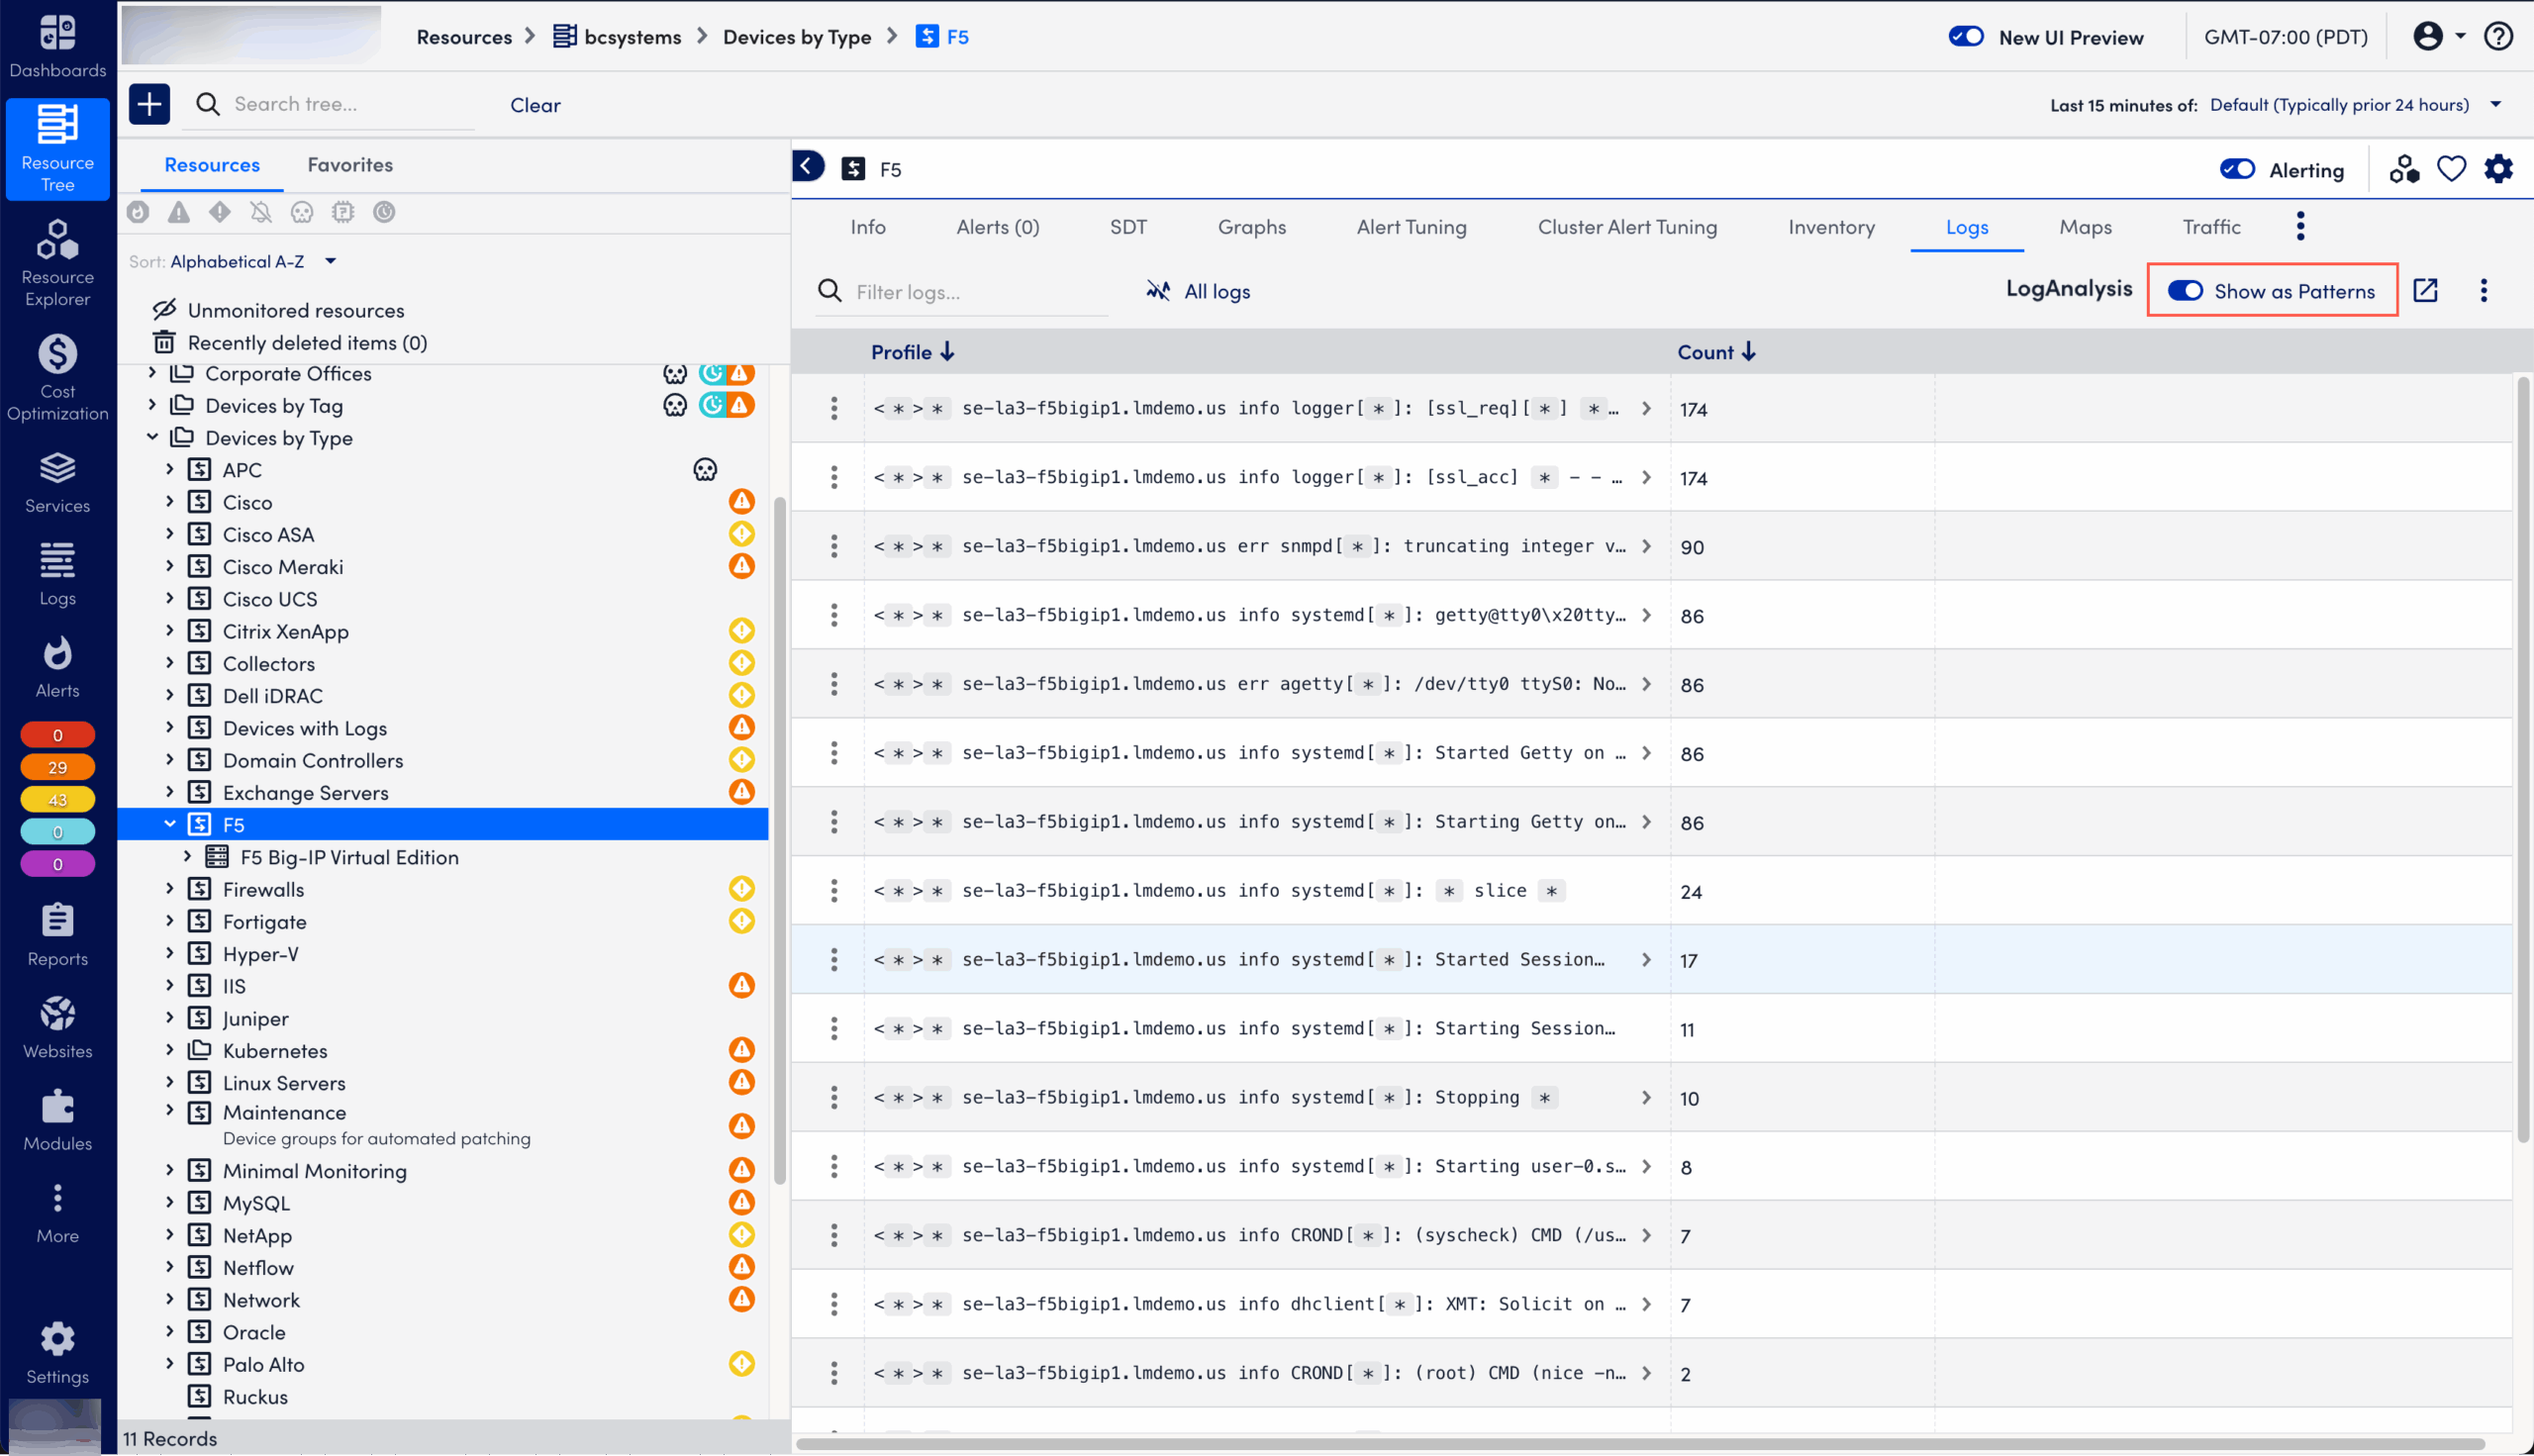
- Toggle the Show as Patterns switch to view logs in patterns.
- To view the query profile of the LogPattern, select
 More and then select Query profile.
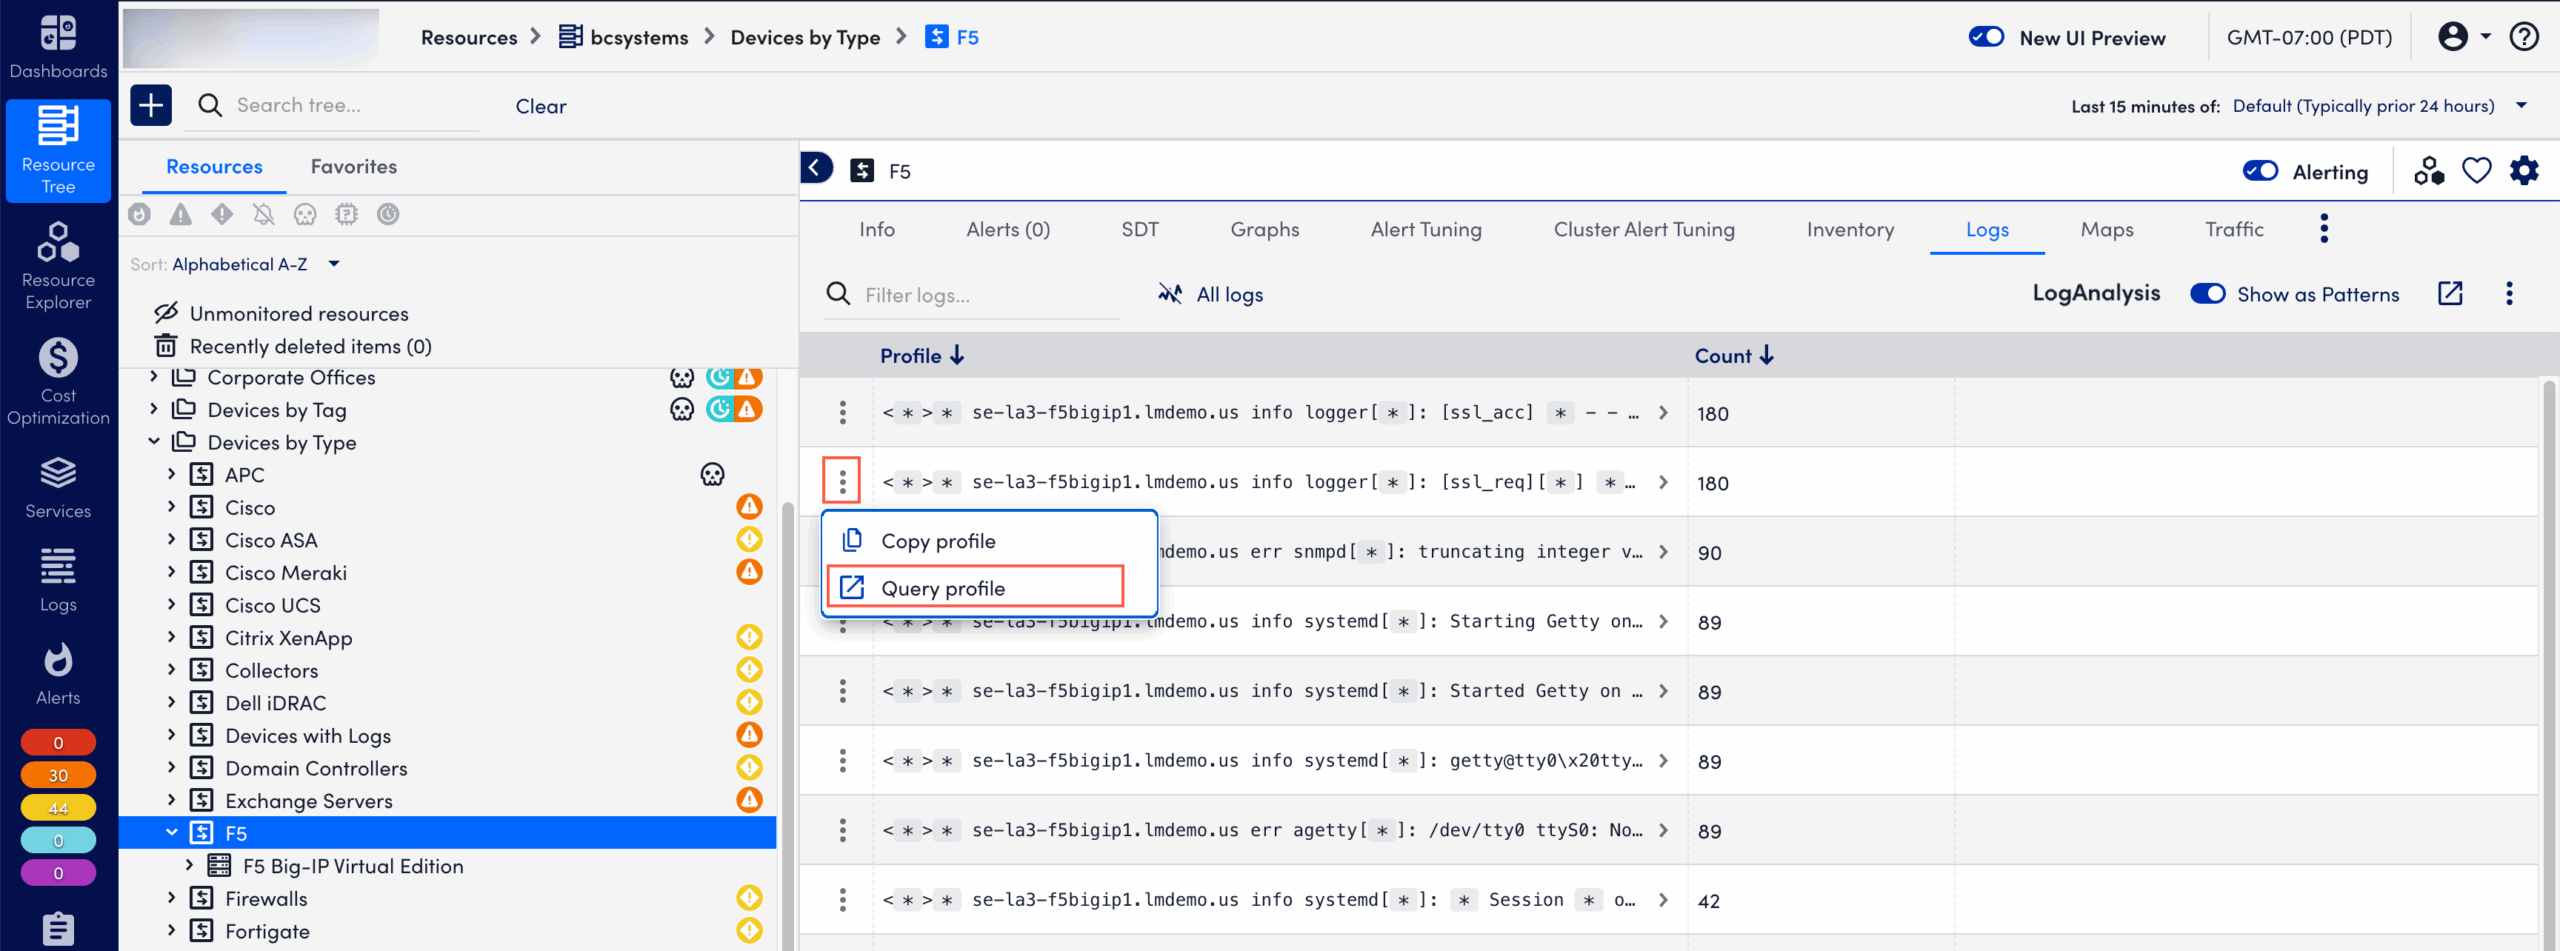
The selected query is displayed in a new window.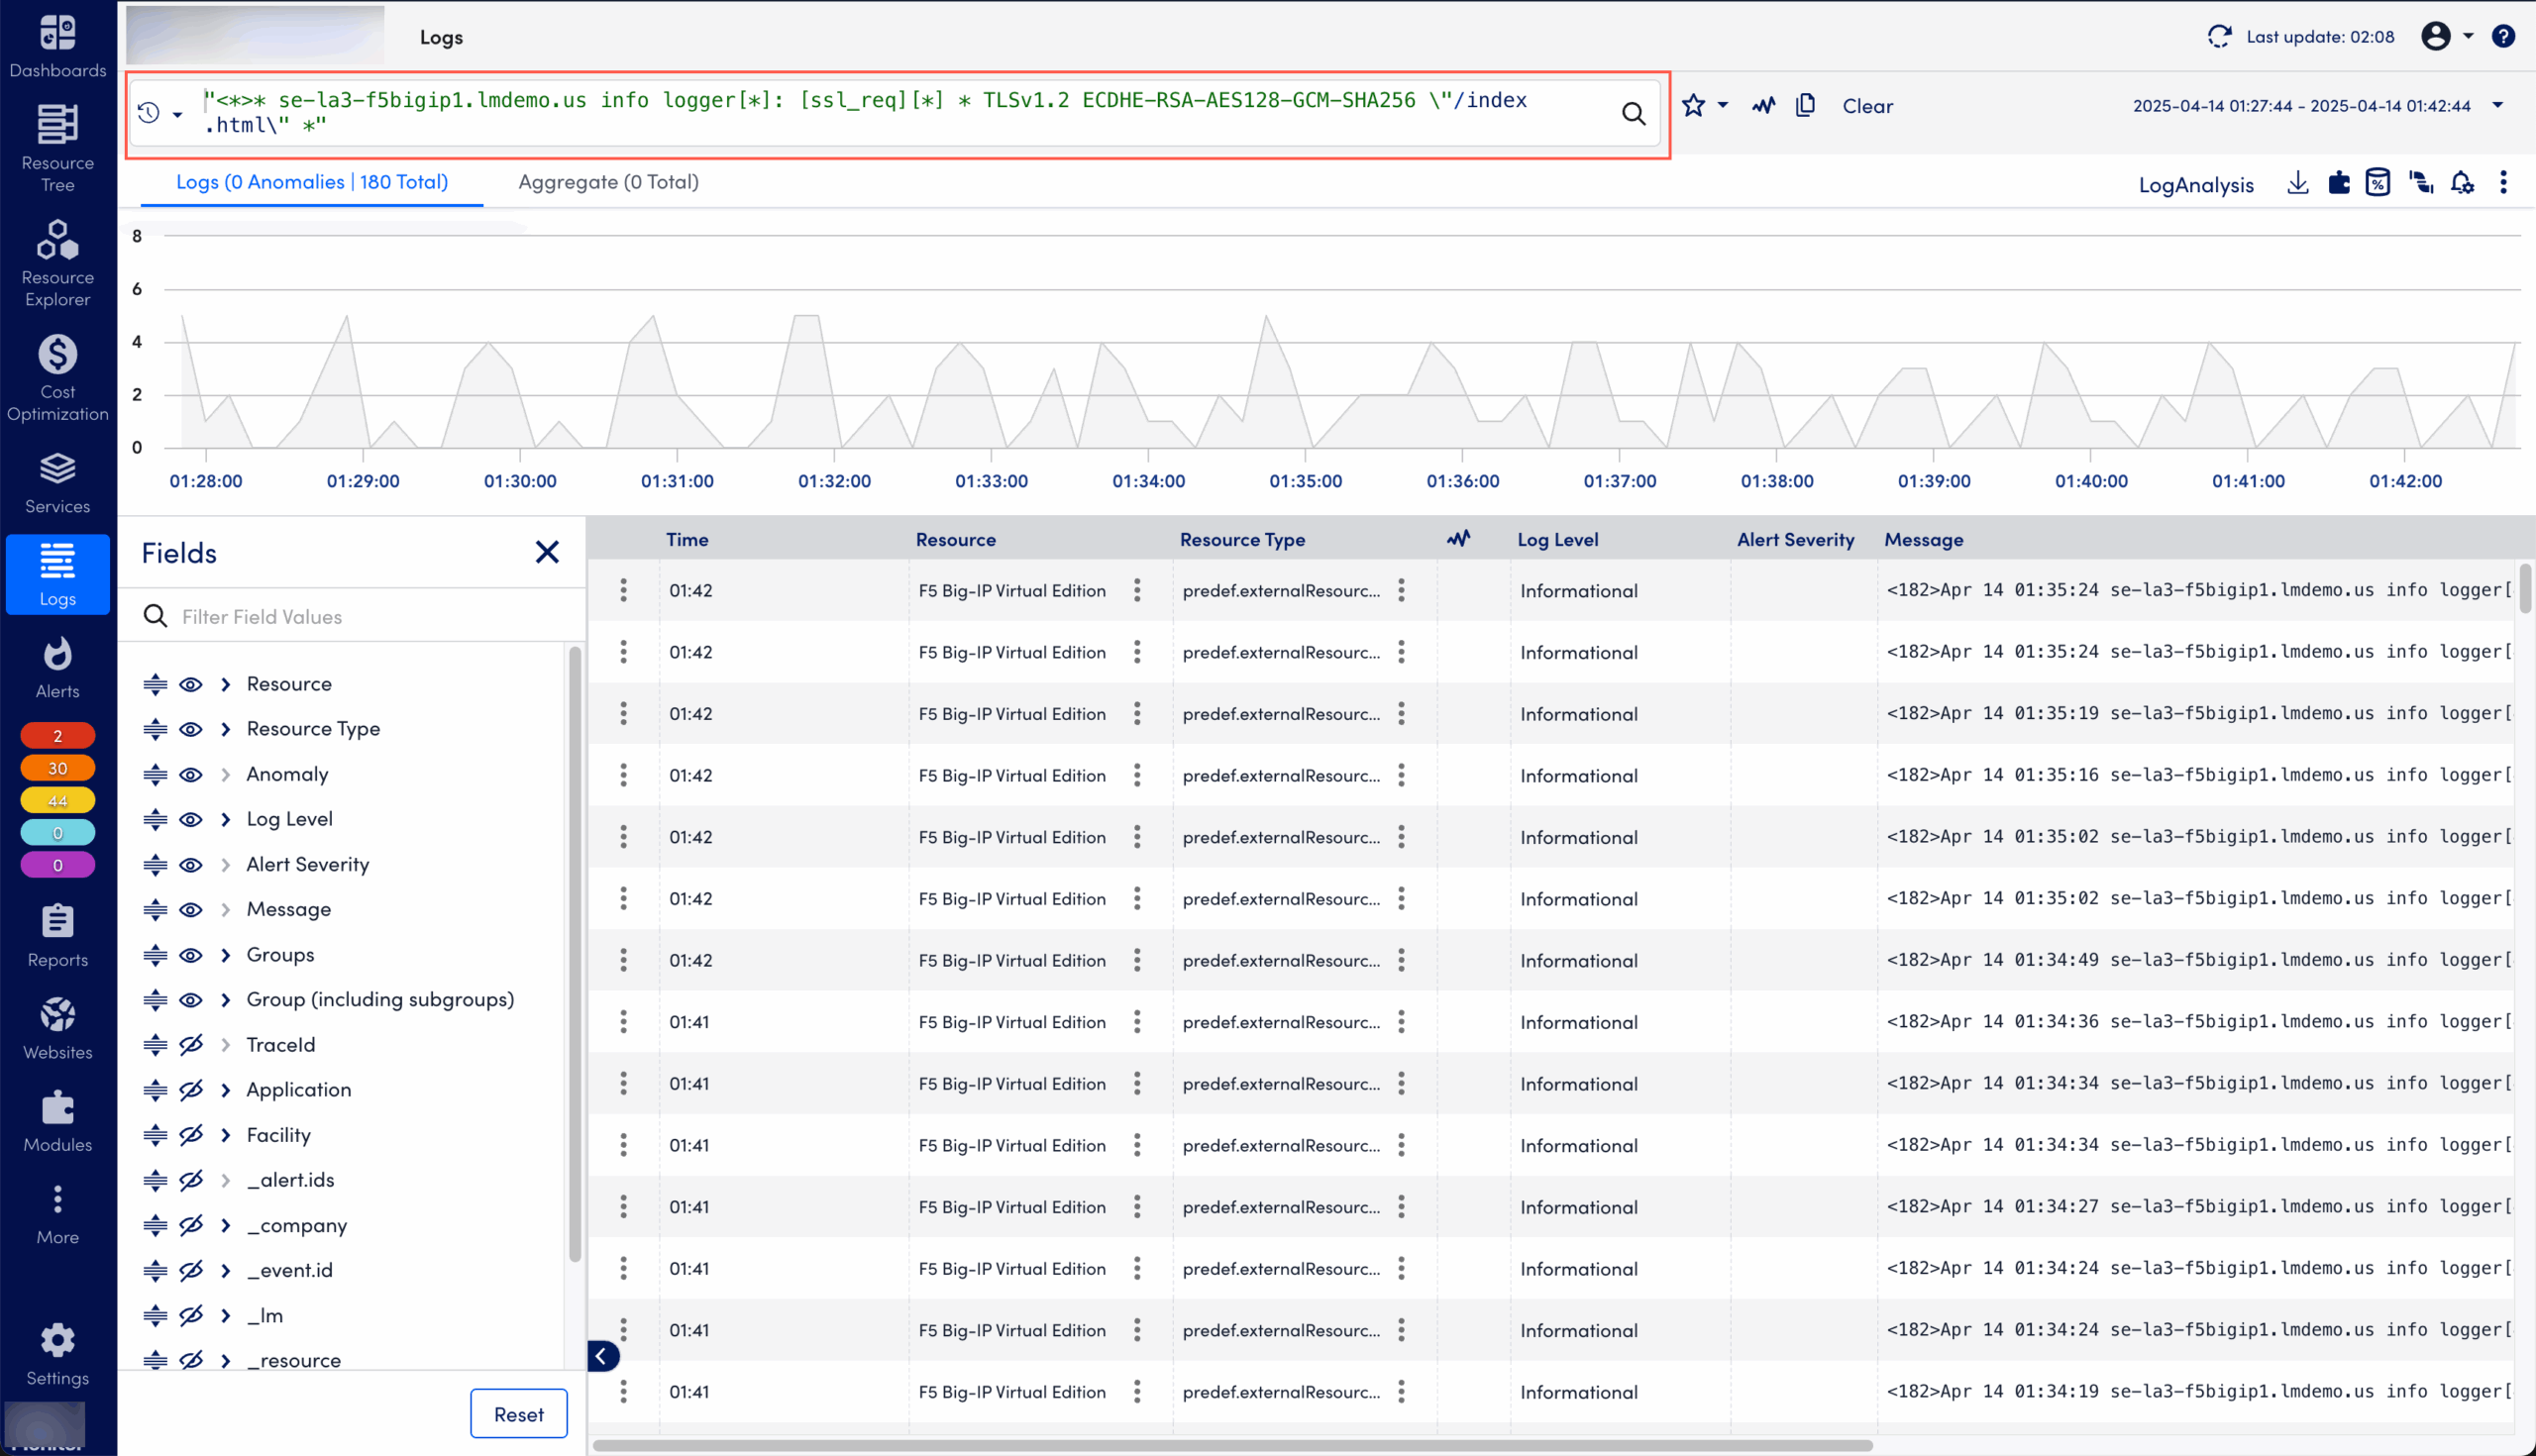
The logs table lists the aggregated count of log profiles for the current query, for the selected time range. You can see profiles for any selected time range up to 30 days, default is 5 minutes. For example, a current query shows a total of X log events registered within the last 5 minutes. These are reduced to X log profiles that can be further investigated.
