
Appearance and Sounds
Last updated - 10 November, 2025
You can customize the look and feel of your portal using the Appearance and Sounds settings. For example, you can use these settings to configure your date and time preferences, the formatting of the alerts in your portal (including the playing of a sound for incoming alerts based on severity), and whether or not to display a description at specified levels in the Resource Tree. In addition, you can change the order of the navigation panel to best fit your environment.
Configuring the Appearance and Sounds Settings
- In LogicMonitor, navigate to Profile > Appearance.
The Appearance & Sounds settings panel displays. - In the Date & Time settings, configure how you want the time format to display in your portal by doing the following:
- Select 12-hour or 24-hour depending on how you want the time formatted in your portal.
- Select Compact or Full to depict.
Selecting “Full” enables you to choose the date time format for how you want all timestamps displayed in your portal.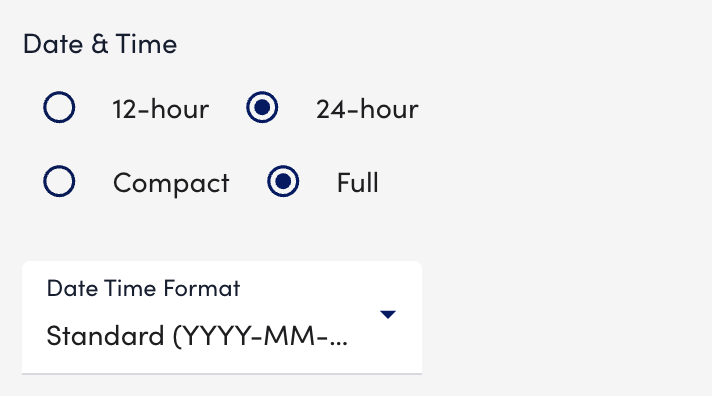
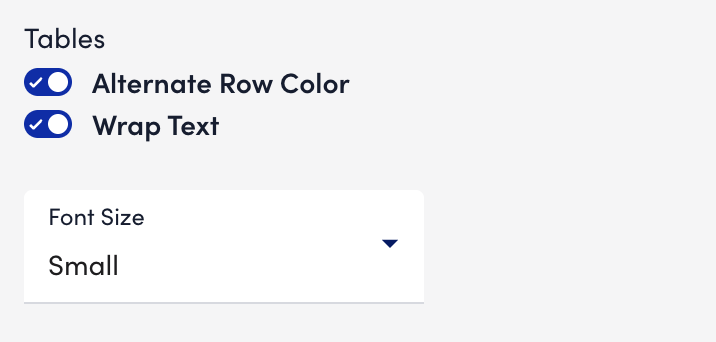
- In the Tables settings, configure how you want all tables (for example, the table of alerts on the Alerts page) in your portal to display information by doing the following:
- Toggle the Alternate Row Color switch to enable a color for every other row.
- Toggle the Wrap Text switch to enable table cells to wrap the text to fit the size of the cell.
- From the Font Size dropdown menu, choose the size of the font you want displayed in all tables.
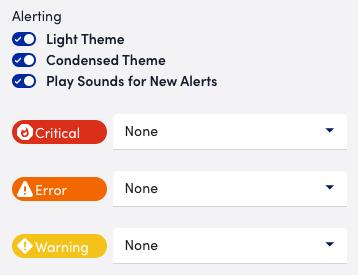
- In the Alerting settings, configure how you want the alerts formatted in your portal, including whether or not to play a sound for incoming alerts by doing the following:
- Toggle the Light Theme switch to leverage a lighter color for the alerts on the Alerts page.
- Toggle the Condensed Theme switch display alerts with an icon only.
- Toggle Play Sounds for New Alerts switch to enable a sound for incoming alerts. You can configure a different sound for each severity level.
- In the Dashboards settings, enter a dashboard that you want set as the default dashboard for your portal.
If you previously set a dashboard as a default dashboard from the Manage Dashboard settings of the dashboard, entering a new dashboard as the default removes the previously set dashboard. This behavior is reflected in the Manage Dashboard settings for both the previously set default dashboard and the newly set default dashboard.
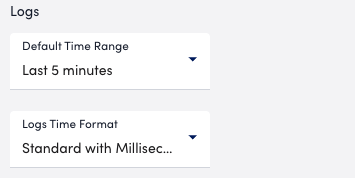
For more information about setting a dashboard as a default dashboard from a dashboard’s Manage Dashboard settings, see Dashboard Creation. - In the Logs settings, configure the time format by doing the following:
- From the Default Time Range dropdown menu, select the time range you want set as the default time range for queries on the Logs page.
- From the Logs Time Format dropdown menu, select the date and time format you want the ingested logs to display.
- In the Resource Tree Description, Service Tree Description, and Website Tree Description, toggle the level at which you want a description displayed.
This description displays for the applicable level in the respective tree.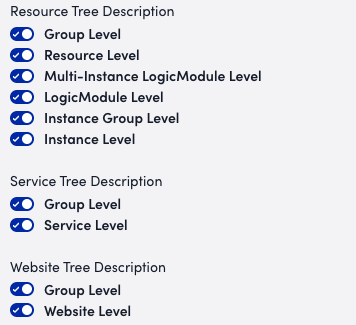
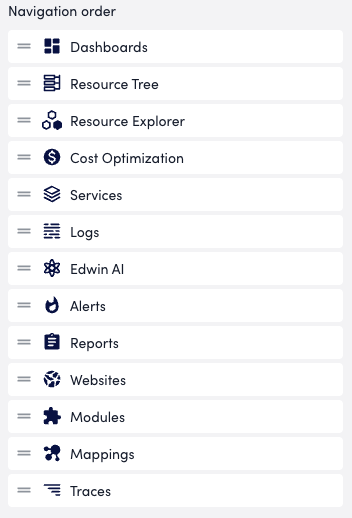
- To reorder the navigation panel, drag and drop each feature in the order you want them displayed in the navigation panel.
Any changes made in the Appearance and Sounds settings are applied immediately.
