
Aggregate Data Collection Method
Last updated - 11 February, 2026
The Aggregate Data collection method enables you to monitor and roll up metrics across multiple discovered instances or components into a single datapoint source within a module. Instead of collecting individual values per instance at each polling interval, aggregate collection summarizes values across instances using functions such as sum, average, min, or max—to present a unified view of performance or health.
This approach is useful when monitoring higher-level metrics, for example, total memory usage across all threads or average response time across multiple services to reduce data noise, highlight trends, and optimize collection overhead.
Requirements for Configuring a Datapoint using the Aggregate Collection Method
To configure an Aggregate Data datapoint, you must have appropriate permissions to edit or create LogicModules.
Configuring a Datapoint using the Aggregate Collection Method
- In LogicMonitor, navigate to Modules.
- Add a new DataSource or open an existing module to add a datapoint for Aggregate Data collection.
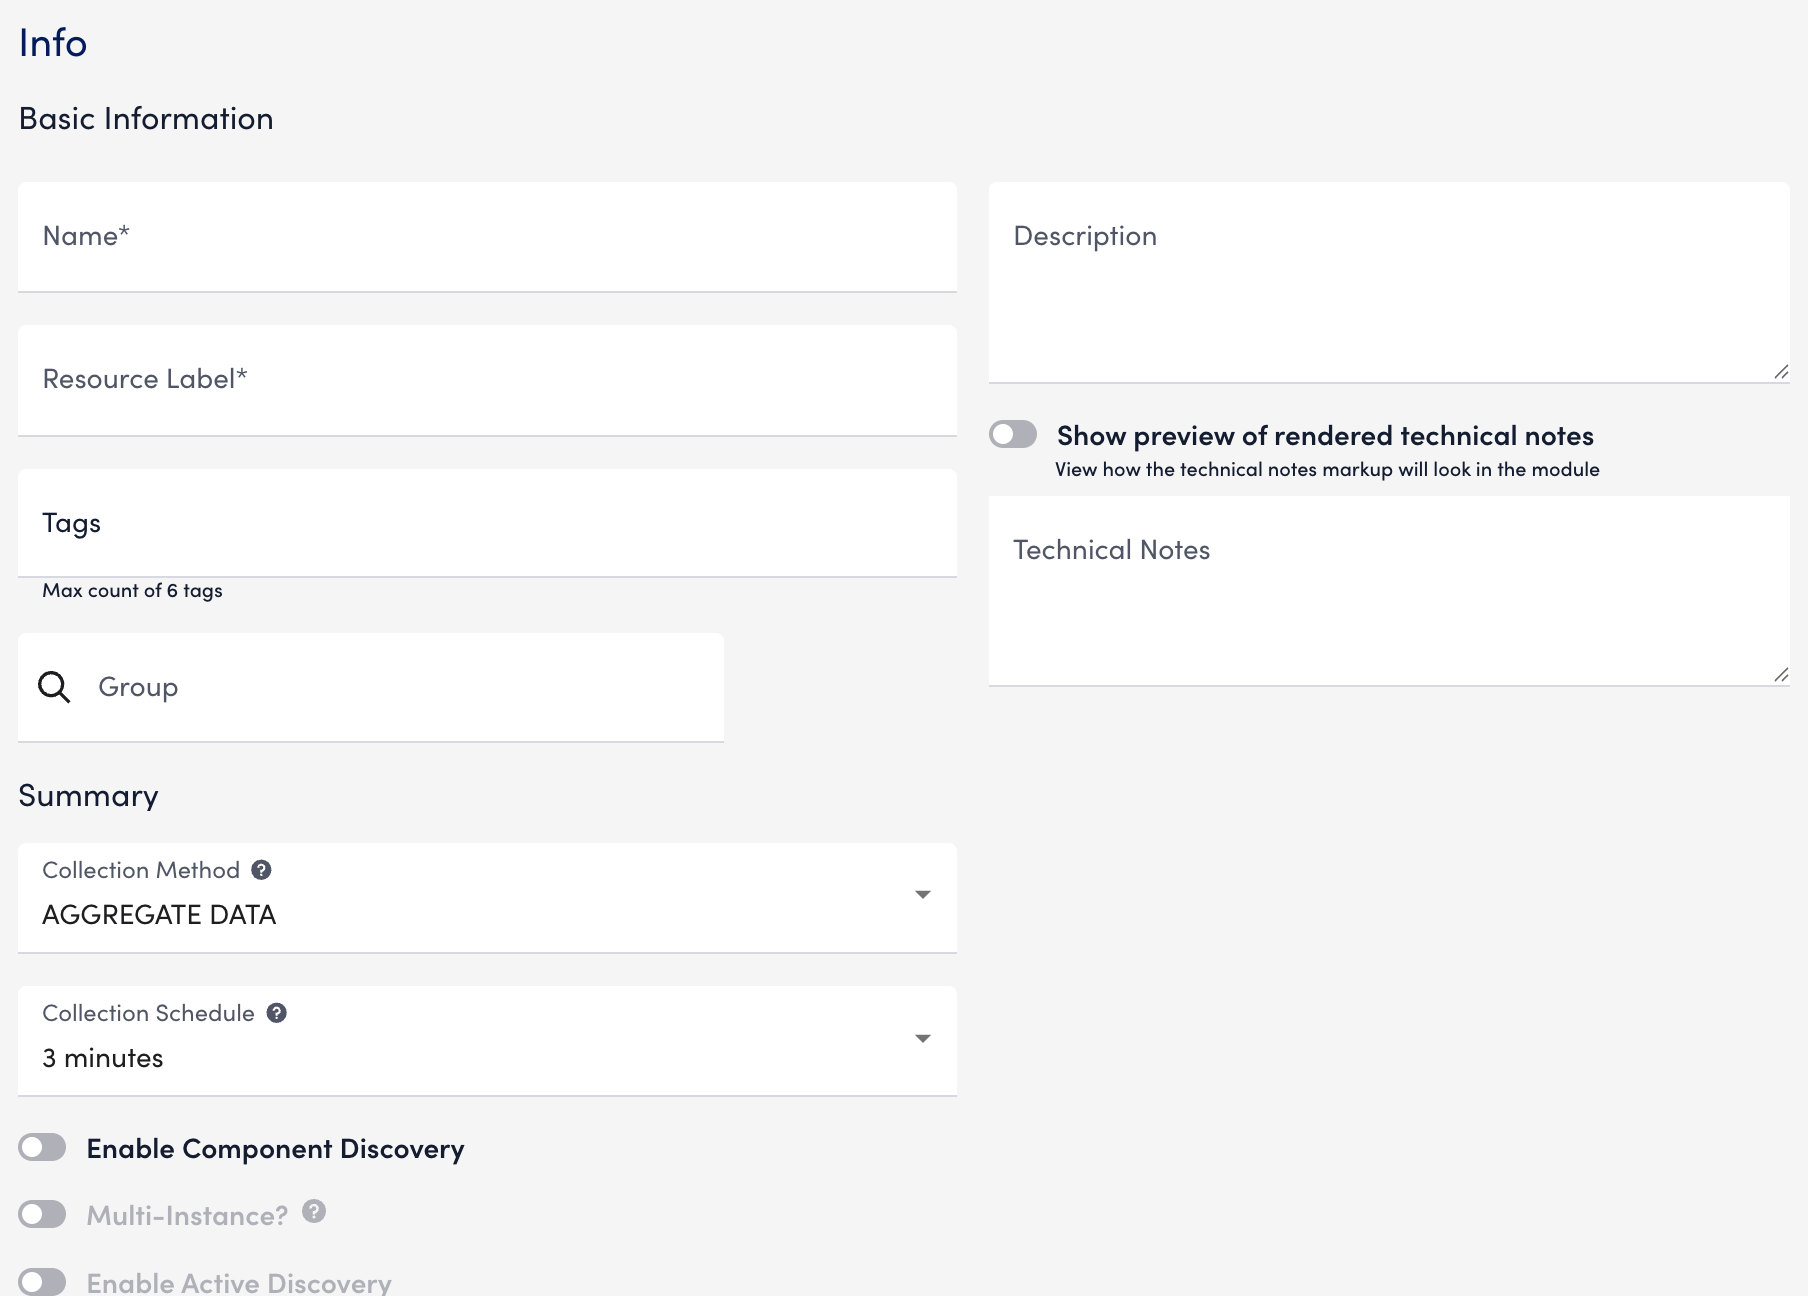
For more information, see Custom Module Creation or Modules Management in the product documentation. - In the Collection Method dropdown menu, select “AGGREGATE DATA”.
- In the Collection Schedule dropdown menu, select how frequently you want the data to be collected.
- Toggle the Enable Component Discovery switch.
The Component Discovery section displays.
This enables LogicMonitor to automatically identify and synchronize service components based on the Component Key defined in the module.
Note: The Multi-Instance and Enable Active Discovery toggles are enabled automatically when you enable Enable Component Discovery.
- In the Access Groups section, add access groups as needed to control who can view or edit the module.
For more information, see Access Groups for Modules. - In the AppliesTo section, based on your requirements add any AppliesTo scripting method. This determines which resources the module applies to.
For more information, see AppliesTo Function Scripting Overview. - In the Component Discovery section, do the following:
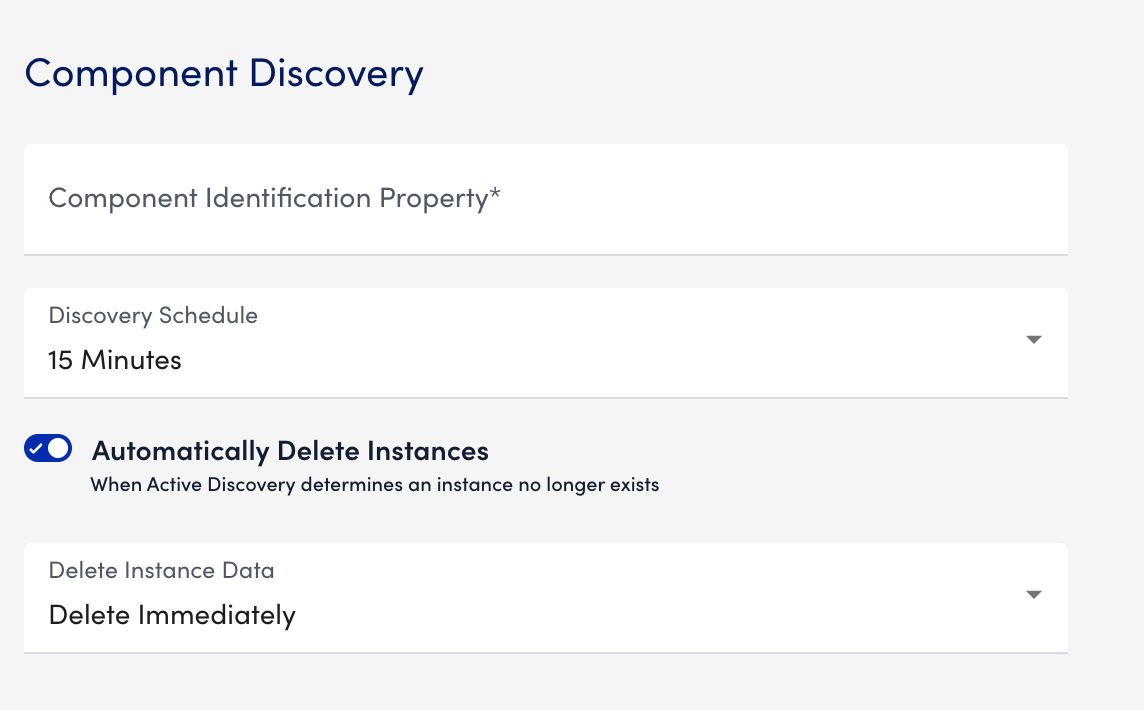
- In the Component Identification Property field, enter the LogicMonitor property key used to uniquely identify each component (for example,
system.hostnameorauto.services.component).
This key enables LogicMonitor to dynamically match discovered components during Active Discovery. - Select the time period for discovery from the Discovery Schedule dropdown menu.
- By default, the Automatically Delete Instances switch is enabled and the Delete Instance Data dropdown menu displays.
You can select one of the following option:- Delete Immediately—Instance data is deleted as soon as Active Discovery determines the instance no longer exists.
- Delete after 30 days—After you delete the instance, the instance data is retained for 30 days and then automatically deleted.
- In the Component Identification Property field, enter the LogicMonitor property key used to uniquely identify each component (for example,
- In the Datapoints section, add relevant normal or complex datapoints based on your requirement.
For more information, see Datapoint Overview. - Select Save.
The datapoint is saved for the module and you can configure additional settings for the module as needed. For more information, see Custom Module Creation or Modules Management.
