
Visual Components for Usage Reporting
Last updated - 29 May, 2026
The Usage page in your LogicMonitor portal displays key metrics that help you understand, track, and forecast your product consumption. These visual components present both current and projected usage so you can identify trends, anticipate billing outcomes, and take informed action. Each component updates based on the product you select and reflects data for the selected month.
Month-to-Date Usage Summary
The Month-to-Date Usage Summary displays the rolling cumulative usage for the selected product for the current billing month. In addition, it displays the percentage consumed of your committed amount. This component provides a high-level view of how your usage is trending relative to your subscription commitments.
Important: Historical data reflects the current committed quantity, not the committed quantity value at the time the historical record was created. Previous committed quantity values are not retained. Actual usage data is unaffected.
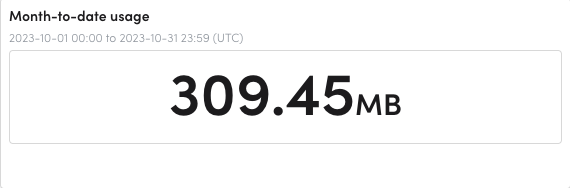
This summary helps you quickly determine whether your current usage aligns with expected consumption. If usage progresses faster than anticipated, you can investigate contributing factors early in the billing cycle.
Projected-End-of-Month Usage
The Projected End-of-Month Usage component estimates the expected total usage for the current billing period based on validated usage through the previous day. The projection assumes that daily consumption continues at the current average rate.
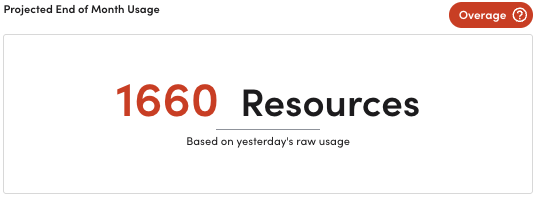
Forecasted usage helps you anticipate end-of-month totals and proactively manage your consumption. If your usage is projected to exceed your commitment, LogicMonitor estimates when and by how much the overage will occur, enabling you to plan adjustments before the billing cycle ends.
Recommendation: If your projected usage approaches or exceeds your committed amount, consider reviewing the product’s detailed usage report to identify sources of increased activity or opportunities to optimize usage.
Rolling-Month-to-Date Usage
The Rolling Month-to-Date Usage graph visualizes cumulative usage for the selected month in either a sparkline or bar graph format. This graph updates dynamically based on the product you select.
Hovering over the graph displays usage metrics for the corresponding date. Because usage is cumulative, no data displays on the first day of the month.
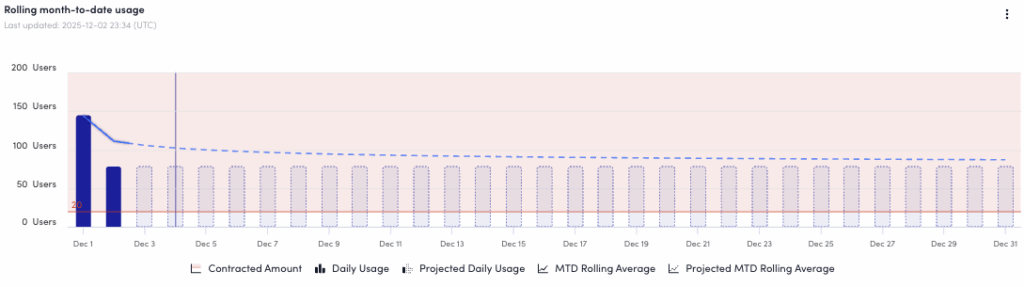
This visual trend-line enables you to monitor daily consumption patterns and compare your pace of usage across the current month. You can also view a usage forecast that reflects your current consumption trajectory.
Usage Contributors Table
The Usage Contributors table displays usage for selected child accounts. The table includes both the cumulative usage for each selected child account and your total cumulative usage across all contributors. When a child account is selected, the Month-to-Date Usage Summary updates to reflect data for that account.
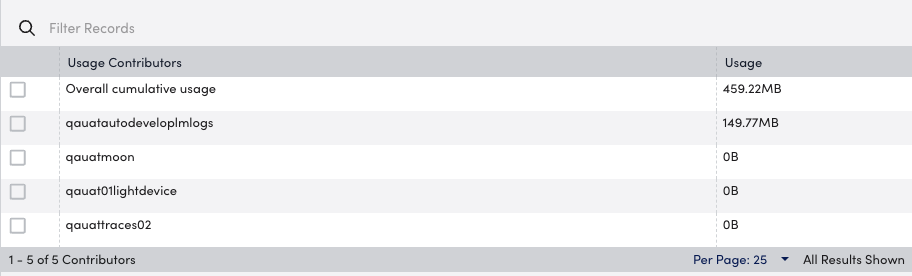
This table helps you understand how individual child accounts contribute to overall usage. This visibility can assist with internal chargeback, consumption management, and identification of unexpected spikes at the account level. For more information, see Usage by Contributor.
Note: Some products display additional visual components to convey more in-depth usage information for that product. For more information, see the applicable documentation for each product LogicMonitor gathers usage metrics for.
