v.114 Release: LA checkpoint retires; new alert management features; and new Integrations logs
Last updated on 14 September, 2022Happy New Year! We’re kicking off 2019 with a robust release. v.114, which will be rolled out through the middle of January, features many impactful new features and improvements.
Two New Fine-Grained Alert Management Features
Two exciting new features are being released with v.114 to help you better manage alerts and their notifications!
Secondary Sorting of Alert Lists by Severity/Time Began
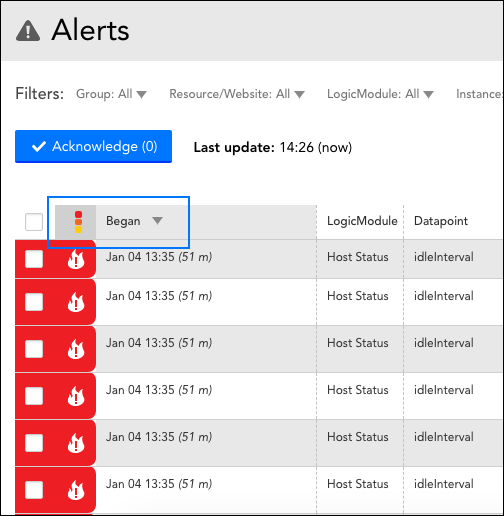
Secondary sorting using an alert’s severity status and time began timestamp is now available from any area of the LogicMonitor interface that features an alerts table (e.g. Alerts page; Alerts tab for a device, cloud resource, or website; Alert List dashboard widget). This improvement allows users to simultaneously sort on both the alert severity level (primary sort) and the time alert began (secondary sort), and was implemented to provide more logical context when viewing alert lists.
To turn on secondary sorting for an alerts table, click on the icon ( ![]() ) that acts as the header for the far left alert severity column. This automatically sorts using the chosen ascending/descending orders of both the alert severity and “Began” columns. To turn off secondary sorting, simply click on a column other than the “Began” column (or click the
) that acts as the header for the far left alert severity column. This automatically sorts using the chosen ascending/descending orders of both the alert severity and “Began” columns. To turn off secondary sorting, simply click on a column other than the “Began” column (or click the ![]() icon twice more) to reset the table to a single sort order. For more information on this new sorting capability (and other filter/sort options available for alerts), see Alerts Page Overview.
icon twice more) to reset the table to a single sort order. For more information on this new sorting capability (and other filter/sort options available for alerts), see Alerts Page Overview.
Alert Notification Routing by Properties
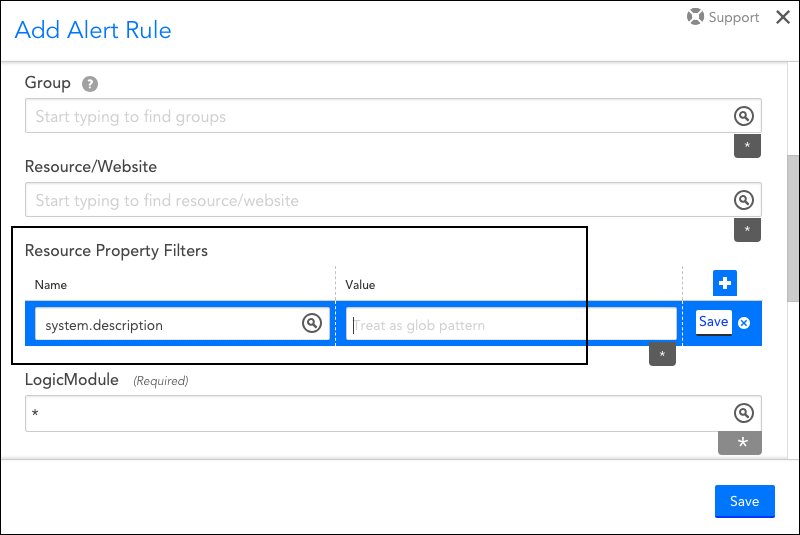
You can now route alert notifications based on properties that have been assigned to a resource (e.g. device, cloud resource) or website. This new property filter is available from the configuration settings of an alert rule. For more information on this new alert rule configuration (and other configurations available for routing alert notifications), see Alert Rules.
Retiring: Los Angeles Checkpoint
We are retiring our hosted Los Angeles checkpoint location with v.114. All Web Checks, Ping Checks, and Website Status widgets that reference the Los Angeles checkpoint will be automatically migrated to the San Francisco checkpoint, assuming it is not already in use.
Important! Some LogicMonitor configurations that reference the Los Angeles checkpoint must be manually updated to the San Francisco location in order to ensure that alert conditions are still properly brought to your attention. These configurations include:
- Any existing alert rules that include or exclude the Los Angeles checkpoint
- Any custom alert table filters that filter on the Los Angeles checkpoint
- Any dashboards containing predefined graphs (as seen from the Graphs tab of the Website detail view) that report on the Los Angeles checkpoint
Integrations Logs!
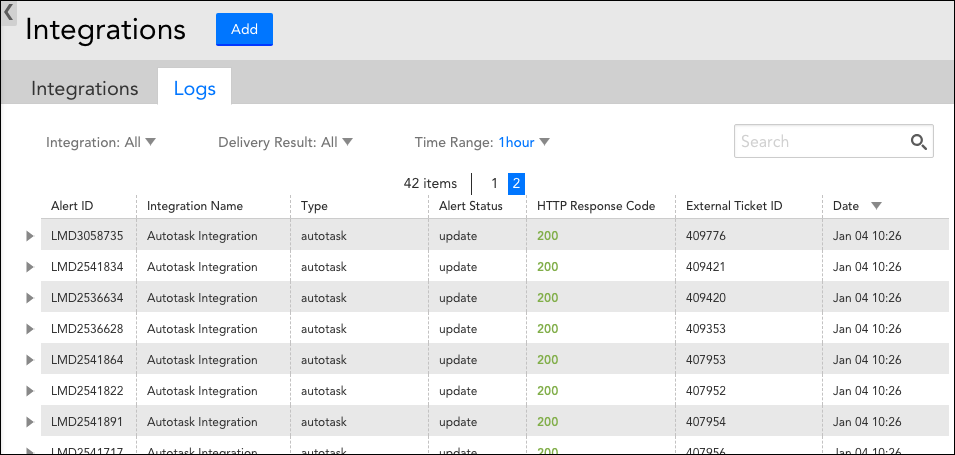
LogicMonitor has long supported out-of-the-box and custom integrations to allow your organization to view and respond to LogicMonitor alerts via collaboration tools external to LogicMonitor. Now, with the introduction of the Integrations logs (available by navigating to Settings | Integrations | Logs), administrators have visibility into the outgoing and response payloads for every integration call made for improved troubleshooting. The Integrations logs can be filtered using a variety of criteria including delivery status (i.e. successful/failed) status, integration instance, and date/time to identify issues more quickly. For more information on this new feature, see Integrations Logs.
Note: This feature will be enabled after v.114 is fully rolled out.
MGD Collector 27.005
We recently announced the new minimum required Collector. Please upgrade your Collectors to version 27.005 or higher as soon as possible, otherwise they will be auto-upgraded on Monday, February 25th, between 6-9PM PST. It is highly recommended that you upgrade prior to this time.
Other Improvements
Dashboards
- NOC widget improvement. The order in which the NOC widget sorts resources according to status has been improved. Resources in SDT are now assigned a lower priority than resources with alert conditions that are not in SDT. The new sort order is as follows, listed from highest to lowest priority:
- Unacknowledged: critical, error, warning
- Acknowledged: critical, error, warning
- SDT: critical, error, warning
- SDT-Acknowledged: critical, error, warning
- SDT-Clear (no alert)
- Clear
If SDT ends for a resource, but that resource remains in alert, it will then gain a higher priority status, causing it to move towards the top of the NOC widget, and providing better visibility into your infrastructure.
- SLA widget improvement. The SLA widget will now display “Resources in SDT” instead of “Empty Data” if the resources monitored are in SDT for the duration of the time range tracked.
EventSources
- Better encoding type detection for log file EventSources. When configuring a new log file EventSource, the Encoding field that determines the file encoding type the Collector uses will now default to “Autodetect.” Previously, the encoding option defaulted to either Windows-1252 or UTF-8 depending on whether the Collector was Windows or Linux, which was not always accurate. By changing the default encoding option to “Autodetect,” the Collector will auto-select the encoding method based on the received log file.
LM Cloud
- Azure monitoring improvements
- Improved billing data collection. Azure billing data collection has been improved to resolve occasional gaps.
- Improved Poll Now functionality. To aid with troubleshooting, the information returned by the Poll Now functionality available for the Azure Resource Health DataSource now includes a summary as to why customers see certain resource health data.
- Drag and drop issues resolved. Azure cloud accounts located in the root group of the resources tree could not be dragged and dropped into other groups; the parent group had to be manually updated from the resource’s configurations. This has been fixed.
- Google Cloud Platform (GCP) monitoring improvements
- Improved permissions testing. The GCP permission test that checks whether the necessary APIs are enabled, in addition to validating service account permissions, has been improved.
- GCP service health monitoring no longer requires a local Collector. Data collection for monitoring GCP service health (and any service disruptions) will now be handled by a LogicMonitor-maintained Collector, and no longer requires a local Collector.
- New maximum connection quota for MySQL and Cloud SQL for PostgreSQL instances. A maximum connection quota for MySQL and Cloud SQL for PostgreSQL instances has been added as a property. This allows monitored connections to be represented as a percentage of the maximum connection quota, and better prevents quota exhaustion.
REST API
- API keys no longer contain commonly escaped characters. API keys are no longer generated with ! and $ characters to make API use easier with programming and scripting languages that require these characters to be escaped.
- Historical SDT support for websites. The ability to get historical SDTs for websites has been published to the LogicMonitor REST API v2. See our API documentation for more details.
- New filter parameters for getting historical SDTs. You can now filter requests to get historical SDTs based on startEpoch and endEpoch parameters with v2 of the REST API.
User Interface
- Misleading default time range description removed for dashboards. The Default time range option available for dashboards (and some reports) was previously accompanied by a note stating “Typically prior 24 hours.” However, this note is misleading because individual dashboard widgets have wide-ranging standard time ranges—or none at all. To eliminate confusion, the note for the Default time range option now states “Varies per widget.”
- The Publish to Exchange button for DataSources moved. The Publish to Exchange button available for DataSources was previously located immediately adjacent to the Save button, resulting in users accidentally publishing DataSources they had only intended to save. To eliminate this issue, the Publish to Exchange button has been moved further away from the Save button and an “Are you sure you want to publish this module to LM Exchange?” yes/no prompt has been added.
LogicModule Releases
Next we’ve listed new and improved LogicModules that were implemented since our last release.
New Monitoring Coverage
- GCP Service Health – 1 DataSource
- GCP Billing – 3 DataSources
- Google Cloud Platform (GCP) App Engine Versions – 1 DataSource
- HP Chassis / System – 11 DataSources, 1 PropertySource
- VMware vCenter & ESXi – 33 DataSources, 1 PropertySource
Monitoring Improvements
- AWS_Application_ELB
- Fixed API endpoints for HTTPCode_Target datapoints
- Azure Resource Health – 1 DataSource
- Updated appliesTo to exclude Azure functions
- Azure SQL Server – 1 DataSource
- Updated tech notes with details on configuring SQL Server on Azure vs Azure SQL Database
- Dell_Drac_DriveStatus
- No longer alerts on disks which cannot legitimately form a raid
- HP 3PAR CPG – 1 DataSource
- Fixed regex matching in Groovy scripts
- Created additional datapoints and graphs
- LogicMonitor Collector NetScan – 1 DataSource
- Fixed various datapoint descriptions and graphs
- Meraki – 7 DataSources
- Improved failback when instances lack names
- VMware vCenter Datastore Status – 1 DataSource
- Minor script fix to better handle null values


