


v.136 Highlights:
- Feature Highlight: LM Exchange – NEW!
- Platform Enhancements: Collector MGD 28.005, improved report security, NetFlow updates, and more
- New and Updated Monitoring Coverage: New out-of-the-box monitoring for Cisco UCS, Ruckus ZoneDirector, Atlassian Statuspage (statuspage.io), Zoom, and several AWS, Azure, and GCP cloud resources
- Entering Beta: Improved Slack alert Integration and AIOps Early Warning System (phase two)
Feature Highlight: LM Exchange
Note: LM Exchange will be activated for all customer portals on June 4.
LogicMonitor offers an ever-expanding library of LogicModules to bring you out-of-the-box monitoring for the networking devices, applications, databases, services, and other systems and tools your enterprise relies on. With the introduction of the new Exchange page, we’re making it significantly easier for you to maintain this library.
The Exchange page provides a centralized view of LogicModules. This view includes not only those LogicModules that live locally in your portal, but all LogicModules available in LogicMonitor’s global repository. It’s the new home for LogicModule management—and it’s right inside your portal!
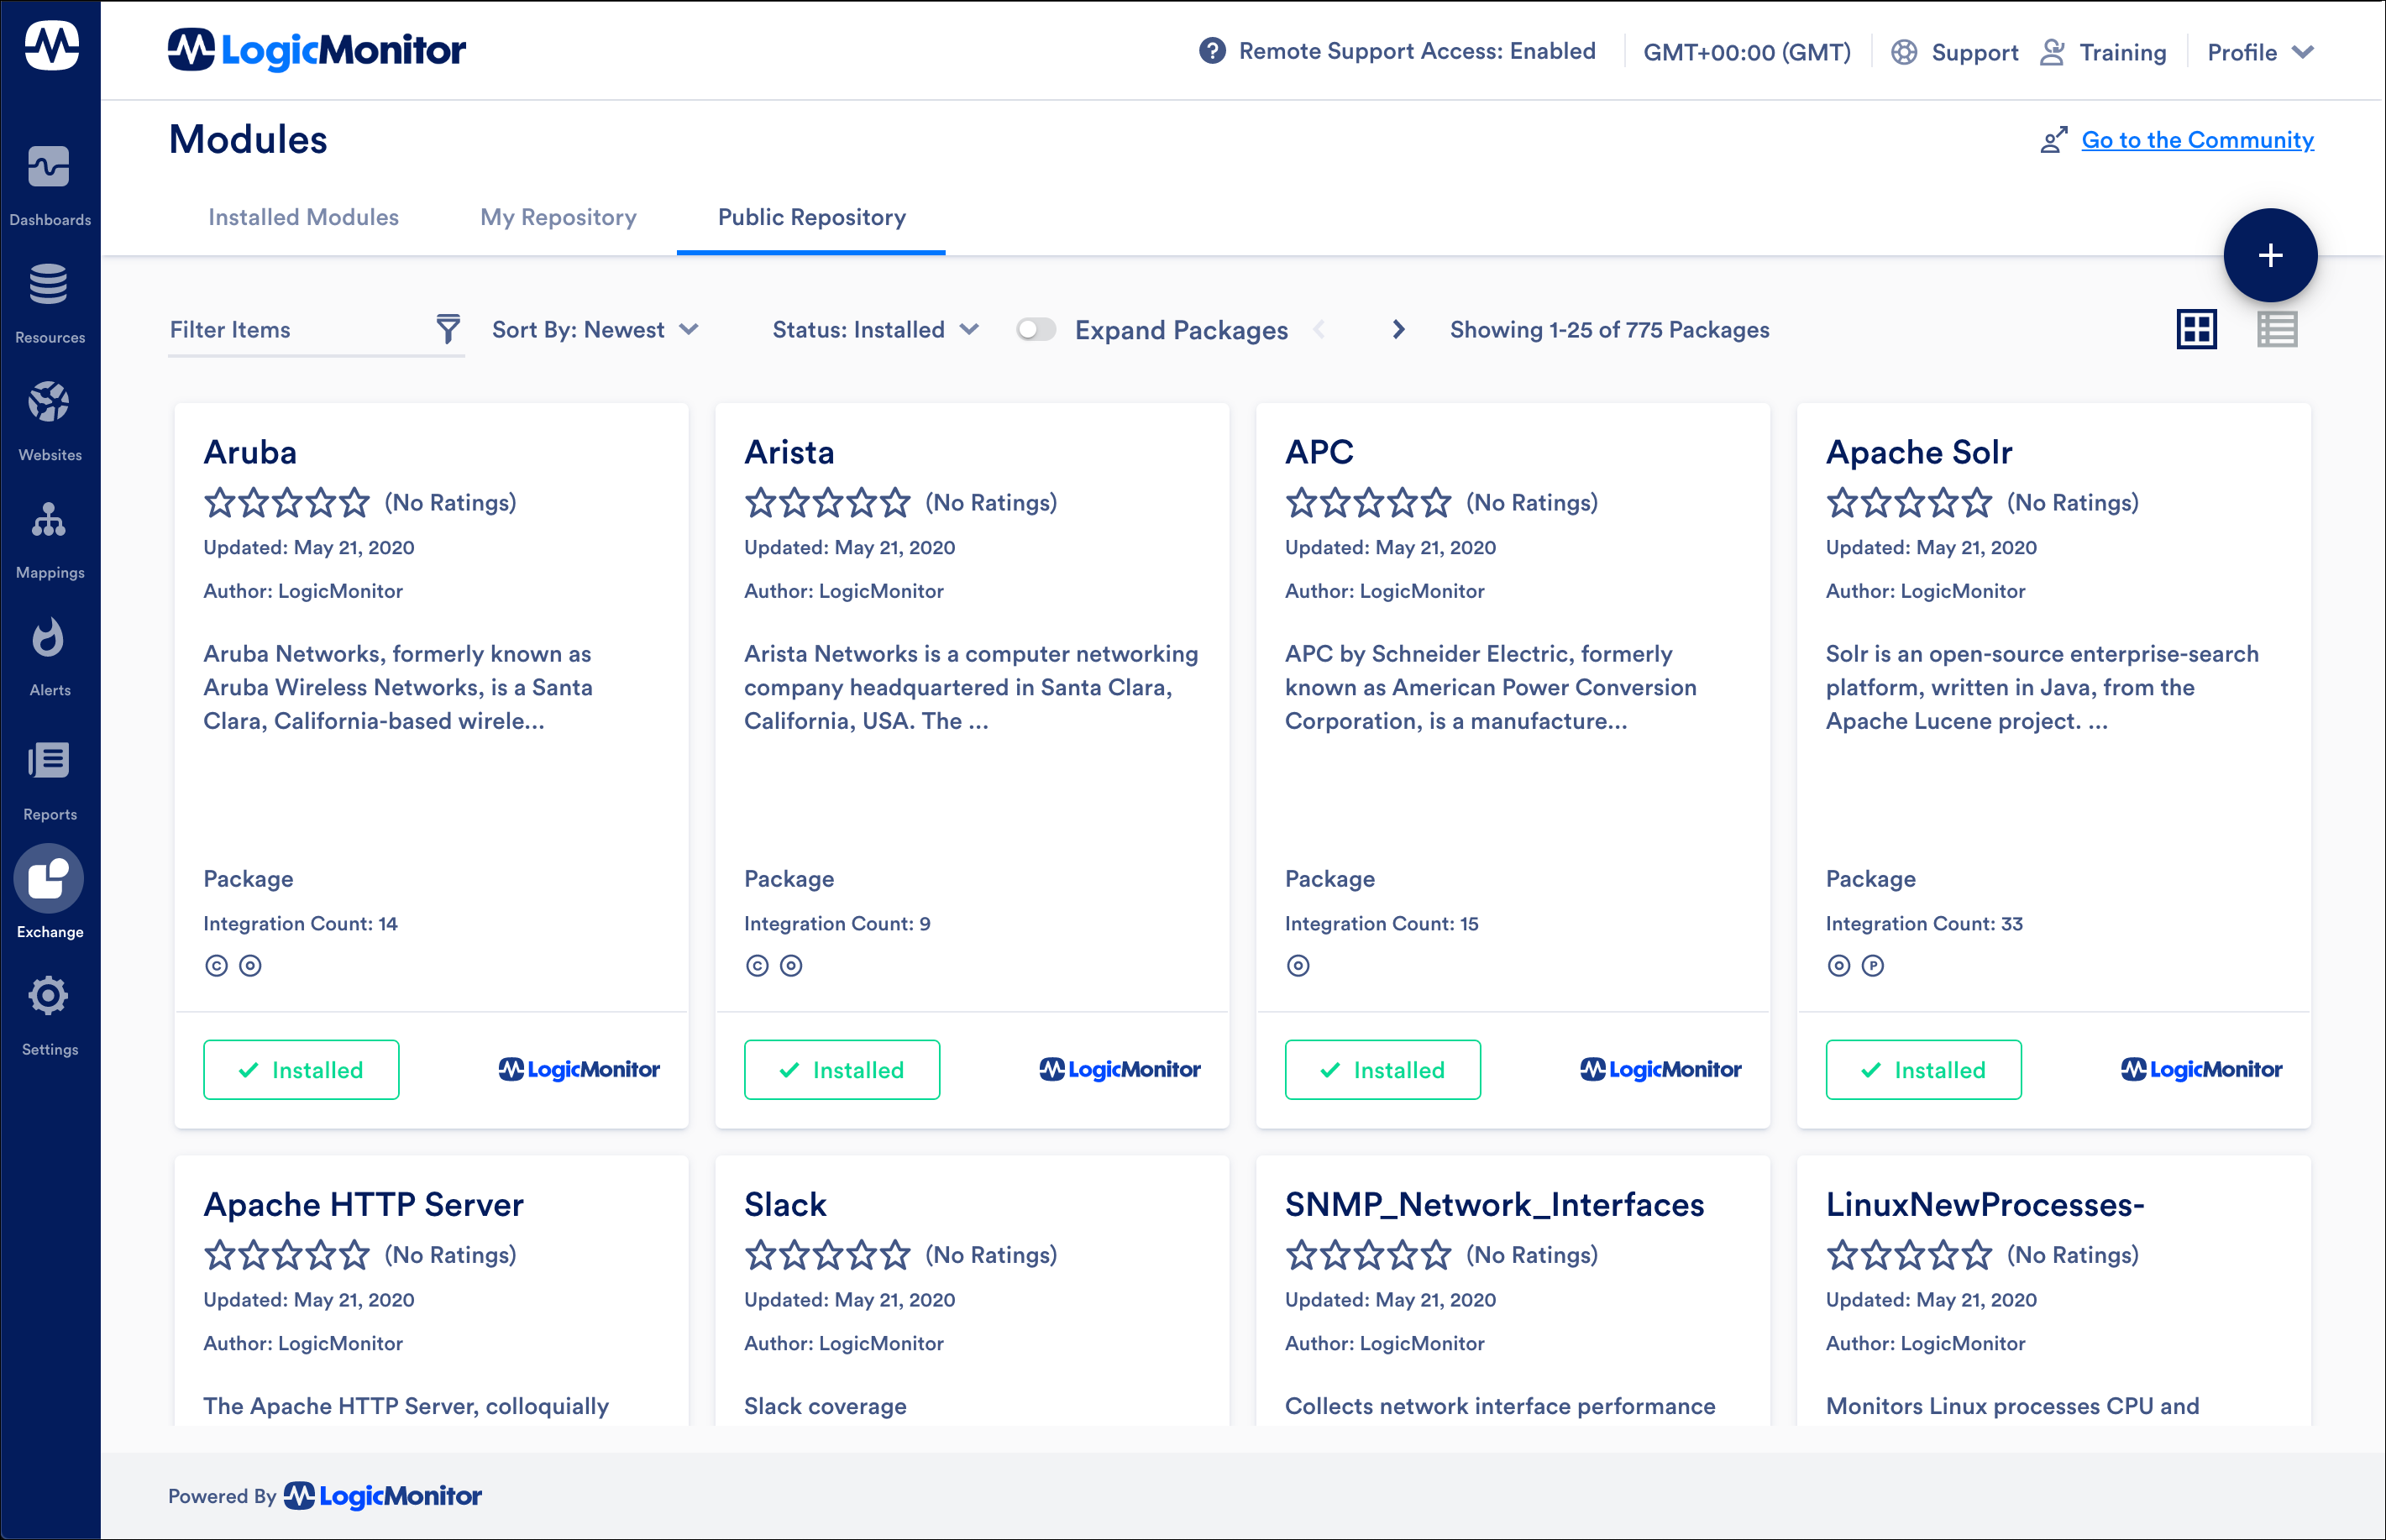
Highlights include:
- Single pane of glass. Browse, search, download, update, customize, and share your LogicModules from a single UI.
- Safe LogicModule Merge. Proprietary safe merge functionality, called Safe LogicModule Merge (SLM), allows you to easily preserve your local customizations when importing LogicModule updates. Changes you’ve made to a LogicModule (alert thresholds, AppliesTo logic, Active Discovery filters, and any other configurations that differ from the update) are highlighted during the import process and resolved one by one.
Note: SLM is being released as an early access (EA) feature. EA features debut new functionality and are largely stable, but are not yet recommended for use in critical operations.
- Packages. New LogicModule groupings, called packages, are organized according to the technology monitored. For example, the Microsoft Office 365 package contains all DataSources, PropertySources, and ConfigSources that work together to provide full monitoring coverage for a device or system. Packages provide a birds-eye view of the LogicModules required to successfully monitor a particular technology and allow for efficient import of these LogicModules.
- Streamlined community sharing. LM Exchange offers a more streamlined process for the searching and sharing of LogicModules developed by members of the LogicMonitor user community.
- Intuitive DataSource editor. With LM Exchange, we’re introducing improved editor views for LogicModules. Currently, only DataSource editing is supported from the Exchange page. (The LogicModule configuration dialogs available under Settings | LogicModules will remain available until full parity is achieved by LM Exchange.)
To learn more, see LM Exchange.
Platform Enhancements
Alerting
- Alert clear notification routing. For resources with recurring SDTs, there was an issue in calculating the starting time of the SDT. This issue, which was causing alert clear notifications to be suppressed when they should have been routed (according to the improved alert clear routing behavior features that were introduced in v.133), has been fixed.
AppliesTo Scripting
- AppliesTo test results. AppliesTo test results were omitting resources that met the conditions defined in an AppliesTo statement if those conditions were met via property inheritance from a resource’s parent or parent group. This has been fixed.
Collector
- Collector MGD 28.005. LogicMonitor has designated the general deployment Collector version of GD 28.005, released in March, as the next MGD (minimum general deployment) Collector version. On June 30, between 6 and 9 p.m. PT, all Collectors in your LogicMonitor platform below version GD 28.005 (or below the early access version of EA 28.100) will be automatically updated to this new minimum version (we encourage you to upgrade on your own schedule prior to the automatic update). After June 30, we will officially deprecate and stop supporting the previous minimum general deployment of MGD 27.005. For more details, see MGD Collector – 28.005.
General
- America/Sao_Paulo time zone designation. Updated “America/Sao_Paulo” time zone designation from GMT -2 to GMT -3 to align with changes made by Brazil officials.
LM Cloud
- Collector reassignment. Devices in LM Cloud can now be assigned to a specific Collector/Collector group, even if previously assigned to an ABCG (Auto-Balanced Collector Group). Previously, if a device was assigned to an ABCG, it could not be re-assigned to a specific Collector using the Collector field. The ABCG would override this field. In addition, it was previously not possible to set this value to “None” which prevented auto assigning.
- GCP Project ID error message. An error message generated around case-sensitive GCP Project Ids was being falsely generated. This has been fixed.
LM Container
- Kubernetes 1.18. LM Container is now certified for Kubernetes 1.18.
NetFlow
- NetFlow Device Heartbeat DataSource. As discussed in the New and Updated Monitoring Coverage section, a new DataSource was added to initiate alerting when a Collector stops receiving NetFlow data from a device.
- Multi-select QoS filter for NetFlow. When filtering NetFlow traffic, the Traffic tab now supports the ability to select multiple QoS filter criterion from the QoS Type filter’s dropdown menu. Previously, only one (or all) QoS type criterion could be filtered for per filter.
- NetFlow packets referencing port of “0”. NetFlow packets with a source or destination port of “0” were being discarded. This has been fixed.
Reports
- New report retention period setting. A new option for report retention period has been added, which provides flexibility in specifying how long a generated report remains available online. The High Flexibility (7 day retention) option mimics LogicMonitor’s historical report retention timeline of seven days, while the High Security (8 hour retention) option significantly shortens retention period. Existing report configurations will default to the seven-day retention timeline unless otherwise reconfigured.
- Resource Metric Trends report. The minimum and maximum values for the Resource Metric Trends report were not being calculated correctly. This has been fixed.
Security
- Chrome 80 supported with SSO. Version 80 of the Google Chrome browser, declared stable on February 4, introduces a new secure-by-default model for the handling of cross-site cookies. These changes sometimes resulted in the inability of LogicMonitor users running Chrome 80 to sign in to the platform via SSO. This issue has been fixed and LogicMonitor now natively supports SSO sign in via Chrome 80 without the need for a workaround.
- Miscellaneous security fixes and improvements. Various security fixes and improvements are being released with this version.
Topology Mapping
- Improved map display. Fixed issue on Mapping page that was causing newly added connections to stack on top of each other if those connections were added after repositioning the placement of mapped resources.
New and Updated Monitoring Coverage
Upon your account’s upgrade to v.136, import our new and updated LogicModules from the LogicMonitor repository to expand and enhance your monitoring coverage.
New Monitoring Coverage
- AWS API Gateway Stages – 1 DataSource
Added discovery and monitoring for AWS API Gateway stages, which are a named reference to a specific deployment stage. Metrics monitored per stage (as reported by CloudWatch) include 4XXError, 5XXError, CacheHitCount, CacheMissCount, Count, IntegrationLatency, and Latency.
- AWS Elasticsearch Service – 1 DataSource
Discovers and monitors AWS Elasticsearch service, which is a fully managed service to deploy, secure, run, and scale Elasticsearch. Metrics monitored include AutomatedSnapshotFailure, CPUCreditBalance, CPUUtilization, CPUUtilizationMax, ClusterStatusGreen, ClusterStatusRed, ClusterStatusYellow, ClusterUsedSpace, ClusterUsedSpacePercent, DeletedDocuments, FreeStorageSpace, JVMMemoryPressure, Nodes, SearchableDocuments.
- (Topology Mapping) Cisco HyperFlex – 1 PropertySource, 1 TopologySource
The
addERI_Cisco_HyperflexPropertySource and theCisco_Hyperflex_TopologyTopologySource have been added to enhance topology mapping coverage for Cisco HyperFlex. - Cisco UCS – 7 DataSources, 1 PropertySource, 1 TopologySource
In v.134, LogicMonitor released a new monitoring package for Cisco UCS that leveraged the UCS Manager API (rather than relying on SNMP as the collection method). With v.136, we are releasing seven more DataSources to increase our API coverage:
Cisco_UCS_Fans,Cisco_UCS_PSUs,Cisco_UCS_FabricExtender,Cisco_UCS_FexPorts,Cisco_UCS_SANPortChannels,Cisco_UCS_ChassisPorts, andCisco_UCS_ServerInterfaces.We have also released the
addERI_Cisco_UCSPropertySource andCisco_UCS_TopologyTopologySource for enhanced topology mapping coverage). For more information on setting up Cisco UCS monitoring via API, see Cisco UCS Monitoring.Note: These new API DataSources overlap some (but not all) functionality of the existing SNMP-based Cisco UCS DataSources. For now, we are recommending that you do not disable the SNMP-based DataSources, but rather run both sets in parallel. In an upcoming release, we will be expanding the reach of the API-based suite and will, at that time, note any official DataSource deprecations.
- Dell SC (Storage Center) – 15 DataSources, 1 PropertySource
This new suite of LogicModules (names are prepended with “Dell_SC”) replaces the Dell Compellent and Dell SC Compellent (names are prepended with “Dell_Compellent” and “Dell_SC_Compellent” respectively) LogicModules for Dell-SC-based systems.
This new suite was added because, in recent hardware, it’s been discovered that the discovery and collection of important data such as temperature, fans, fan status, and other data has become unreliable as Dell transitions away from the older 1.3.6.1.4.1.16139 Compellent technologies OID to the newer 1.3.6.1.4.1.674.11000.2000.500.1 Dell Storage Center OID. This new monitoring suite uses only the latter OID for discovery and collection.
For details on setting up this new monitoring package and model compatibility, see Dell SC Monitoring.
Note: As discussed in the next section, alerting has been disabled for the latest versions of all
Dell_Compellent*andDell_SC_Compellent*LogicModules to prevent duplicate alerting. - GCP Serverless Cloud Run – 1 DataSource
Monitors performance metrics (as reported by Stackdriver) for the serverless, fully managed GCP Cloud Run compute platform. Metrics including billable instance time, container CPU/memory allocation and utilization, and request counts and latencies.
- Microsoft Azure Automation Account Certificates – 1 DataSource
Discovers and monitors expiration data for Azure automation certificates.
- Microsoft Azure Virtual Network Gateway Connection – 1 DataSource
Monitors various metrics per VPN connection/tunnel (via Azure Monitor) including average bandwidth and egress/ingress data such as volume, packets, and packet drop.
- Microsoft Azure WebJobs – 1 DataSource
Discovers and monitors WebJobs (via Azure Monitor) as instances for a given app service, allowing customers to monitor job status.
- Microsoft SQL Server Failover Cluster – 1 DataSource, 1 PropertySource
Monitors the SQL Server nodes on a Windows Server Failover Cluster (WSFC). As discussed in Windows Server Failover Cluster (on SQL Server) Monitoring, these new LogicModules are intended to be run in conjunction with LogicMonitor’s SQL Server monitoring suite.
- NetFlow Device Heartbeat – 1 DataSource
Monitors received NetFlow packets for the Collector associated with the NetFlow device and alerts if time since the most recent NetFlow heartbeat exceeds idle interval.
- Ruckus ZoneDirector – 9 DataSources, 1 PropertySource, 1 SNMP SysOID Map
LogicMonitor has released a new monitoring package for Ruckus ZoneDirector. The various metrics monitored include uptime, CPU, memory, WLANs, WLAN clients, WLAN access point radios, WLAN error rates, and rogue WiFi signals. For details on setting up this new monitoring package, see Ruckus ZoneDirector Monitoring.
- SNMP Network Interfaces – 1 DataSource
This functionality of this new DataSource is identical to that of the existing
snmp64_If-DataSource, with the exception that it is written in Groovy. Its purpose is to increase efficiency, performance, and scalability and is intended to eventually replace thesnmp64_If-DataSource. As of now, no default alerting is enabled in this new DataSource. - StatusPageIO Service Status – 1 DataSource, 1 PropertySource
Monitors the status of SaaS applications with publicly-accessible status data hosted by Atlassian Statuspage (statuspage.io). For details on setting up this new monitoring package, see Atlassian Statuspage (statuspage.io) Monitoring.
- Zoom Meetings User QoS – 1 DataSource
Aggregates user QoS (quality of service) metrics for Zoom meetings including audio and video latency, jitter, bitrate, and average loss.
Updated Monitoring Coverage
- AWS VPC Transit Gateway – 1 Datasource
Update datapoints to reference the new AWS metric path of TransitGateway rather than TransitGatewayId.
- Cisco ASA – 2 DataSources
For the
Cisco_ASA_FansDataSource, removed the lower RPM fan speed alert threshold for the FanSpeed datapoint; for theCisco_ASA_TemperatureDataSource, fixed the logic for the scale lookup and scaleArray match to value. - Cisco HyperFlex HypervisorVMS – 1 DataSource
Updated data collection script to use the toLong() function to convert the values of the
storage_provisioneddatapoint. - (Topology Mapping) Cisco UCS – 1 PropertySource
Updated the
addCategory_Cisco_UCSPropertySource for enhanced topology mapping coverage. - Citrix XenApp Application Usage – 1 DataSource
Inserted additional script API response checks to check for HTTP 404 error codes; performed minor Active Discovery and data collection script cleanup.
- Dell Compellent and Dell SC Compellent – 16 DataSources
As discussed in the previous section, a new suite of LogicModules (names are prepended with “Dell_SC”) has been released to replace all current Dell Compellent and Dell SC Compellent (names are prepended with “Dell_Compellent” and “Dell_SC_Compellent” respectively) LogicModules for Dell-SC-based systems. To avoid duplicate alerting, alerting has been disabled for all
Dell_Compellent*andDell_SC_Compellent*LogicModules. - Device_BasicInfo – 1 PropertySource
Added support for the NetScaler manufacturer endpoint.
- HTTP- – 1 DataSource
Removed mentions of “SSL” in alert messages.
- Interfaces VLAN (64 bit) – 1 DataSource
Added missing overview graphs; cleaned up various regular graphs, datapoint descriptions, and alert messages.
- Kubernetes Container – 1 DataSource
Updated Active Discovery script to add container environment variables as instance-level properties.
- Meraki Cloud Controller Device Inventory – 1 DataSource
Fixed issue in data collection script when calculating number of teleworkerGateways; added session close logic into helper method; performed minor script cleanup.
- Microsoft Azure ExpressRoute Circuit – 1 DataSource
Added new datapoints to monitor ARP and BGP availability, as well as global reach and QoS bandwidth metrics.
- Microsoft Azure VMs – 1 DataSource
Adopted default datapoint data aggregation returned by the Azure API to mirror how data is displayed by Azure monitoring dashboard.
- Microsoft DHCP: IPv4 Scopes – 1 DataSource
Added multi-output formatting support to address Active Discovery issues.
- Microsoft Office 365 Microsoft Teams User Activity – 1 DataSource
Removed duplicate token request; ensured -BasicParsing is passed into request.
- Microsoft Office 365 Reports – 4 DataSources (updated), 3 DataSources (removed)
For the
Office365_Reports_MicrosoftTeamsDeviceUsage,Office365_Reports_OutlookEmailActivity,Office365_Reports_ServicesUserActivity, andOffice365_SharepointOnline_SiteStatusDataSources, the Validate-Null function has been updated to return Null or Empty instead of defaulting to 0. In addition, performed PowerShell code cleanup and formatting.REMOVED: Due to the creation of excessive instances, the following DataSources have been removed from the LogicMonitor repository:
Office365_Reports_UserActivityDetails,Office365_Reports_OneDriveUserActivityDetail,Office365_Reports_SkypeforBusinessUserActivityDetail. - Microsoft SQL Server– 2 DataSources, 3 PropertySources
Updated the
WinSQLServices-DataSource, along with three PropertySources (addCategory_MSSQL,Microsoft_SQLServer_Connections, andMicrosoft_SQLServer_SQLAuthConnections). The PropertySources are now cluster aware to accommodate the new monitoring capabilities introduced by the newly-released Microsoft SQL Server Failover Cluster DataSource. In addition, these PropertySources have been updated to use SQL authentication when thejdbc.mssql.userandjdbc.mssql.passproperties are populated on the device. For theMicrosoft_SQLServer_ConnectionsPropertySource, a stray 0 was removed from the script that was preventing data collection.For the
WinSQLServices-DataSource, the AppliesTo statement has been updated to prevent double reporting on Windows Server Failover Clusters. The data collection script for theMicrosoft_SQLServer_SystemJobsDataSource was updated to be compatible with systems that have case sensitivity enabled. - NetSNMP Memory Usage – 1 DataSource
Added upper kernel limit of 7.7 to accommodate an issue in Red Hat EL7 net-snmp version 5.7.2-43-el7 (as this is now fixed in version net-snmp-5.7.2-47.el7). This was released along with EL7 kernel 7.8. A fully updated system with kernel EL7 version 7.8 will be running net-snmp-5.7.2-47.el7 or higher.
- OSPF Neighbors – 1 DataSource
Removed the No Data alert on the PeerAlert complex datapoint; updated Active Discovery and data collection scripts with debug output flag feature; updated tech notes to reflect multi-context support requirements.
- Slack – 1 DataSource, 1 EventSource
For the
Slack_Services_StatusDataSource, added an alert threshold to the status datapoint for out-of-the-box alerting. For theSlack EventsEventSource, updated event capture logic to better capture events and alert when there are updates to outages. - (Topology Mapping) DataSources – 56 DataSources
To improve topology mapping operations, the Active Discovery script for the following DataSources was updated to accommodate namespaces containing commas.
- Cisco HyperFlex: Datastores, Hypervisor Controller VMs, Hypervisor Disks, Hypervisor Hosts, Hypervisor VMs, Nodes, Status (7 DataSources)
- Cisco UCS: Blade Servers, Chassis, Chassis Utilization, Disks, Fabric Extender, Rack Servers (6 DataSources)
- Meraki: MS Stats, MX Stats, Z Stats (3 DataSources)
- NetApp 7-Mode: Disks, Volumes (2 DataSources)
- NetApp Cluster-Mode: Disks, Volumes (2 DataSources)
- Ubiquiti UniFi: Access Points, Clients Wired, Clients Wireless, Switches (4 DataSources)
- VMware ESXi Datastore Status (1 DataSource)
- VMware vCenter: Cluster Performance, Datastore Capacity, Datastore Performance, Datastore Status, Host Interfaces, Host Performance, Host Status, Host vSwitch, VMDK, VM Interface, VM Performance, VM Status (12 DataSources)
- VMware vSphere: VM Performance, VM Status (2 DataSources)
To improve topology mapping operations, the Active Discovery script for the following DataSources was updated to eliminate the passing of empty maps when calling SNMP WalkAsMap, which was preventing proper instance discovery in certain environments.
- Arista Sensor: Current, DOM, DOM Laser Bias, Fans, Temperature, Voltage (6 DataSources)
- Axcient Backup: Jobs, Offsite Jobs (2 DataSources)
- Cisco NTP (1 DataSource)
- Cisco Wireless Access Point: Interfaces, Radio (2 DataSources)
- Access Points (1 DataSource)
- ESS (1 DataSource)
- Rogue Access Points (1 DataSource)
- Huawei Chassis Optical Stats (1 DataSource)
- Linux New Processes (1 DataSource)
- SNMP Networking Interfaces (1 DataSource)
- (Topology Mapping) PropertySources – 23 PropertySources
Almost every published addERI PropertySource in the LogicMonitor repository had minor updates applied for the purpose of enhancing topology mapping display and operations. These updates include script enhancements to (1) accommodate namespaces containing commas and (2) eliminate the passing of empty maps when calling SNMP WalkAsMap, which was preventing proper instance discovery in certain environments.
Note: There are only three addERI PropertySources in the LogicMonitor repository that did not receive one of these minor updates:
addERI_Kubernetes_Node,addERI_Kubernetes_Pod, andaddERI_Kubernetes_Service. - UNC Monitor- – 1 DataSource
Refactored data collection method to use Groovy script to allow for use specification; improved graphs.
- VMware vCenter VM Performance – 1 DataSource
Updated the Active Discovery script to better handle broken VM hardware memory; previously, a single broken VM could impact association of the entire DataSource.
Enhanced topology mapping coverage.
- VMware vSAN VM Performance – 1 DataSource
Made multi-thread updates in Active Discovery and data collection scripts for improved performance.
Entering Beta
The following features have recently entered beta testing (or will shortly). If you’d like to be considered for participation, we invite you to contact your customer success manager (CSM) for more information.
Improved Slack Alert Integration
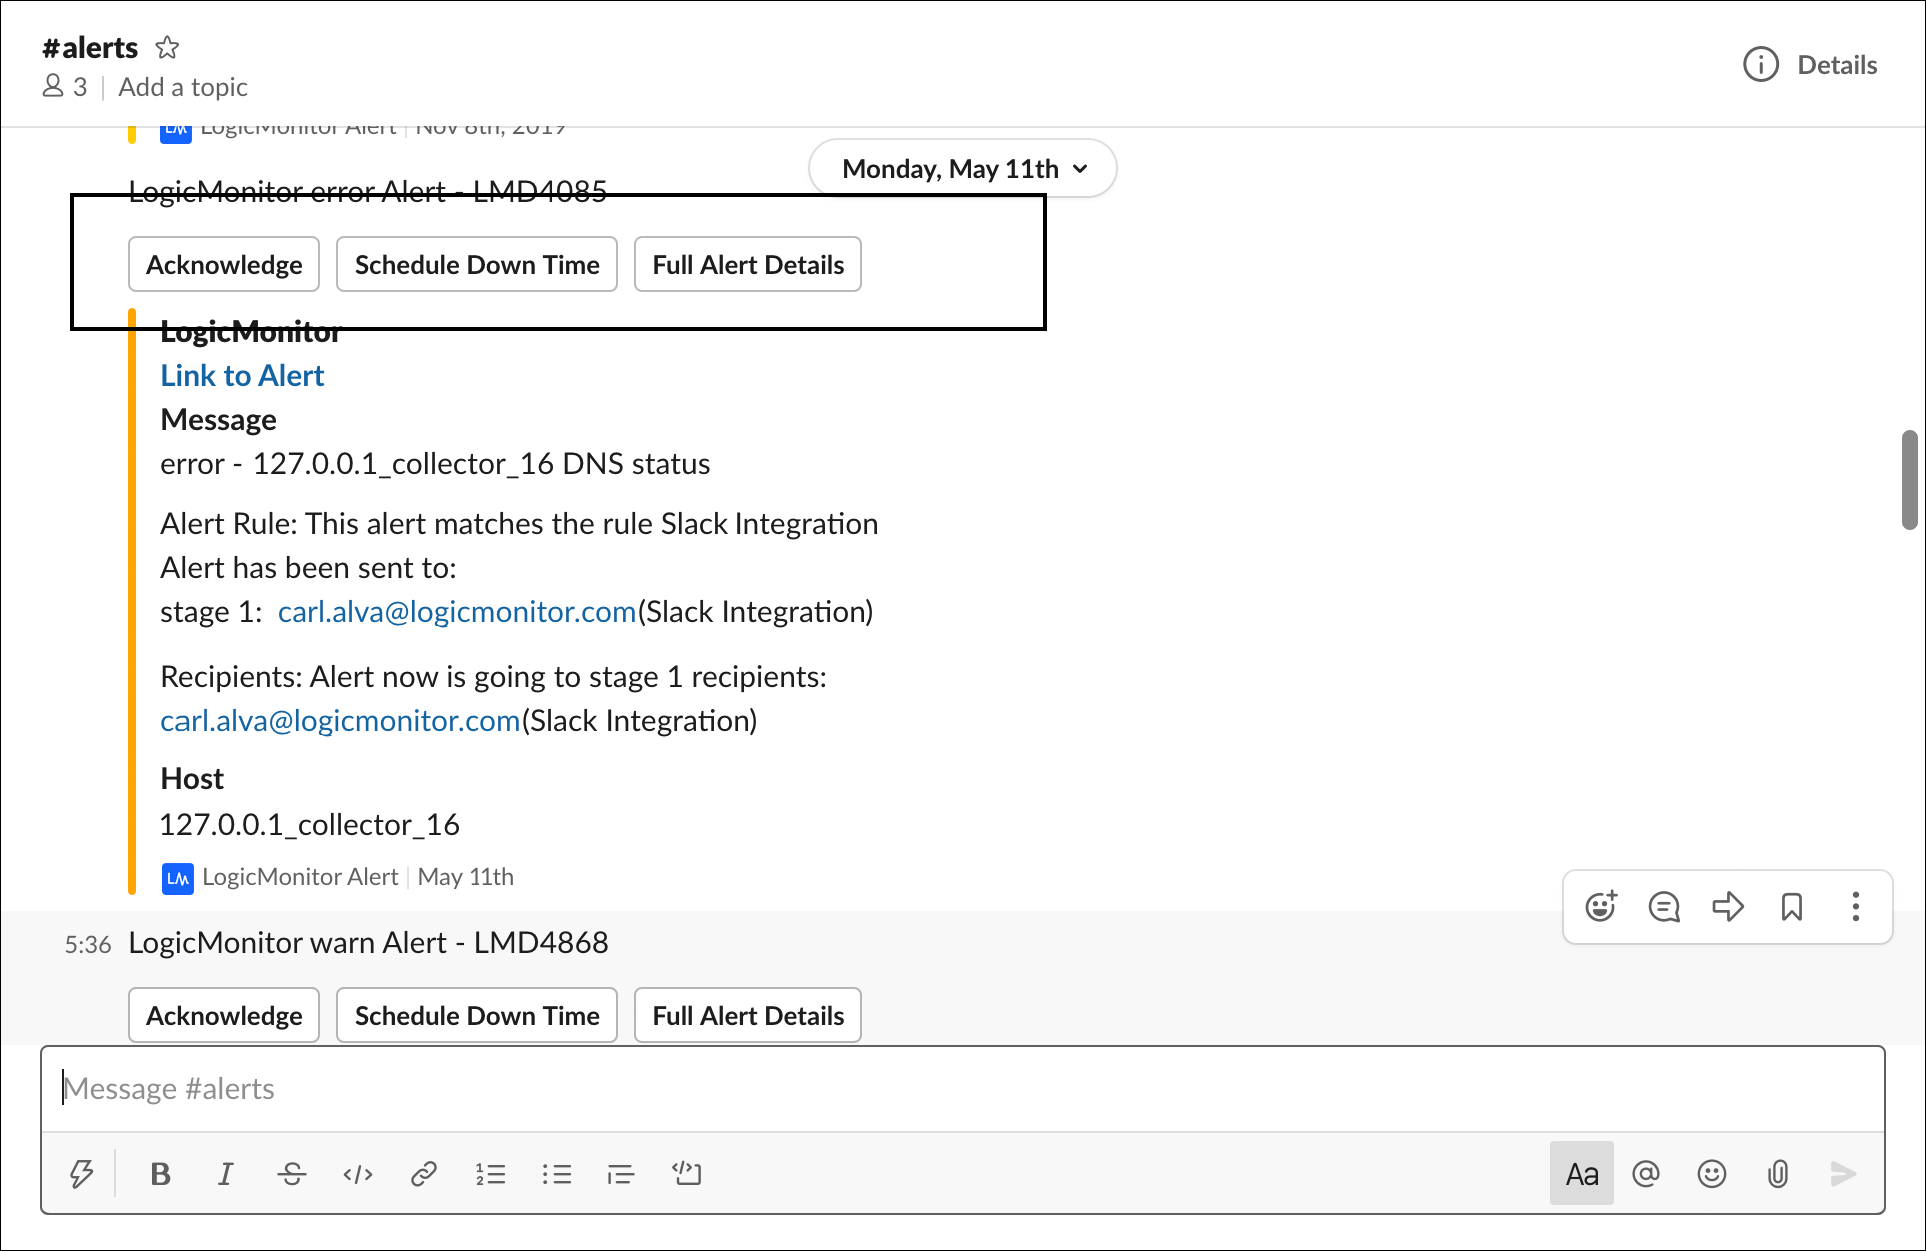
LogicMonitor is currently beta testing an enhanced alert integration for Slack that leverages our brand new LogicMonitor app for Slack. The alert integration between LogicMonitor and Slack is bi-directional, supporting the ability to:
- Route LogicMonitor alert notifications to Slack (you configure the conditions under which alerts are routed—and the Slack channels to which they are routed)
- Open alerts in LogicMonitor from Slack
- Acknowledge alerts from Slack
- Put the resource triggering the alert into scheduled downtime (SDT) from Slack
To learn more about the new Slack integration features available in beta, see Slack Integration: LogicMonitor App Beta.
AIOps Early Warning System (Phase Two)
Last November, LogicMonitor released phase one of our AIOps Early Warning System. In this first phase, we brought you dynamic thresholds and root cause analysis. As part of our phase two efforts, we’re expanding the capabilities of dynamic thresholds.
As discussed in Enabling Dynamic Thresholds for Datapoints, dynamic thresholds currently suppress alert notification routing if the alert’s triggering value is not deemed anomalous by our anomaly detection algorithms. In other words, alert notifications that represent data values that fall within expected data ranges are automatically suppressed for the purpose of reducing unnecessary alert noise.
With the improvements available in this beta, dynamic thresholds will also automatically alert on values that fall outside expected data ranges.
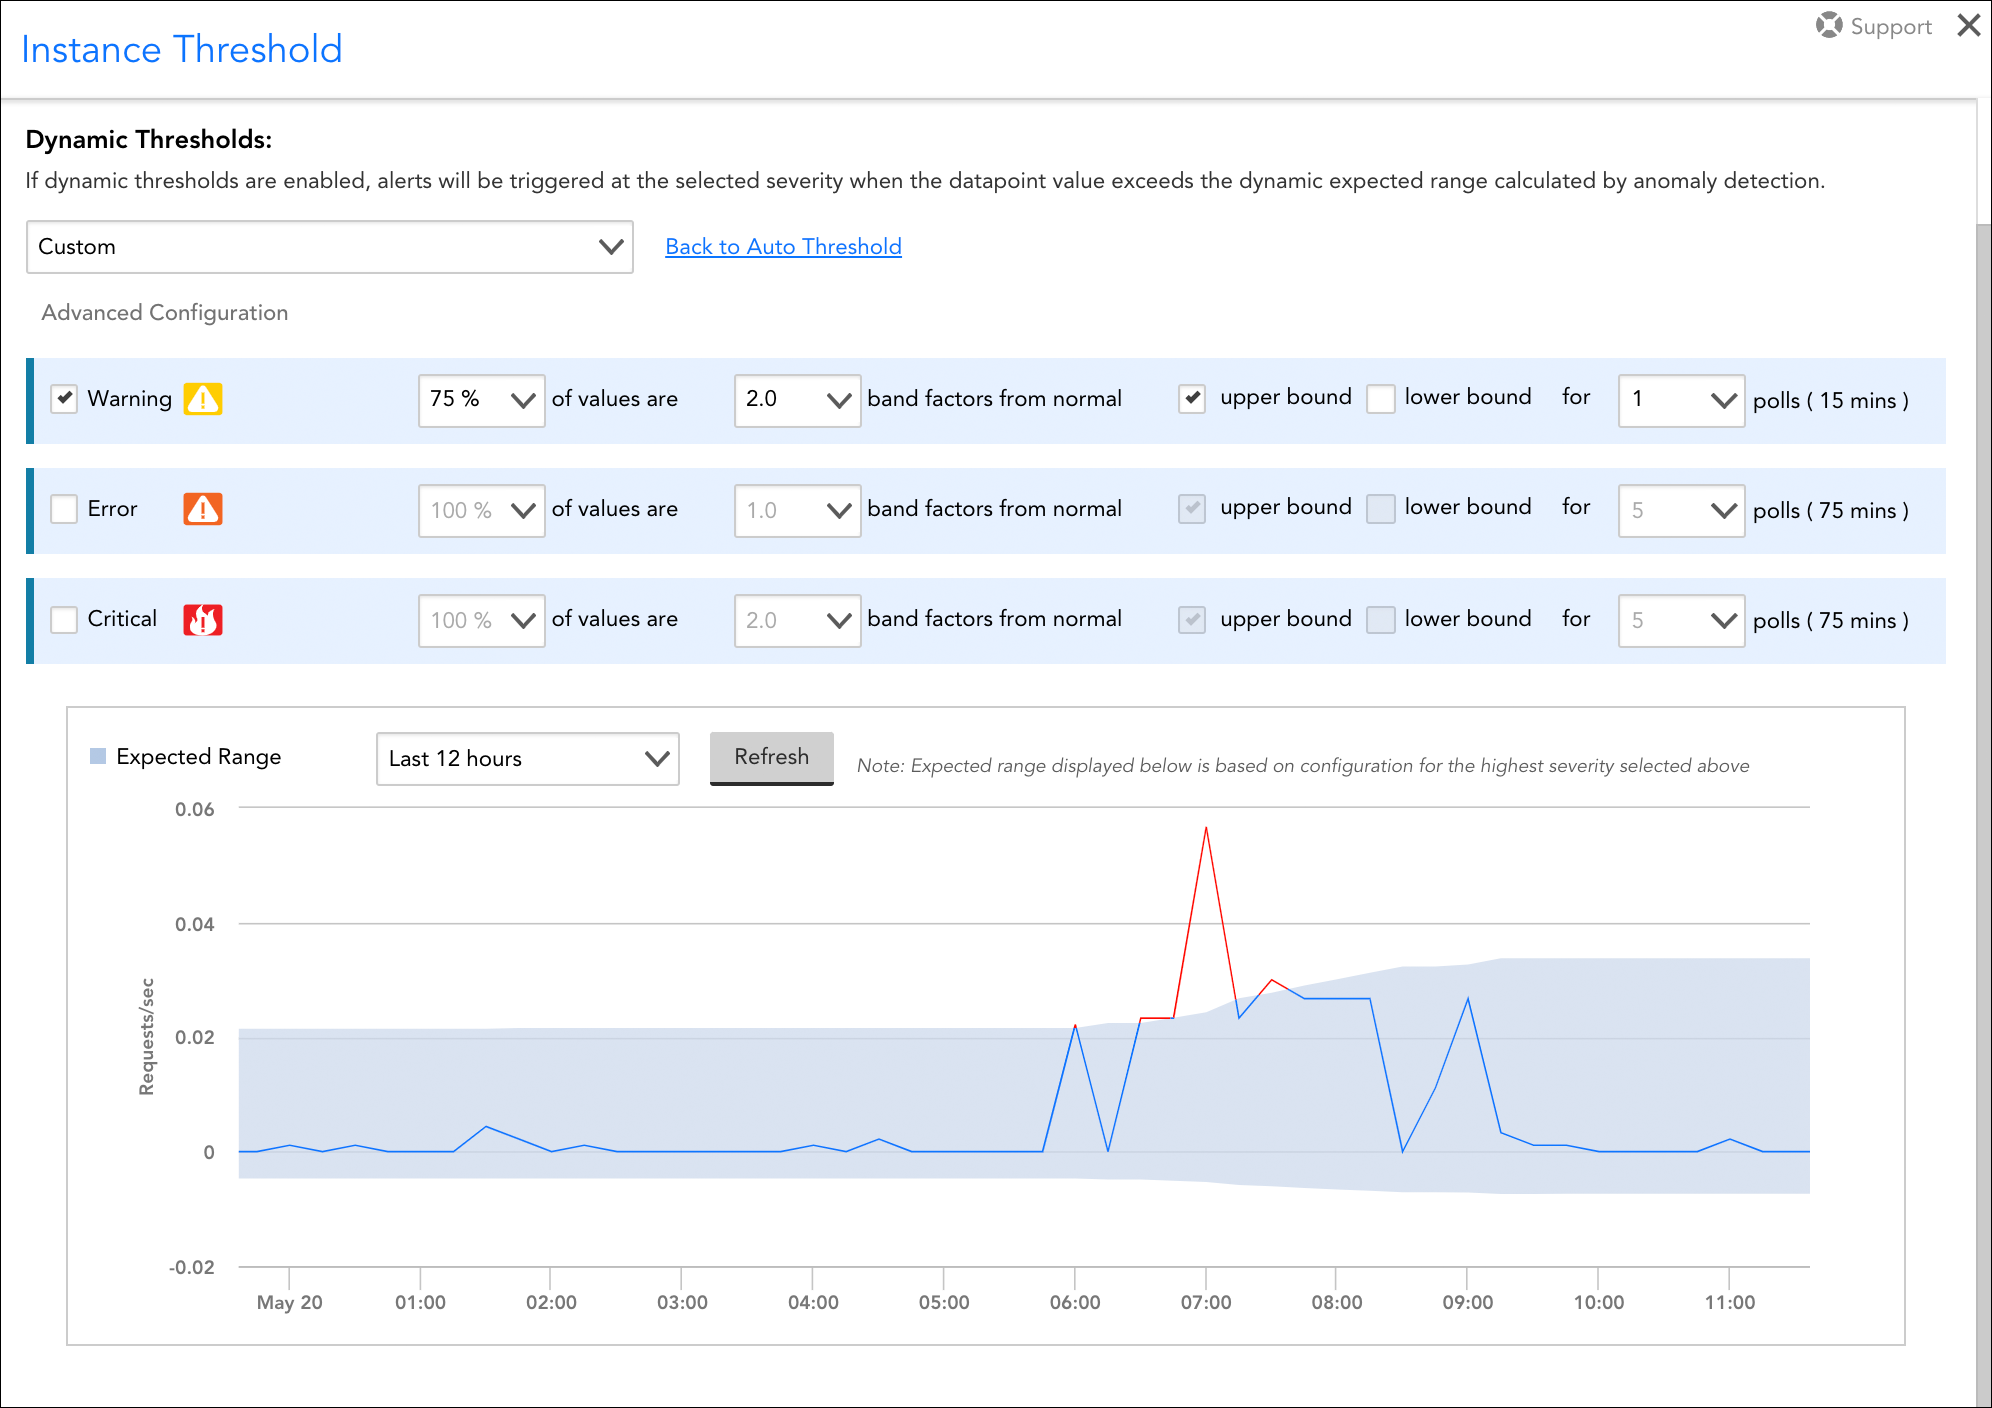
By building upon our ability to recognize and proactively act upon anomalous data, we’re giving you the best of both worlds:
- Reduced noise when static datapoint thresholds aren’t tuned well (through notification suppression)
- Earlier alerting of issues that haven’t yet been (or perhaps never will be) caught by static datapoint thresholds.
Beta participation requirements: In order to participate in the beta program for dynamic thresholds (phase two), you must have a sandbox account and be running LogicMonitor Enterprise.
