v.67 Release: Search Settings, Device Page Improvements
Last updated on 14 September, 2022The v.67 release was focused mainly on fine tuning the UI, as the backed teams are working hard to bring you some great data and Services improvements in November. You will find some helpful improvements though, such as the ability to search most settings pages and better device page functionality.
Services – Status 9 Improvements
Update: The latest SiteMonitor version will support TLS 1.1 and 1.2. It will not support TLS 1.0, as previously announced.
We have additional changes for alerting around invalid certificates, but will introduce these in a future release.
Search Settings Pages
By popular demand, the ability to search has been added to:
- Alert Rules
- Escalation Chains
- Collectors
- OIDs
As with elsewhere in the application, Search can be used across fields. For example, in Escalation chains you can search chain name, description, destinations, and cc fields.
Device Page Improvements
We have some Device Tree improvements in the works, hopefully coming to you in v.68. In the meantime, some other requests have been put into place:
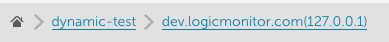
If the device name and IP are distinct, both will display in the breadcrumb:
We’ve also added a link in the header. If a link is added in the manage device screen, clicking the icon will open a new window with the device URL.

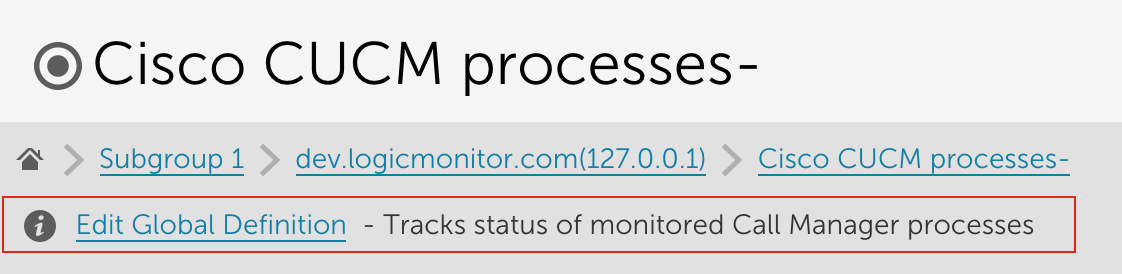
The link for the datasource global definition has been moved to reduce clutter, which also allows for enough space for the datasource description:
 We improved the manage button, making more clear that there is an option to manage the device, or to select the drop down for more functionality. Each button will low light on hover.
Last, but far from least, we’ve added instance descriptions into the Device Tree:
HTML Widget supports iframes
In the HTML widget configuration, a new option is available to embed iframe content.
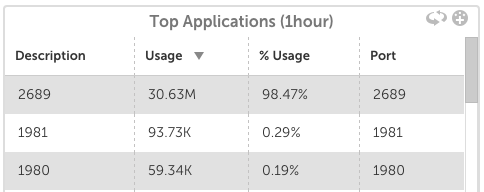
Better Naming of Network Traffic Tables
The Top Applications table is now Top Talkers. This is a more accurate description of the data that is presented, as it is a view of which IPs have the most flows. The Top Ports table is now labeled Top Applications, as the table is a summary of which Applications (represented by ports) have the most traffic.
Other Improvements
- With the Device NOC widget, you can now distinguish between the top group or the subgroups as items with a glob expression. Using Group = Group, one item for the group will appear. Group = Group / * will display an item for each subgroup.
- New datapoint evaluation available for delta percent change. This allows you to compare the absolute percent change of the datapoint value from one polling interval to the next. This is an absolute value, so if delta%> 15, we will alert on an increase or decrease of 15%.
- Using ‘*’ in an Alerts filter would first execute a glob match, and then regex. This made it challenging to assure filters were limiting correctly. Regex has been removed for Alerts filters. This will be improved elsewhere in the application in upcoming releases.
- The RPC to download a windows collector has been improved to ensure a 64 bit collector cannot be installed on a 32 bit machine.
- There have been ongoing improvements to field validation in the API, improved error messaging has been added to the UI to ensure valid name creation.
- It takes a few minutes for a newly created instance to display data in a graph, in place of an “Unknown Error” the root cause is explained.
 Dropdown option for datasources in the Device Dashboard has been moved for easier navigation.
- Added the ability to filter the alerts report by a batchjob datapoint.
- New OIDs can be imported directly from Settings | OIDs.
- The Services token ##VALUE## has been limited to the value of the alert, it previously repeated information such as URL, that is available from other tokens. This improves flexibility and configuration of Services alerts.
- Single Sign On users using Azure Active Directory would receive a session error if the Azure AD session had timed out. This has been replaced with a redirect to the provider sign in page.
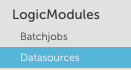 To avoid the confusion of referring to Datasources, Eventsources, and Batchjobs as Datasources, the grouping has been renamed LogicModules.
- Improved border and titles of graph widgets for mobile.
- Clicking in an input field will immediately display suggested results.
- Available groups are displayed in alphabetical order when configuring a Netscan.
- More detailed error messaging is available when testing AWS credentials.
- Search details are preserved when searching in Settings | Datasources.
- Added Show associated devices to Settings | Datasources, when viewing a specific datasource. This also provides the ability to filter by devices with instances.
- The top 10 expanded instances will automatically open upon return to a device dashboard.
Bugs fixed
- Netscan was only returning one device if no group was assigned.
- Running a Service Overview report as ‘last modified by’ was not correctly applying the former user’s role based access control.
- Users with rights to manage a limited set of devices were unable to select “Add Other Monitoring,” limiting the ability to add web page or windows processes to be monitored.
- Global thresholds were displayed incorrectly. The issue with the values has been corrected, and the overall layout improved.
- When creating an eventsource, changing the type would cause Save to fail.
- Specific service alerts were included in the Device alert view.
- Device sear
ch now also searches device descriptions and IPs.