v.71 Release: New Device Tree, Table Widget, Slack and PagerDuty integrations
Last updated on 14 September, 2022With v.71, we are thrilled to announce the much anticipated new Device Tree. It offers a compromise between the traditional tree originally featured and the one-level-at-a-time model in the current UI. We think it’s the best of both worlds. This release also brings the promised Table Widget, providing a customizable way to display any variety of datapoints in an easy to scan table. More services improvements, such as ad hoc trace route for ping checks, and new PagerDuty and Slack integrations are also included.
New Device Tree
You know what it is, and why it needed updates, so here’s an overview of the changes:
- The first thing you will notice when you open the new device tree is clicking the arrow to the left of any node will expand that tree level without making the node active (updating the detail panel).
- Clicking on the name of a node will cause the detail panel to update. Clicking on an alert icon next to the node name will update the detail panel with the alerts tab displayed.
- To drill into a specific group or device, you can select the focus icon in the header. This also works for search results.
- You will notice the device tree panel expands (see above) to allow for many groups and long display names. You can click the collapse arrow at any time to bring it back to the original size. You can also use the lock icon to prevent expansion from happening.
Table Widget
Sometimes numbers, lots of numbers, are what really matter. The table widget enables you to easily compare metrics across devices. This requires a bit of configuration on your part, but we think you’ll find it worth the effort.
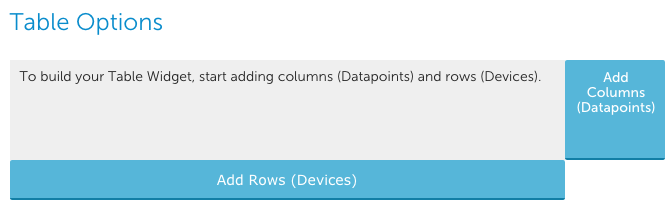
During configuration, you can add any number of devices as rows. You will need to assign a name, datasource(s), and datapoint(s) for each column. While each column will only display one value per device, the configuration allows you to compare similar datasources, such as WinCPU and NetSNMPCPU, across devices. This allows you to evaluate performance, capacity, and risk across different device types.
Integrations
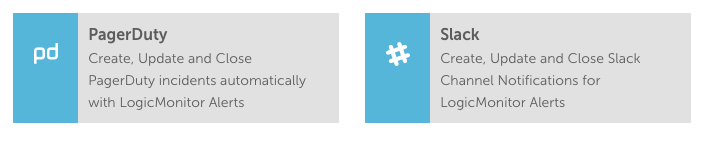 PagerDuty and Slack are now available as in product integrations, allowing alerts to be sent and updated real time based on alert severity and device performance.
Services Improvements
- Trace route is now available for ping checks. While details have always been included in ping related alerts, this new functionality allows you to run it from any location at any time. From your ping check, select the Raw Data tab and choose a checkpoint. Select trace route and the associated details will display.

- An overview graph for ping RTT has been added to each ping service, displaying the average time per testing location
- The test step function for web services includes the full request and response details.
- Role based access control is available for services sub groups.
- Post data is now translated between raw and formatted, to allow for more flexible configuration.
- Service URLs are now taken into account in Services Search. Searching www.google.com will return a service with that name, or any service check with that URL.
Reporting Improvements
Along with recent HTML and architecture improvements, the reports page has been updated. This includes:
- A list view option for existing reports.
- The ability to drag and drop reports between groups.
- From the list view, multiple reports can be selected. Clicking Action allows for the reports to be deleted or moved to a new group.
- Report group descriptions can be included.
- Additional limitations have been added to ensure the configured report can be run. If you receive “Report is too large” errors, we recommend contacting support so we can evaluate configuration options or limit adjustments.
- The from address for reports has been updated to [email protected]. Please adjust email filters accordingly.
As a result of the changes, the toggle UI button will no longer be available for reports.
Mobile Improvements and Bug Fixes:
- Improved sign in experience. Ability to remember password and company name, and an option to change company name has been added.
- Alert, Gauge, and NOC widgets are available for mobile dashboards.
- When active, alert filter information will display on the alerts page.
- The SDT page has received a few more improvements, including referencing SDT for instance rather than alert.
AWS Improvements
- A new Device Dashboard, EC2 – Device and CloudWatch, is available on all AWS EC2 devices. If the standard device display name is the same as the system.aws.tagName, a linked device property will automatically be added. This property allows us to display CloudWatch and collector metrics in a single device dashboard. Note: The dashboard data is currently dependent on the All Datasources device dashboard.
- The configuration for DynamoDB datasources has been updated to better align with AWS terminology.
- A collector is no longer required when creating adding an AWS account.
- AWS groups can be added as subgroups.
Other Improvements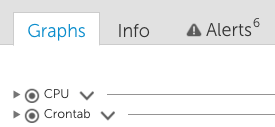
- A graphs tab has been added for groups. This enables you to see compare performance of specific datasource instances across devices in the group.
- The Alert count display has been updated.
- Role management has been improved to make it easier to adjust global view and manage roles. The global settings are now treated as defaults, allowing for customizations to be simpler and more st
raight forward. - A confirmation has been added when thresholds are adjusted, making it clear when the change has taken effect.
- The Device Wizard received a refresh, simplifying the process when we aren’t able to immediately communicate with a device.
- Spaces are no longer allowed in graph and overview graph datapoint names to promote standardization.
- Property inheritance is included in the device properties table.
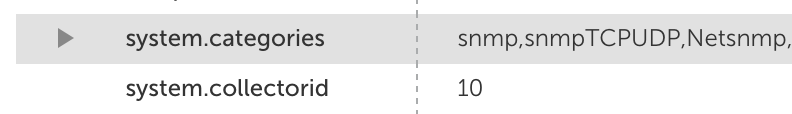 If a property is assigned at a parent group or account, a drop down arrow displays next to the property name. Clicking the arrow will display all groups where the property is configured, as well as the specific group responsible for the active device property.
 - Scheduled Down Time now references Instance rather than Alert, which is more representative of the impact of the SDT.
- The device count displayed next to the account name has been updated to reflect standard devices / AWS devices. This was previously total devices / AWS devices which could be confusing. Full details are available in Settings | Account Information.
- Alert filters are now preserved by user across sessions and browsers.
- If a graph line is isolated in a widget, this is respected when the widget is expanded and vice versa.
- Graph lines will automatically be created in dashboard widgets if none are manually assigned during configuration.
- Collector tokens (##AGENTID##, ##BACKUPAGENTID##, ##AGENT_DESCRIPTION##
##BACKUPAGENT_DESC##) are available for all datasource, event source and batchjob alert templates. - Cluster alert evaluation now includes active alerts on down devices.

- Details of an active SDT display in the device header.
- We updated the order of display when virtual datapoints are added to datasource graphs. They always appear at the bottom of the list, making it clear that previously created datapoints can be used in the calculation.
Bugs Fixed:
- Dynamic groups did not include all devices if the AppliesTo logic resulted in a null property. Re-saving dynamic group criteria is required.
- New datasources were not always correctly applied to the above issue with AppliesTo logic, resulting in a manual Force Datasource Rematch.
- The global threshold information was not displaying when editing instance level thresholds.
- When editing a pie widget’s configuration, the ‘X’ would not close the window.
- Users could not use the edit profile link if they were viewing the device page.
- The datasource filter when viewing alerts from the device page was not including all applicable datasources in the autocomplete list.
- Selecting Configure from a dashboard widget would occasionally display an incorrect widget name on the configure tab.
- Deleting an instance could cause an Overview graph to not display.
- Disabling a datasource would result in an empty instance group. Disabled datasources are now only visible in the Disabled group.
- Selecting a device group when configuring a report could display an overlapped list.
- Latitude and longitude was not always accurately represented in the google maps widget.
- OpsNotes were not displaying correctly for graphs with no data, and were not filtered correctly if the time range was 24 hours.
- Instance descriptions were unintentionally removed from graph names in device dashboards.
- Virtual datapoints in datasources were updated from In to InBytes where necessary.
- Corrected an issue where the property snmp.authToken impacted the ability to add device groups.
- Instance name was not included when ##DATASOURCE## was used if the datasource name did not include “-“. The token will now always include instance name for multi instance datasources.
- Disabled services testing locations were appearing in the location configuration list.
- The Pie Widget was not correctly displaying all virtual datapoints.
- A report could not be deleted if the user who had created the report was no longer active.
- Device groups could not be moved from a subgroup to a primary group. The group can now be updated to be the account.
- The Acknowledged By and Acknowledged On columns in the alert table can now be resized.
- Updated collector curl and wget commands to use -Outfile in place of -O for windows collectors.
- With the addition of specific help role based access control, a duplicate field for Chat with Engineer was created. This was removed from the primary configuration and now only exists in the Help & Support section.
Note: Those datasource wizards among you may notice a batch script collector option. This has a EA collector dependency and will be covered in the collector release notes.