


The v.90 release will be rolled out through the beginning of June. V.90 rounds out several major improvements introduced in our last release, namely an overhauled Alerts Table and streamlined Collector management workflows.
Alerts Table History Tab
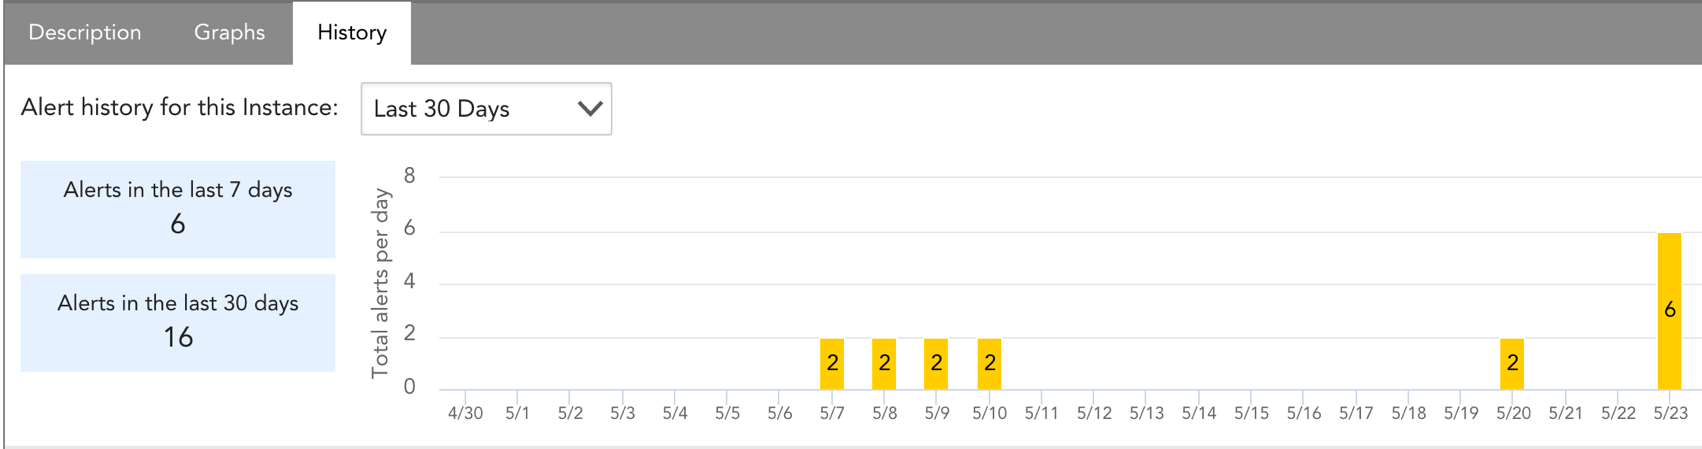 To further enhance the recent Alerts Table changes, we are thrilled to announce the addition of an alerts history tab! You can now view the frequency and severity of alerts over the last 1, 7, and 30 days. This is an ideal at-a-glance view of an instance’s performance over time.
Why you care: A centralized alert history will help you determine whether an alert was a one-off fluke, if thresholds need to be re-evaluated, or if you need to provision more resources to your equipment.
Collector Downgrade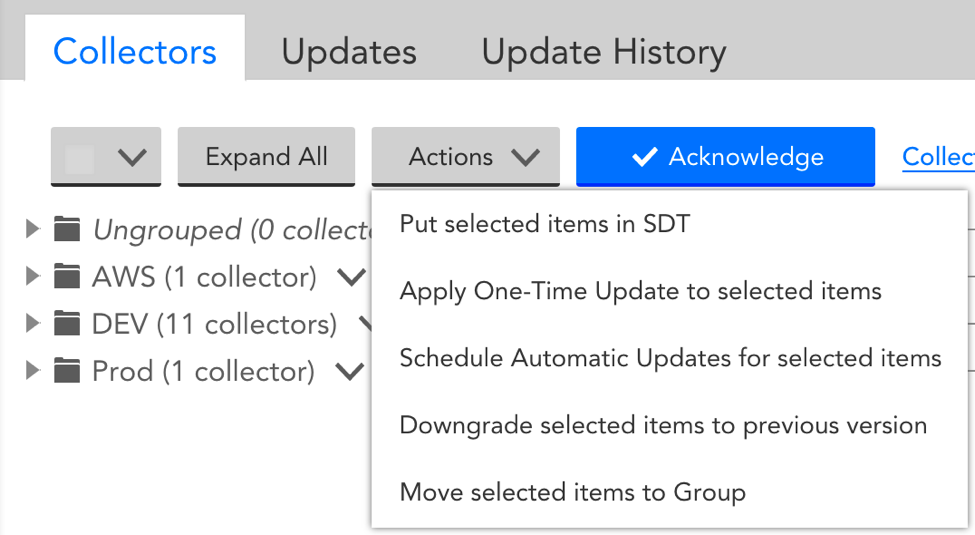
We have added the ability to downgrade a Collector to its prior version. This new functionality is available to all Collectors of version 24.000 or higher.
Note: If the Collector is new (recently installed) or has already been downgraded, the previous version will simply be ‘N/A’.
Why you care: If you suspect issues after upgrading your Collector, “downgrade” will allow you to revert the Collector to the most recent stable version. This is a great excuse to experiment with more Early Release Collector versions since you can rest easy knowing any future upgrades are reversible.
Other Improvements
Alerts
- The Alerts Table will only refresh after 30 seconds of inactivity. This prevents a refresh during alert investigation.
Collector
- “!snmpget” and “!snmpwalk” commands will now return the specific port number for a device. This is useful when troubleshooting a device that uses a port other than its default.
- In some cases, ‘Collector Down’ notifications would appear at login even after being acknowledged/suppressed. This has been improved.
- We will no longer automatically create the “Collectors” Device Group each time a Collector device is added into monitoring. Since the group was dynamic, Collector devices will continue to be added unless you manually delete the group.
- We have added the ability to expand/collapse all groups on the Collector page.
Dashboards
- You can configure the Gauge Widget to change colors when its displayed value meets a designated threshold. For instance, if user-defined thresholds for CPU are set at 95/97/99 for a warning, error, and critical alert, respectively, the Gauge Widget will change colors once it surpasses each of these thresholds. This is great for at-a-glance evaluation of a datapoint’s performance.
- Service Overall Status graphs now display the status number and description when you hover over the graph line.
Devices
- Added support for double-click in device search results. Double-click will now focus the tree on a selected item.
Devices (AWS)
- Improved the detail returned by the !cloudaddetail command to include status, start time, and duration.
- Improved the error message returned when a user with insufficient permission tries to add an AWS account into LogicMonitor.
- Added a new property, system.aws.arn, to AWS resources. You may find this useful for searching for AWS resources by ARN, e.g. querying devices via API and filtering based on the new system.aws.arn property.
LogicModules
- Test Script results now include STDERR in addition to STDOUT.
- We no longer auto-pair special characters such as quotation marks, brackets, and parenthesis for embedded Groovy scripts.
- We have added a Test option for AppliesTo functions. This enables you to determine the devices to which the function will apply during function creation and updates.
- Added SDT history for Config instances.
Reports
- A device group field was added to the Alert Trends Report. Previously, multiple devices had to be individually identified in the report configuration. This new field enables you to quickly include all devices in a group.
REST API
The following changes have been made for version 1.3.3 of the REST API:
- Ops Notes created via the REST API were not displaying correctly if groupId was omitted from the scope field.
- We increased the max value of the size parameter for our REST API from 300 to 1000. This is especially useful for paginating through a large number of resources.
- We published the ability to get ConfigSource data (configs and config diffs) via our REST API. You may find this useful for comparing configs between devices, or if you’re using an offline config repository.
- We published the ability to programmatically manage escalation chains via our REST API.
- We published the ability to get data in CSV format. Previously, you could only retrieve data in JSON format.
Services
- Added an “Applied at” column to the Services SDT history table.
Settings
- Collector configuration updates will now be recorded in the Audit Log.
- A new default role, Manager, has been added. This role has manage permissions across most of the application, but no rights to Collector or Settings pages.
- Changing the time range on the Ops Notes page will no longer affect the time range portal-wide.
Bugs Fixed
- When PropertySources were removed, dynamic group membership was not instantly re-evaluated.
- Some special characters were interpreted incorrectly in Config checks
- ##POLLINTERVAL## token was causing test script to fail
- The Alert Widget did not reflect the correct custom property when there was a combination of instance-level and device-level properties.
- Some devices were inadvertently favorited in the mobile application.
LogicModule Releases
Below is a full list of new/improved LogicModules as well as bug fixes that were implemented since our last release:
New Monitoring Coverage
- Microsoft Azure – 3 DataSources
- HPE Networking ConfigSource (ProCurve | ComWare) – 1 ConfigSource
- Juniper Class Of Service (COS) – 4 DataSources
- HP PDU Stats – 1 DataSource
- Ubiquiti UniFi Wireless – 3 DataSources
- HP MSA / HP StorageWorks / HP P2000 – 13 DataSources/1 SysOID Map
- H3C – 4 DataSources/1 SysOID Map
Monitoring Fixes & Updates
- VMware vSphere Host Performance
- Dell Networking – PowerConnect 6200
- Windows SQL Server Connection
- Citrix Licenses
- EMC Enclosure Environment
