v.91 Release: Lambda Discovery Filters and Alert Graph Improvements
Last updated on 14 September, 2022The LogicMonitor team has embarked on a long-term initiative to tighten and automate workflows in our platform. You should expect some exciting changes that will make monitoring even easier and more insightful. Because a lot of this work is going on behind the scenes, you may notice the next several releases (this one included) are a bit lighter. Stay tuned- we have many awesome improvements on the way! For the v.91 release, you will see the following changes:
Lambda Discovery Filters
We have added a Tag Filter for discovery of Lambda Functions.
Why you care: AWS recently added support for Lambda tags. LogicMonitor’s ability to ingest these tags allows you to manage/monitor Lambda FCNS just as you do in AWS (e.g. groups by tags, Dashboards based on tags, etc.).
Alert Graph Improvements
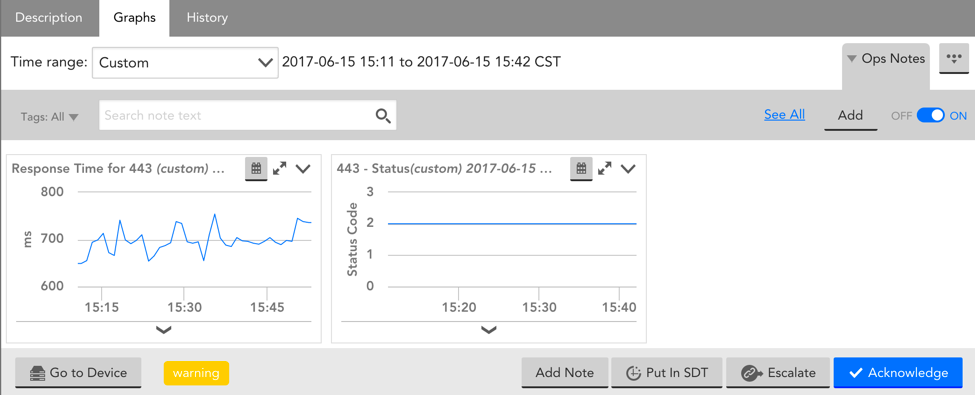
We introduced two major changes to our alert graphs:
1. You can now use the global time range when viewing alert graphs.
2. We added an Ops Notes panel to alert graphs
Other Improvements:
Alerts
- The “At time of alert” time range now truncates to the current time if the alert occurred within the last 30 minutes.
Devices
- You can now change the preferred Collector for more than 25 devices at a time.
- Improved the display of data in Forecasting graphs.
- With EA 24.085, Poll Now will display the query command under Raw Request/Response. This can be used when troubleshooting NaN responses to verify whether there is a configuration issue.
- We will not move a device to an alternate Collector if the IP already exists on the chosen Collector.
Devices (AWS)
- LogicMonitor requires billing files to exist in the designated S3 bucket in order to monitor AWS Billing. When these filed are not present, we will not display an error message.
Integrations
- We improved the ConnectWise integration configuration to allow autocomplete of Service Board names, teams, and ticket types.
LogicModules
- Added an “Instances” tab to multi-instance ConfigSources to improve management and viewing.
- When creating a complex datapoint, the order in which its component datapoints display in the UI will no longer impact its calculation.
Reports
- We improved the logic around glob expressions when adding Device or Device Group names to the SLA and Alert SLA reports.
- We have added support for Device Group-based graphs in the Device Metric Trends report. This allows one graph per group to be displayed for each defined DataSource.
Services
- Services can now be dragged and dropped into groups much like devices in the Devices Tree.
Settings
- We improved the logic behind graphs’ refresh rate when Ops Notes are added/updated/removed.
- We have made the primary Collector Device name clickable from the Collectors page if it is being monitored by the associated Collector. This allows you to quickly navigate to the Collector DataSource graphs when troubleshooting a Collector issue.
- Any instance related informational events (i.e. instance found, instance disappeared) will now display in the audit log instead of the Collector Events window.
- Added support for Israel Standard and Summer timezone.
Other Minor Improvements
- Minor Internet Explorer display improvements
- We improved the handling of errors when a device’s preferred Collector is changed and when toggling alerting off/on based on RBAC.
Bugs Fixed
- AWS ELBs were not properly discovered when detected en masse (ie. hundreds of ELBs at once). We improved our discovery logic to avoid this issue moving forward.
- Exporting a DataSource to XML was not working on Safari.
- Fixed a bug that was causing the flow tables in the Traffic tab to not update when zooming in on the Throughput Graph.
- Fixed a bug that caused some columns to not sort by their actual value when viewing tabular data for graphs.
- Users without dashboard permissions were getting “Access Denied” popups at login.
- Fixed an issue that caused column layout preference to not be saved when navigating between Device/Instance graphs.
- Auto-complete for alert filters wasn’t always working for names including special characters.
- Fixed a bug that cause autocomplete to not work for “system.createdon” and “system.updatedon” properties on the Device Inventory report.
- Fixed a bug to allow special characters as filters in the Alerts report
LogicModule Releases
Below is a full list of new/improved LogicModules as well as bug fixes that were implemented since our last release:
New Monitoring Coverage
- Linux Monitoring (SSH) – 8 DataSources / 1 PropertySource
- LogicMonitor Collector Monitoring Suite – 24 DataSources
Monitoring Fixes & Updates
- Cisco IOS (ConfigSource)
- Microsoft Azure
- AWS Elasticsearch
- Elasticsearch Cluster Statistics
- Cisco IPSec Tunnel
- Windows HyperV CPU
- VMware vSphere Host Performance
- MySQL
- Isilon Node Disks