Complex Datapoints
Last updated on 16 September, 2021Overview
A datapoint is a piece of data that is collected during monitoring. Every DataSource definition must have at least one configured datapoint that defines what information is to be collected and stored, as well as how to collect, process, and potentially alert on that data. LogicMonitor defines two types of datapoints: normal datapoints and complex datapoints.
Normal datapoints represent data you’d like to monitor that can be extracted directly from the raw output collected. For more information on normal datapoints, see Normal Datapoints.
Complex datapoints, on the other hand, enable post-processing of the data returned by monitored systems using data not available in the raw output. This is useful when the data presented by the target resource requires manipulation. For example, on a storage system you typically want to track and alert on percent utilization, which can be calculated based on total capacity and used capacity.
Since the values of complex datapoints are stored in their calculated forms, they can be used in graphs, reports, dashboards and other places in your portal.
LogicMonitor defines two types of complex datapoints: standard complex datapoints and Groovy complex datapoints. Each is discussed in detail in the following sections.
Note: Complex datapoints are configured from the DataSource definition, as outlined in Datapoint Overview.
Standard Complex Datapoints
Standard complex datapoints use LogicMonitor’s expression syntax to calculate new values based on the values of datapoints or device properties.
For example, the SNMP interface MIB provides an OID that reports the inbound octets on an interface (InOctets). Operations engineers tend to think in terms of Mbps rather than octets, so we can convert the value carried by the InOctet datapoint to Mbps using the following expression:
InOctets*8/1000/1000
Standard complex datapoints can also reference device properties within their expressions; simply enclose the property name in double hash marks (i.e. ##PROPERTYNAME##).
For example, consider that you want to calculate throughput based on a bandwidth limit set for a particular device. You could set a property named “ManualBandwidthLimit”, and then use that property within a standard complex datapoint calculation, as follows:
InOctets*8/##ManualBandwidthLimit##
In this use case, care must be taken to ensure the custom property is defined on all the devices to which the DataSource applies. If the property cannot be found, it will be replaced with an empty string, resulting in an error being returned.
To prevent this issue you could create a standard complex datapoint expression that retrieves the property, and a second standard complex datapoint expression that only uses the property if it has a valid value.
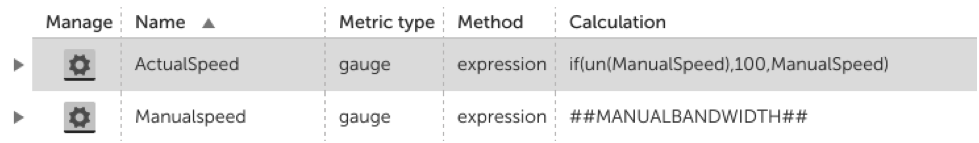
Constructing Standard Complex Datapoints Using Datapoint Expression Syntax
Datapoint expressions can be written in either Infix or RPN (reverse Polish notation) notation.
Infix example:
(sendpkts-recdpkts)/sentpkts*100
RPN example:
sendpkts,recdpkts,-,sentpkts,/,100,*
Note: All expression examples in this support article are presented using the Infix notation.
Expression Operands
There are three kinds of operands that can be used in datapoint expressions:
- Datapoint names
- Device property names
- Arbitrary numbers
The following example uses numbers and datapoint names to calculate the percentage of inbound packets discarded on a particular interface:
100 * InDiscards/(InBroadcastPkts+InUcastPkts+InMulticastPkts+InDiscards)
Expression Operators
Datapoint expressions support the typical operators you find in most programming/scripting languages.
Arithmetic Operators
Bitwise Operators
Logical Operators
Note The Boolean data type is not supported in datapoint expressions. Instead, any non-zero value will be treated as TRUE and zero will be treated as FALSE. So, in the case where both operands are non-zero,
&& / and
|| / or
Expression Functions
In addition to using operators to perform calculations, you can use the following functions in datapoint expressions:
Conditional Syntax
Comparison Functions
The following comparison functions are available. Typically these are used within a conditional (if) statement.
Mathematical Functions
A number of mathematical operations are available:
Constants
The following mathematical constants can be used:
Percentile Functions
Percentile functions are special functions that can be used only in virtual datapoint definitions (within graphs and widgets)—not in complex datapoint expressions. For more information on virtual datapoints, see DataSource Graphs.
Percentile Function Examples
- Consider plotting an hourly graph for bandwidth (bps). In our database, we’ve collected 10 values for bps for this hour: [2, 3, 7, 6, 1, 3, 4, 10, 2, 4]. If we sort this array, they will be [1, 2, 2, 3, 3, 4, 4, 6, 7,10]. The percent(bps, 95) function will return 10 (the 9th value in the 0-based array) – meaning that 95% of the samples are below this value.
- As another example, to calculate the 95% traffic rate (using the max of the in and out 95% rate, as many ISPs do), you could add the following to the Throughput graph of the snmp64_If- datasource:
- Add a virtual datapoint 95In, with an expression of
percent(InMaxBits,95) - Add a virtual datapoint 95Out, with an expression of
percent(OutMaxBits,95) - Add a virtual datapoint 95Percentile, with an expression of
if(gt(95In,95Out), 95In, 95Out) - Add the graph line 95Percentile to plot the 95% line in whatever color you choose.
- Add a virtual datapoint 95In, with an expression of
- Also, note that percentile functions require that x is a datapoint rather than an expression. Meaning:
percent(InOctets*8, 95)will not work, but…percent(InOctets, 95)will
To implement the former, first create a virtual datapoint containing the mathematical expression and use that datapoint as an argument to the percentile function.
Special Case: Negative Values
Datapoint expressions cannot start with a negative sign. To use a negative value in an expression, subtract the value from zero (e.g. use 0-2 rather than-2).
Special Case: Unknown Values
Unknown values are dealt with in two ways, as either part of a test condition, or as a result.
Consider the expression:
if(un(DatapointOne),0,DatapointOne)
In this case, the expression will return 0 if the value of DatapointOne is unknown (NaN — not a number, such as absence of data, data in non-numerical format, or infinity). If the value of DatapointOne is anything other than NaN (an actual number) then that number will be returned.
Next, consider:
if(lt(DatapointTwo,5),unkn,DatapointTwo)
This expression will return NaN (which will be displayed as “No Data”) if the value of DatapointTwo is less than number 5. If DatapointTwo returns value greater than 5, then that value will be displayed.
NaN values also need special consideration when used with operations that only return true/false. Java language specification dictates that logical expressions will be only evaluated as the result TRUE or FALSE even if one of the operands is NaN. For example, the expression eq(x,y) will always be evaluated as a result of 0 or 1 even if the x and/or y is NaN.
To work around this, you can check the values before performing are NaN before the expression evaluation:
if(or(un(Datapoint1), un(Datapoint2)), unkn(), <expression to evaluate>)
Below is a list of operator/function behavior with NaN values:
Groovy Complex Datapoints
Groovy complex datapoints employ a Groovy script to process the raw collected data. In a Groovy complex datapoint, you have access to the raw data payload, but not the actual datapoints (e.g. those calculated as a “counter” or “derive”). Also, Groovy allows for calculations based on both device and instance properties. Typically one would use a Groovy complex datapoint for manipulating data in a way that cannot be achieved with a standard complex datapoint.
In most cases, you can use standard complex datapoints to manipulate collected data. But, when you need to do additional processing not possible with datapoint expressions, you can turn to Groovy scripting for more full-featured datapoint calculations.
When you use Groovy to construct a complex datapoint, the Collector pre-populates Groovy variables with the raw data collected from normal datapoints. The type and syntax of these objects varies based on the collection method employed by the DataSource. See the table below for the variable name(s) assigned based on the collection type.
Note: Groovy complex datapoints reference the raw data exactly as it’s collected (i.e. as a “gauge” datapoint), rather than calculated as a rate such as “counter” or “derive” datapoint.
Once you’ve processed your data in Groovy, you’ll need to use the
return();
Device and Instance Properties in Groovy Complex Datapoints
You can use the device or instance properties that you’ve collected within a Groovy complex datapoint.
Device or instance properties can be referenced within Groovy as:
hostProps.get("auto.PropertyName")to retrieve a device propertyinstanceProps.get("auto.PropertyName")to retrieve an instance propertytaskProps.get("auto.PropertyName")to retrieve a property of either type
See Embedded Groovy Scripting for more details and examples.
Example: Groovy Complex Datapoint using WMI
Consider a WMI datasource that queries the class Win32_OperatingSystem. If you needed to use the raw date output from the WMI class you would write something like:
rawDate=output["LOCALDATETIME"];
return(rawDate);
Example: Groovy Complex Datapoint using SNMP
Consider an SNMP datasource that queries interface data, such as snmp64_If-. If you wanted to perform some calculations on the raw values returned you might do something like the following:
// iterate through output array
output.each
{ line ->
    (oid, value) = line.toString().split('=');

    // get inOctet and outOctet values
    if (oid.startsWith(".1.3.6.1.2.1.31.1.1.1.6"))
    {
        totalInOctets = value.toFloat();
    }
    else if (oid.startsWith(".1.3.6.1.2.1.31.1.1.1.10"))
    {
        totalOutOctets = value.toFloat();
    }
}

// sum the values and return
totalOctets = totalInOctets + totalOutOctets;
return(totalOctets);
Example: Groovy Complex Datapoint using JMX
In this example, consider a JMX Mbean that returns a time as a date string. There are many ways of presenting time as a string, so LogicMonitor cannot include a post-processor for all possible formats, but this is easily achieved with a Groovy script. If the following Mbean returns a time in the form “Thu Sep 11 06:40:30 UTC 2016”:
solr/##WILDVALUE2##:type=/replication,id=org.apache.solr.handler.ReplicationHandler:replicationFailedAtBut we wish to create a datapoint that reports the time since now and the time of that Mbean, we could use the following as the Groovy code:
rawDate = output["solr/##WILDVALUE2##:type=/replication,id=org.apache.solr.handler.ReplicationHandler:replicationFailedAt"];
Date fd = Date.parse( 'EEE MMM dd HH:mm:ss z yyyy', rawDate );
today = new Date();
timeDiff = (today.time - fd.time)/1000;
return (timeDiff);
Example: Groovy Complex Datapoint using HTTP
Here’s a simple example of how you might use Groovy to manipulate the status code returned by the HTTP collection mechanism.
if (status < 2)
{
    myStatus = 5;
}
else
{
    myStatus = 10;
}

return(myStatus);