Log File Monitoring
Last updated on 07 May, 2025Disclaimer: This content is no longer being maintained and will be removed at a future time. For more information on the recommended way to ingest logs, see Log Files LogSource Configuration .
Overview
LogicMonitor lets you monitor log files generated by your OS or applications such as MySQL, Tomcat, and so on. For example, you can monitor the MySQL slow query log so an alert will be triggered every time a slow query is logged in the log file.
Note: A LogicMonitor Collector must have direct file access to all log files you would like to monitor.
The Collector must be able to read the files to be monitored – in most cases, this means the Collector must be installed on the server with the log files (access via a network mount – NFS, or CIFS, etc – of course works fine.) Log file monitoring complements our syslog monitoring facility. (In many cases, you can configure your log files to be sent via Syslog to the LogicMonitor Collector, which then negates the need to install a Collector locally on the server.) By editing the Log File EventSource you can control which log files to monitor, what pattern to look for, and what kind of alert messages to trigger. The Collector checks every line appended to the monitored log files. If the new line matches a configured pattern, an alert event will be triggered, and the Collector reports it to the LogicMonitor server, so users can get notifications via Emails/SMS, generate reports, etc.
Note: The check runs every second to detect modifications to the monitored files.
How to Configure
This section uses a concrete example to show you how to monitor log files. For example, we have a Linux device dev1.iad.logicmonitor.com that runs a Tomcat web server. We want to monitor Tomcat’s log file catalina.out so an alert will be sent every time Tomcat is shutdown for whatever reason (e.g. the JVM crashes or someone kills Tomcat). Here is the procedure for doing so:
- Install a Collector locally on this server. See Installing Collectors.
- Go to Settings | LogicModules | EventSources | Add | EventSource to open the Create New EventSource form.
- Complete the General Information section, making sure to select the EventSource type of “Log Files” from the Type field’s drop-down menu.
- Define the log files you want to monitor in the Log File Collector Attributes section. At least one log file should be specified, but you may add more than one, as shown next.
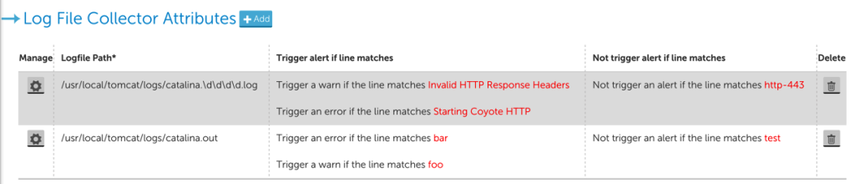
In the above example, two log files are to be monitored: the first one is a dynamic pathname, using a glob (i.e. wildcard) expression. The second one is a fixed pathname that uniquely identifies a file in the filesystem of the device where the Collector is running. For each specified log file, each line added to the log file will be matched against the given Trigger alert if line matches and Not trigger alert if the line matches criteria. You can modify or define the criteria in the dialog when you click the Manage (cogwheel) icon or +Add button. In this dialog, you define the path of the log file, and the event criteria.
Matching Criteria
There are two sections for specifying the criteria that control whether an alert will be triggered. In both cases, the criteria can be given as a regular expression or plain text: Matching criteria specify the conditions to trigger an alert. Multiple criteria are evaluated independently in the order they appear until a match is found. This means if the log file line matches multiple criteria, an event will be generated for the alerting level defined by the first criteria it matches. Using the example shown in the previous screenshot:
- If a line containing just “Invalid HTTP response headers” appears in the monitored logfile, a WARN event will be generated with the whole line as the event message.
- If a line containing just “Starting Coyote HTTP” appears in the monitored logfile, an Error event will be generated.
- If a line containing both “Invalid HTTP response headers” and “Starting Coyote HTTP” appears in the monitored logfile, then, since “Invalid HTTP response headers” is defined before “Starting Coyote HTTP”, a WARN event will be generated, and no Error level event will be generated.
Not Matching criteria are evaluated before Matching criteria, so if a line in the logfile contains any pattern defined in the Not Matching criteria, no events will be generated. Not Matching Criteria are evaluated independently; if the logfile line matches any of the non matching criteria, no event will be generated.
Note: It is possible to use part of the line as the message of generated events by using a regular expression to define acapture group. The captured content will then be used as the message of the generated events.
Be aware that if you do not have a Collector installed on a device, but this device is included in the Applies To for a log file monitoring EventSource that is also applied to another device which has recently generated an alert, then this alert will be falsely duplicated on the device that does not have a Collector installed.
Monitoring Glob Filepaths
In the above Linux filepath example, the Glob checkbox is checked, meaning the logfile pathname shall be interpreted as a glob expression. This allows you to monitor a variable filepath. A special consideration to take into account when monitoring globbed Windows filepaths is that backslashes must be escaped with another backslash, as depicted in the below example:
Logfile Path
The full path to your Logfile. Note that this path is case sensitive.
Glob
Selecting this option will allow you to use glob expressions in your Log File path. When Glob is enabled, we will monitor a batch of filed that match the Glob path. The monitoring will look for new lines/changes appended to the last modified file.
You will want to ensure that your file separators are escaped with doubles slashes, ie. C:\\Program Files (x86)\\LogicMonitor\\Agent\\logs\\w*.log
In this example, the glob path will match all log files starting with “w,” such as watchdog.log and wrapper.log. Note that you can only monitor one of these log files at a time. As such, monitoring will rotate between watchdog.log and wrapper.log for each polling cycle. If you would like to monitor both these logs at the same time, you would need to create two distinct Log File paths (ie. with wa*.log and wr*.log) or create two separate Log File EventSources.
Note: If you are using glob expressions with UNC paths, the UNC path must start with four backslashes (“\\\\”).
Collecting Events – Summary
As noted above, the device with the log file to be monitored must have a Collector installed. When the Collector starts up, it will:
- Monitor the file names of a dynamic logfiles (i.e. the logfile given as glob expression) to find the latest logfile to be monitored. The latest logfile is determined by the last access time of the logfile.
- Tail the monitored log files to read new lines.
- Match each new line that is read against defining criteria.
- Filter & report events back to server to generate an alert.
Example: Monitoring Log Files for Application Response Times
This demonstrates how to monitor an application log file for the response time of the application. We will install a small daemon onto the system, which uses Perl’s File::Tail module to watch the specified log file, and Berkeley DB to track the number of processed requests and the total elapsed time.
Note: While the scripts and procedures covered on this page will work in many situations, they are presented as an example only, and may require customization. They are easily modified to cover different versions of Linux; different file locations, counting more than the last 100 samples for the max, etc. If you need assistance with these matters, please contact LogicMonitor support.
These are the steps:
- Ensure the Perl module File::Tail is installed on the host with the log file to be monitored. (Not covered in this document.)
- Download AppResponseStats-updater.pl into /usr/local/logicmonitor/utils/ and chmod it to mode 755. This file runs as a daemon, and tails the specified log file, watching for lines of the form “Completed in 0.34 seconds” (the format typically used by Ruby-on-Rails applications). For each such line, it increments a counter, and also increases the Total Time record in a Berkeley DB.
- install AppResponseStats-reporter.pl into /usr/local/logicmonitor/utils/ and chmod it to mode 755. This file is called by snmpd to report the data logged by the daemon.
- Download the startup script AppResponseStats.init into /etc/init.d/. Chmod it to mode 775, and set the script to start on system boot
- modify the snmpd configuration to run the reporting script when polled, and restart snmpd
- wait for (or trigger) ActiveDiscovery so that the datasources to monitor the reported data are active
Quick Start Script
This script can be used on a host to complete most of the setup. You must still check the steps below the script:
Change location of monitored log file, if necessary
Modify the file AppResponseStats-updater.pl to point it towards the application log by editing the line that reads:
If you wish to match lines other than “Completed in “, modify the regular expression in this section of code:
Start the Daemon
Set the daemon to autostart on system boot:
On Debian:
On SuSe or Redhat:
Activate the DataSources
The DataSources AppResponseStats- and AppResponseStatsProcess should be part of your default datasources. If not, you can import them from core.logicmonitor.com. The datasources will automatically discover if your hosts are set up to report application log times – but that may take several hours. You can speed this up by Run Active Discovery on the hosts that you have set these processes up on. You should then see two new set of datasource graphs – one monitoring the status of the daemon, and one monitoring the response time, 95 percentile response time, and DB component time and number of requests of your applications. (95 percentile is a more useful measurement than the maximum response time – the maximum response time is too affected by outliers.)
The default threshold for triggering a response time warning is 4 seconds – which, like all other thresholds, can be tuned globally, or on a group or device basis.
Support Types of Encoding for Log Files
By default, LogicMonitor supports files encoded with Windows-1252 for Windows and UTF-8 for Linux. Please note that the default encoding can vary based on your operating system.