
Overview Tab
Last updated – 24 July, 2025
The Overview tab appears when a host resource is selected from the Resources Tree. It provides an at-a-glance view of uptime, DataSources, and associated graphs.
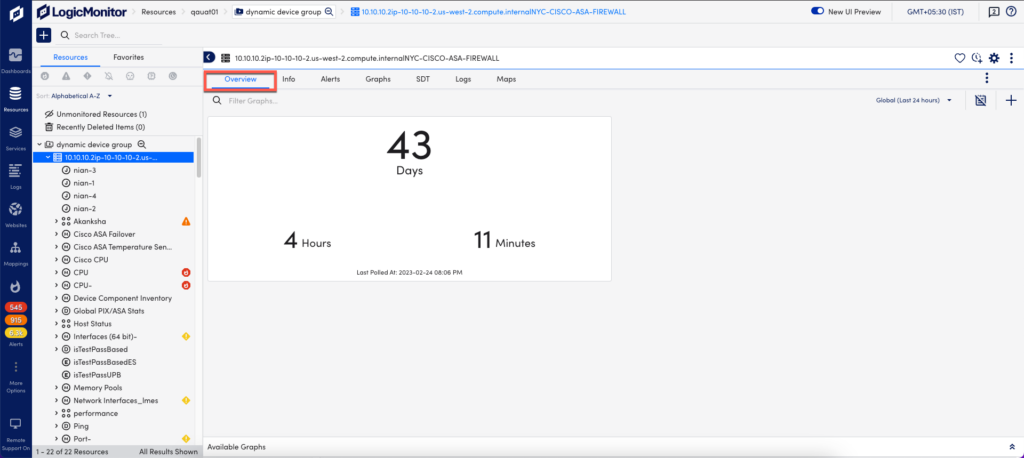
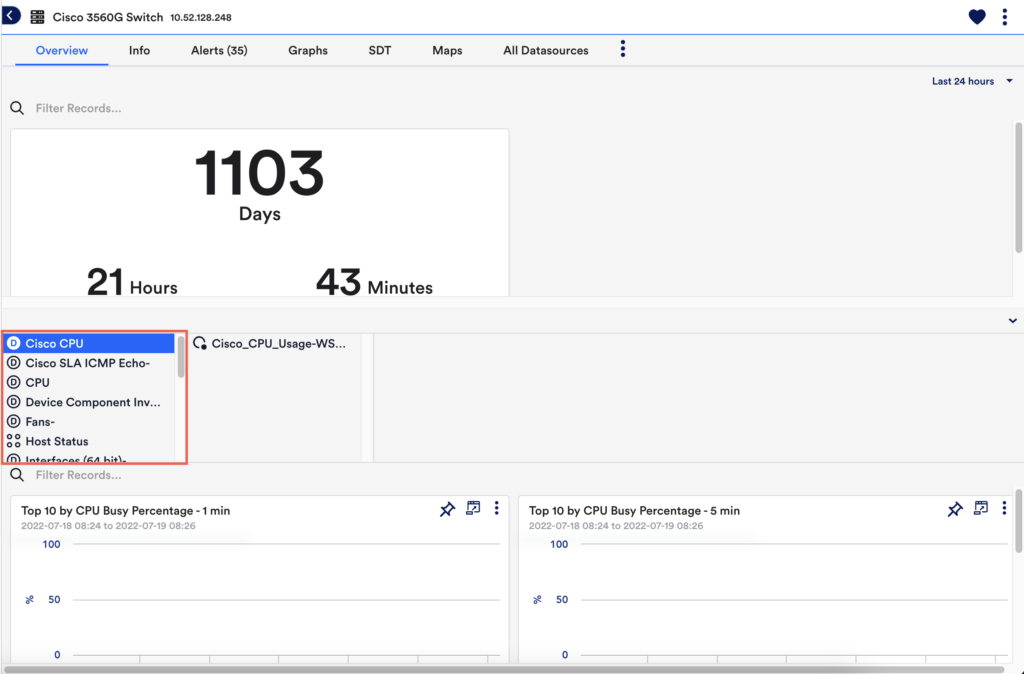
Viewing Graphs
Select a DataSource or an Instance from the filter panel provided to view any associated graphs.
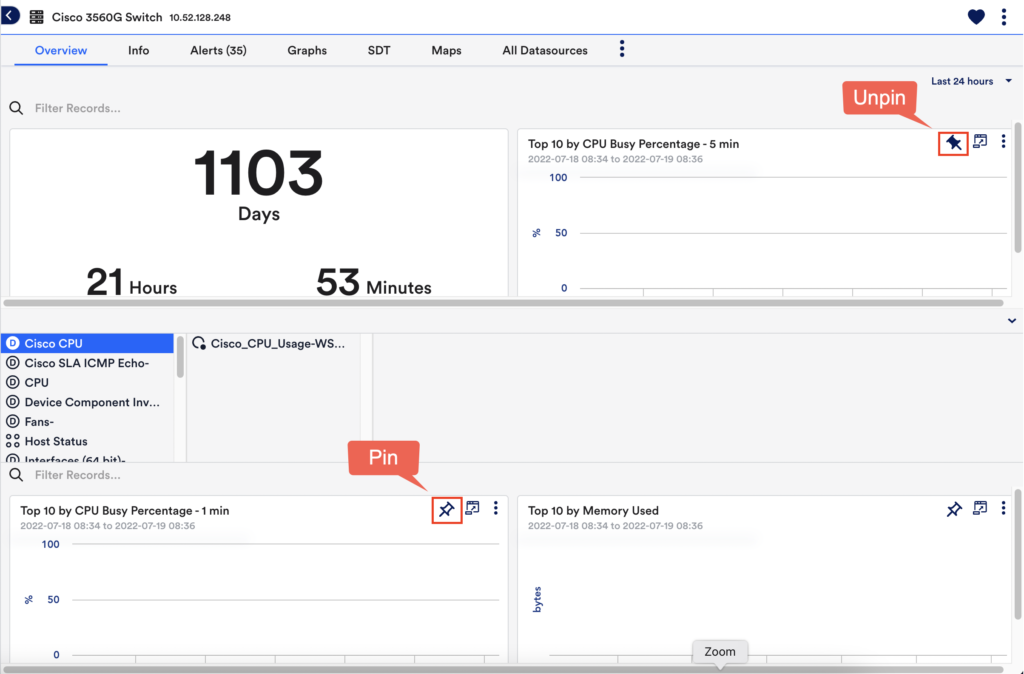
Using the Pin Feature
Use the pin feature to add or remove graphs from the Overview tab.
- To add a graph to the Overview tab, click the graph’s Pin icon

- To remove it, click Unpin

For more information about using graphs, see DataSource Graphs.
