v.138 Release
Last updated on 14 September, 2022
v.138 Highlights:
- Feature Highlight: Dynamic thresholds (phase two)
- Platform Enhancements: LM Exchange enhancements, ability to add multiple resources to topology maps at once, new Collector EA 29.100 available, and more
- New and Updated Monitoring Coverage: AWS EventBridge, Couchbase Server, Dell EMC XtremIO, Linux SSH, Palo Alto Firewall, and more
- Looking Ahead: SiteMonitor IP address updates, elimination of percent() function use in complex datapoints
Feature Highlight: Dynamic Thresholds (Phase Two)
Note: Dynamic thresholds phase two will be activated for all Enterprise customer portals on July 16. At this time, if you currently have dynamic thresholds enabled for any datapoints, the new phase two functionality will automatically be enabled for those datapoints as well. Visit Enabling Dynamic Thresholds for Datapoints for more information on the enhancements and features included in phase two.
Last November, LogicMonitor released phase one of our AIOps Early Warning System. In this first phase, we brought you dynamic thresholds and root cause analysis. As part of our phase two efforts, we’re expanding the capabilities of dynamic thresholds.
In phase one, dynamic thresholds suppressed alert notification routing if the alert’s triggering value was not deemed anomalous by our anomaly detection algorithms. In other words, alert notifications that represented data values that fell within expected data ranges were automatically suppressed for the purpose of reducing alert noise.
With the enhancements available in phase two, dynamic thresholds now also automatically alert on values that fall outside expected data ranges.
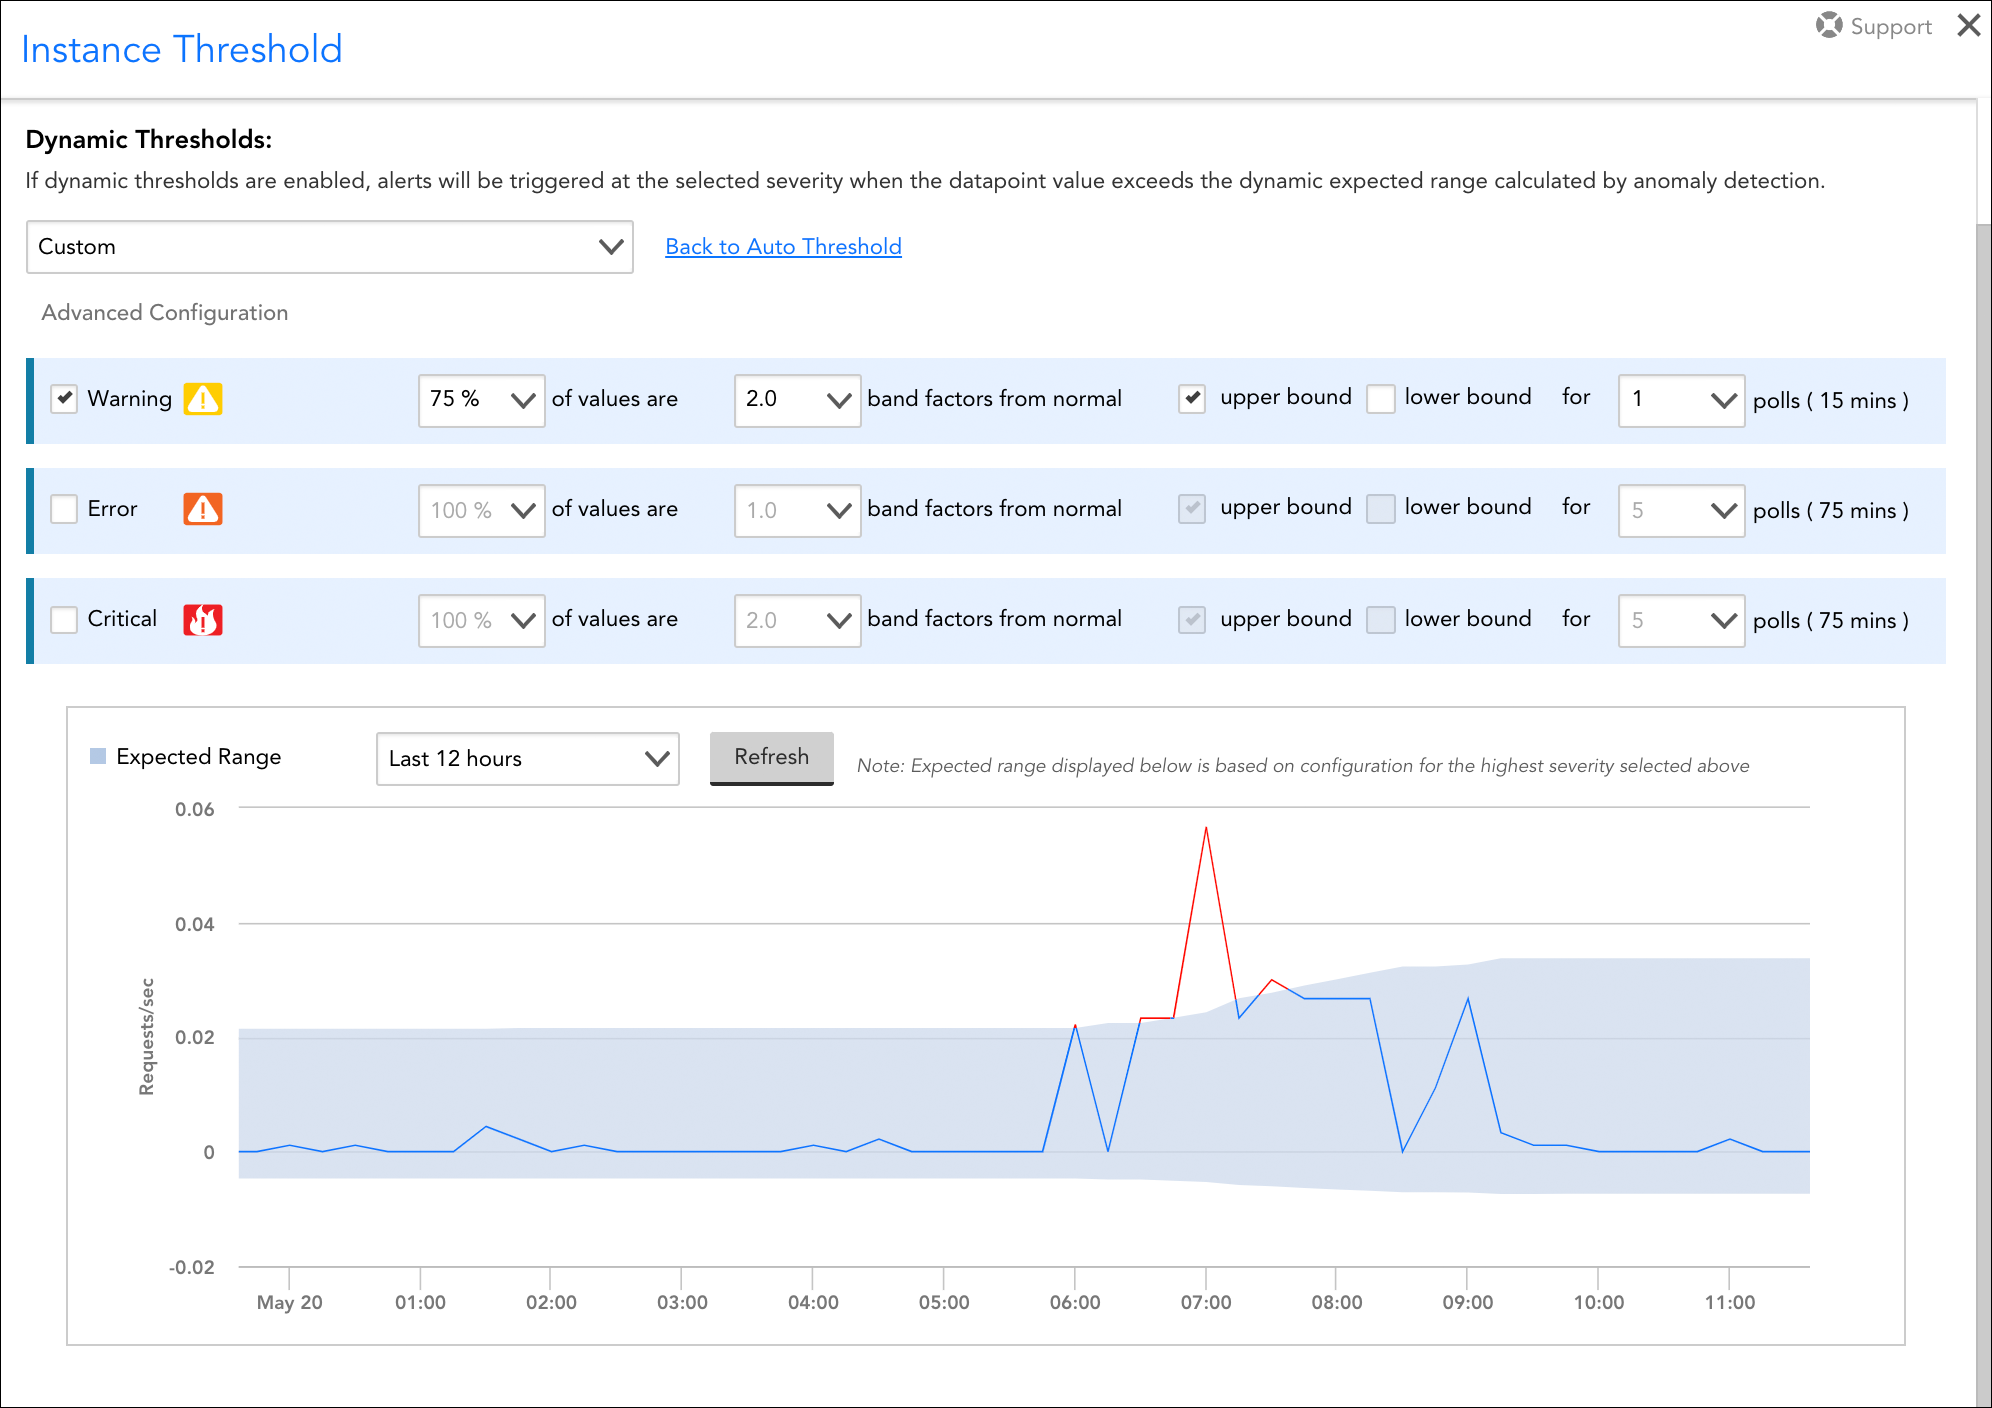
By building upon our ability to recognize and proactively act upon anomalous data, we’re giving you the best of both worlds:
- Reduced noise when static datapoint thresholds aren’t tuned well (through notification suppression)
- Earlier alerting of issues that haven’t yet been (or perhaps never will be) caught by static datapoint thresholds.
Platform Enhancements
Alert Integrations
- Improved alert clear behavior.
- An alert clear notification is now delivered when Active Discovery removes the DataSource instance that triggered an alert (due to the instance no longer existing). Previously, the alert was removed and an alert clear notification was not sent if the instance was removed, resulting in orphaned tickets in third-party applications.
- Previously, if an alert severity change and an alert clear took place within the same alert scanning cycle, alert clear was not successful, resulting in orphaned tickets in third-party applications. This has been fixed.
Audit Logs
- Logging of device group moves. Previously, the action of moving a device group was not adequately logged in Audit Logs. Now, details for the removed/added parents of the group are added to the Audit Logs.
Collector
- Collector EA 29.100. LogicMonitor recently released a new EA Collector version. Highlights include:
- XL and XXL size collectors for 16 and 32 GiB of RAM.
- Collector Script Cache to allow caching of session tokens between collection intervals, without storing on the filesystem.
- Ability to migrate a Collector running as root or Administrator to a non-root or non-Administrator user.
- TinyRADIUS Java Library inclusion.
See EA Collector – 29.100 for more details.
Dashboards
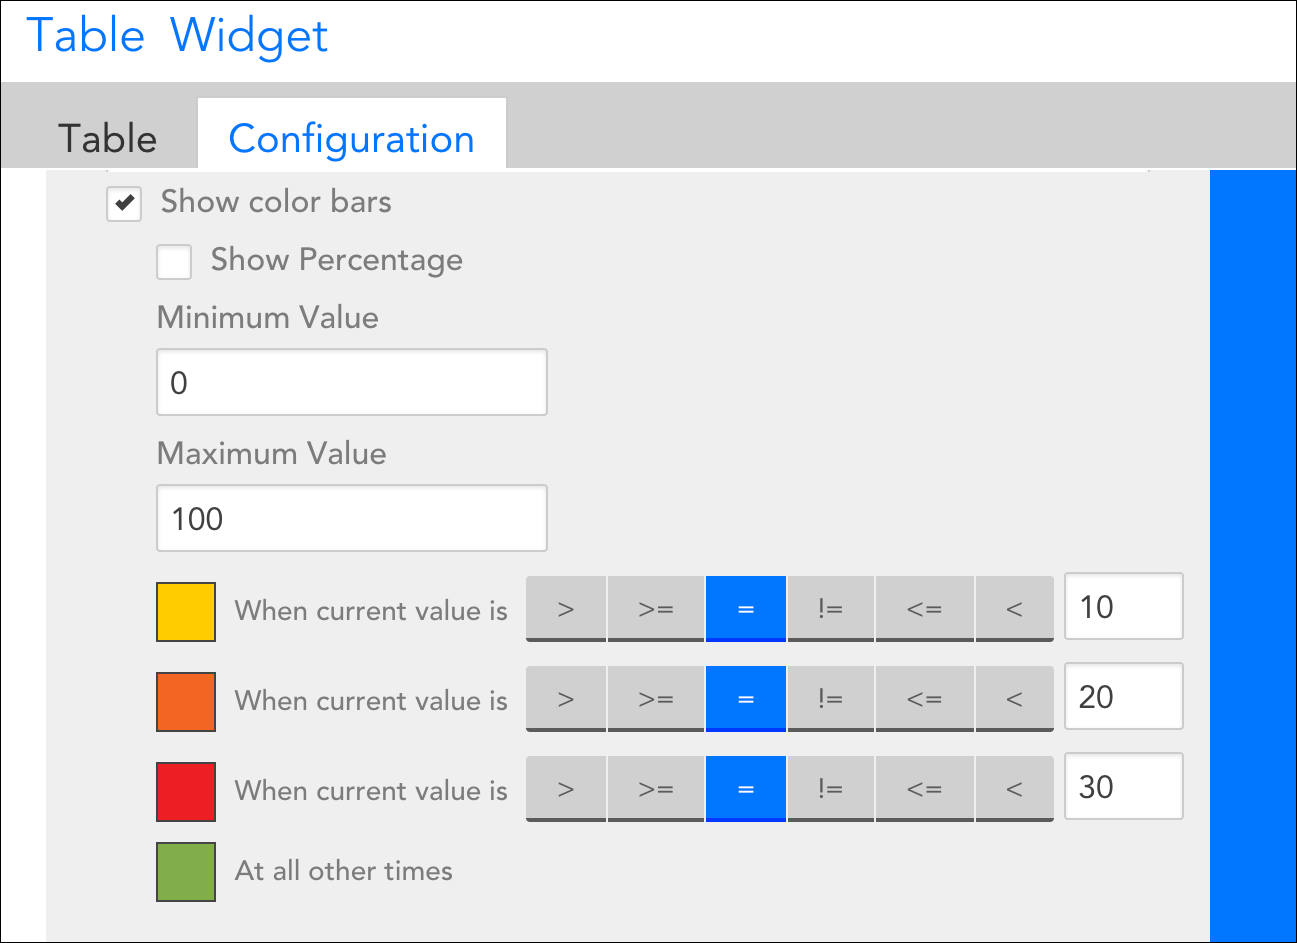
- Table widget. Range fields for non-percentage values are now enabled and colored relatively, based on previously defined colors.
- Alert List widget. If an Alert List widget cannot render due to the use of too many filters in its configurations, users are now notified with the following descriptive error message: “Too many predicates supplied to filter query. Try simplifying your filter.” Previously, “unknown error” was returned.
EventSources
- Multi-paged table editing. Fixed an issue with the EventSource definition editor (available under Settings | LogicModules | EventSources ) where, if the list of Collector attributes was long enough to become multi-paged, editing the nth item on one page would cause the nth item on another page to be unintentionally edited.
LM Cloud
- AWS updates:
- Tagging support for AWS Glue and AWS Kinesis Firehose. Updated discovery filter tagging support in LogicMonitor to include AWS Glue and AWS Kinesis Firehose. This allows you to use tags to filter instances of the services in both the included instances and grouping/monitoring capabilities.
- AWS discovery filter tagging. Updated the LogicMonitor UI to properly reflect the AWS services that allow and do not allow discovery filtering based on AWS tagging. The UI listing had become out of sync.
- GCP updates:
- Device naming. There was an error in some GCP services that occurred when GCP scanning was done. Specifically, some instances received invalid device names that prevented them from being updatable. This has been fixed.
- Microsoft Azure updates:
- Learned routes available for Azure Virtual Network Gateways. A new property, named azure.learnedRoutes, is now discovered for Azure Virtual Network Gateways. This property shows the gateway’s learned routes.
- Peered connections available for Azure Express Route Circuit Peerings. Added peered connection names and IDs as properties, named auto.properties.peeredConnectionsName and auto.properties.peeredConnectionsIds respectively, for Azure Express Route Circuit Peerings.
- Azure subscription name. Added Azure subscription name as a property, named system.azure.subscriptioname, for instances. This is a more intuitive property than subscription ID. You can filter or group instances by this property.
LM Exchange
- Technology provider logos. The Public Repository tab now displays technology provider logos, when available. Logos are displayed in both the grid and list views.
- Results Per Page setting. All three areas of the LM Exchange interface (Installed Modules, My Repository, and Public Repository) now feature a Results Per Page setting that allows you to change the default number of results from 25 to 50 or 100, depending on the interface. Updates to this setting persist on a per-interface, per-user basis.
- Safe LogicModule Merge (SLM). Fixed an issue that was causing SLM to incorrectly identify differences for datapoints whose names differed only in capitalization.
- Find Locator filter. Fixed issue where attempting to find an invalid LM Locator code using the Find Locator filter would lead to an endless spinning cursor.
- Test Active Discovery. Testing of the Active Discovery process from a DataSource definition, as initiated by the Test Active Discovery button, was failing with a vague error message. This has now been fixed and Active Discovery testing is working as expected in LM Exchange.
LM Intelligence
- Improved labeling on anomaly detection graph. The Show Alert Threshold option that is available when viewing the anomaly detection version of a graph now only shows effective thresholds. Previously, inherited thresholds were also displayed, which caused confusion and made it difficult to compare the expected range with the active (effective) threshold.
NetFlow
- New IP version filter. Enhanced NetFlow filtering UI to support future functionality.
- Improved handling of negative and rollover values. We have enhanced the platform backend to better log and filter out rollover and negative values sent from NetFlow devices.
- Disabled the storage of local GCC configuration. Previously, the GCC client saved GNU Compiler Collection (GCC) contents to a local file on the server for NetFlow monitoring. This storage process has been deemed unnecessary (and has been disabled) as GCC data is always available from the library.
Reports
- Interface Bandwidth report. Previously, not all instances were being pulled into this report for evaluation. This has been fixed.
- Resource Metric Trends report. A Scale by units of 1024 checkbox has been added to this report’s configurations, allowing you to more accurately evaluate instance disk storage on a scale of 1024 instead of the default unit scale of 1000.
REST API
- Fixed filter operations for properties collection. The filter condition (specifically not equal to) now applies correctly on all property values and not any one of the values as it was previously.
Security
- Miscellaneous security fixes and improvements. Various security fixes and improvements are being released with this version.
Topology Mapping
- Bulk mapping. When creating or editing topology maps from the Mapping page, you can now add multiple vertices (resources) to a map at once. Previously, resources could only be added individually. This new functionality supports (1) bulk adding of multiple (or all) resources in a group and (2) bulk adding of multiple (or all) instances on a resource.
- Improved display of vertex resource details on Topology Map widget. Previously, the resource detail popup dialog would overlap other dashboard elements when opened from an unexpanded Topology Map widget. To prevent this, resource details for a vertex can only be opened when the Topology Map widget is expanded.
New and Updated Monitoring Coverage
Upon your account’s upgrade to v.138, import our new and updated LogicModules from the LogicMonitor public repository to expand and enhance your monitoring coverage.
New Monitoring Coverage
- AWS EventBridge – 1 DataSource
Discovers the Amazon EventBridge serverless event bus and monitors various metrics including invocations, matched events, and triggered and throttled rules.
- Couchbase Server – 4 DataSources, 1 PropertySource
Monitors auto-failover events, bucket performance, node status, and pool performance for Couchbase Server (formerly known as Membase). For setup and monitoring details, see Couchbase Server Monitoring.
- Dell EMC XtremIO – 17 DataSources, 1 PropertySource
LogicMonitor has released a new monitoring suite for Dell EMC XtremIO that simplifies setup, improves code efficiency, and supports scalability.
Note: This new monitoring suite deprecates 17 legacy XtremIO DataSources. For details on migrating to this new suite, see Dell EMC XtremIO Monitoring.
- GCP: Data Analytics Cloud Composer – 1 DataSource
Discovers and monitors StackDriver data for Cloud Composer, including API requests and latency.
- Kemp – 1 SNMP SysOID Map
Contains new SysOID map categories. As highlighted in the Updated Monitoring Coverage section, updates are available for Kemp DataSources that take into account these new SysOID map categories.
- Linux SSH: Control Groups, Control Group Status, Service Status – 3 DataSources
Provides control group/status and systemd service status monitoring via the
systemd-cgtopandsystemctlcommands respectively. For setup and monitoring details for these new DataSources, see Linux (via SSH) Monitoring. - PaloAlto Firewall: Global Performance – 1 DataSource
Deprecates legacy PaloAlto_FW_GlobalCounters DataSource.
Updated Monitoring Coverage
- Cisco FRU Power – 1 DataSource
Updated the operatingStatusAlerteError complex datapoint name to remove typo (there was an extra lowercase “e” in the name).
Important: Upon updating, LogicMonitor will treat this complex datapoint as a brand new datapoint and all historical data previously collected for it will be lost. You can avoid this data loss by changing the complex datapoint’s name to the new name (operatingStatusAlertError) before importing this updated DataSource. Be sure to exactly match the new name when renaming, including capitalizations.
- Cisco Meraki – 1 PropertySources
Updated to additionally assign a value of “NoPing” to the system.categories property for identified Meraki devices.
- Dell SC DiskFolder Space – 1 DataSource
Added a discovery filter to remove .1 OID results for which Dell returns 0s in order to prevent false alerting.
- Fortinet – 1 ConfigSource
Added a compatibility check for security acceptance banner messages to the Fortinet_FortiOS ConfigSource
- Host Status – 1 DataSource
Updated the appliesTo script to ignore devices which do not respond to Ping.
- HP Product Info – 1 PropertySource
Updated the HP_Product_Info PropertySource to avoid reporting noise on non-HP servers.
- Kemp (Load Master): Global Stats, HA Master, HA Secondary, SSL Expiration, Unnamed Virtual Servers, Virtual Servers – 6 DataSources
Update appliesTo script to work with new SysOID map system category; cleaned up graphs; added various missing datapoint descriptions.
Note: As highlighted in the New Monitoring Coverage section, a new SNMP SysOID Map has been made available for import.
- Kubernetes Pod – 1 DataSource
Updated the memory_usage_percent datapoint to account for no limits.
- Linux SSH: Block Device Performance, CPU Cores, CPU/Memory, Filesystems, Network Interfaces, Network TCP/UDP, Uptime – 7 DataSources
Updated the Technical Notes field with a link to the support article.
- Microsoft Azure Backup Job Status – 1 DataSource
Updated the metric type for the Status datapoint; updated grouping method to support grouping by the auto.properties.entityfriendlyname property rather than the GUIDs provided by Azure.
- Microsoft Azure Replication Job – 1 DataSource
Updated grouping method to support grouping by the auto.properties.entityfriendlyname property rather than the GUIDs provided by Azure.
- Microsoft SQL Server: Databases, System Jobs – 2 DataSources
Added null safe navigation to the Microsoft_SQLServer_Databases DataSource; added code to suppress alerting when a job is disabled to the Microsoft_SQLServer_SystemJobs DataSource.
- NetApp Cluster Aggregate – 1 DataSource
Removed blank line from Active Discovery script causing script failure; performed minor script cleanup and reformatting.
- Netflow Device Heartbeat – 1 DataSource
Updated the idleInterval datapoint’s CDP expression calculation to ignore NetFlow alerts on devices that have either never had NetFlow data or have disabled NetFlow.
- NetSNMP Memory Usage – 1 DataSource
Update the Technical Notes field to mention a known bug for EL7-based systems running EL7 net-SNMP 5.7.2.
- OpenMetrics – All (2) DataSources
Added new parsing and null exception handling.
- Palo Alto Firewall: IPSec Tunnel Stats – 1 DataSource
Fixed issue where script was not properly configured for batchscript, which resulted in No Data; fixed alert threshold for the TunnelState datapoint.
- RabbitMQ Node Performance – 1 DataSource
Additional exception handling on memEts datapoint.
- Servers – AppliesTo Function
Improved the script of this built-in appliesTo function for readability, ease of use, and extensibility. These changes will not impact device association.
- VMware ESXi: Datastore Performance, Host Performance – 2 DataSources
Updated alert trigger intervals for several datapoints to reduce alert noise.
- VMware vCenter: Host Performance, Status, addERI_ESXi – 2 DataSources, 1 PropertySource
Moved storage ERI block into Cisco UCS conditional.
- (Topology Mapping) PropertySources – 5 PropertySources
Updated the addERI_Cisco_EIGRP PropertySource to allow for multiple Cisco EIGRP ERI.
Miscellaneous updates to the following PropertySources: addERI_Arista, addERI_Cisco, addERI_Device, and addERI_Juniper.
- (Topology Mapping) TopologySources – 2 TopologySources
Added multi-threading support to the VMware_vCenter_Topology TopologySource; updated to ensure that ESX hosts managed by the vCenter but not in clusters are captured.
Updated the Cisco_HSRP_L2_HA TopologySource to allow for multiple standby HSRP routers.
Looking Ahead
Datapoints
- Elimination of
percent()function use in complex datapoints. In an upcoming release, LogicMonitor intends to add validation for the purpose of preventing the use of thepercent()function within complex datapoint expressions. This function is intended to produce a percentile value, but requires data for multiple timestamps to do this. As such, it only works properly in virtual datapoints and its use within complex datapoints introduces ambiguity. As part of this initiative, we will also remove any existing complex datapoints that reference this method to ensure continuity in existing DataSource functionality.Note: If you are using this function in the snmp64_If- DataSource, we recommend updating to the latest SNMP_Network_Interfaces DataSource (released in v.136), which uses Groovy to automatically handle this logic outside of complex datapoints.
Website Monitoring
- Originating IP address updates for SiteMonitor. Beginning with v.137 (and ongoing), LogicMonitor is updating the originating IP addresses for our SiteMonitor service, which consists of external testing locations used for Web Checks and Ping Checks. All potential IP addresses are listed in LogicMonitor’s External Testing Locations. Please ensure that your network’s firewall(s) permits access to all IP addresses on this list in order to maintain continued service.