v.141 Release: Slack Integration and NBAR2
Last updated on 14 September, 2022
v.141 Highlights:
- Feature Highlights: Slack alert integration and NBAR2 support
- Other Platform Enhancements: Additional usage summary accounts on the Account Information page, new Windows Event Log EventSource configuration, and more
- New and Updated Monitoring: AWS, Oracle, Remote Desktop Gateway, Viptela, and more
- Entering Beta: New UI for the Alerts page
Feature Highlight: Enhanced Alert Integration for Slack
Over the past few months, LogicMonitor has been beta testing an enhanced alert integration for Slack that leverages a brand new LogicMonitor app for Slack. On September 24, this improved integration is slated for general availability (subject to change due to the dynamic nature of the Slack app review process).
This new out-of-the-box alert integration between LogicMonitor and Slack is bi-directional, supporting the ability to:
- Route LogicMonitor alert notifications to Slack
- View and acknowledge alerts from Slack
- Put the resource triggering the alert into scheduled downtime (SDT) from Slack
- Open alerts in LogicMonitor from Slack
- Configure the conditions (alert rule, escalation chain, recipient group) under which alerts are routed to Slack—from Slack or LogicMonitor
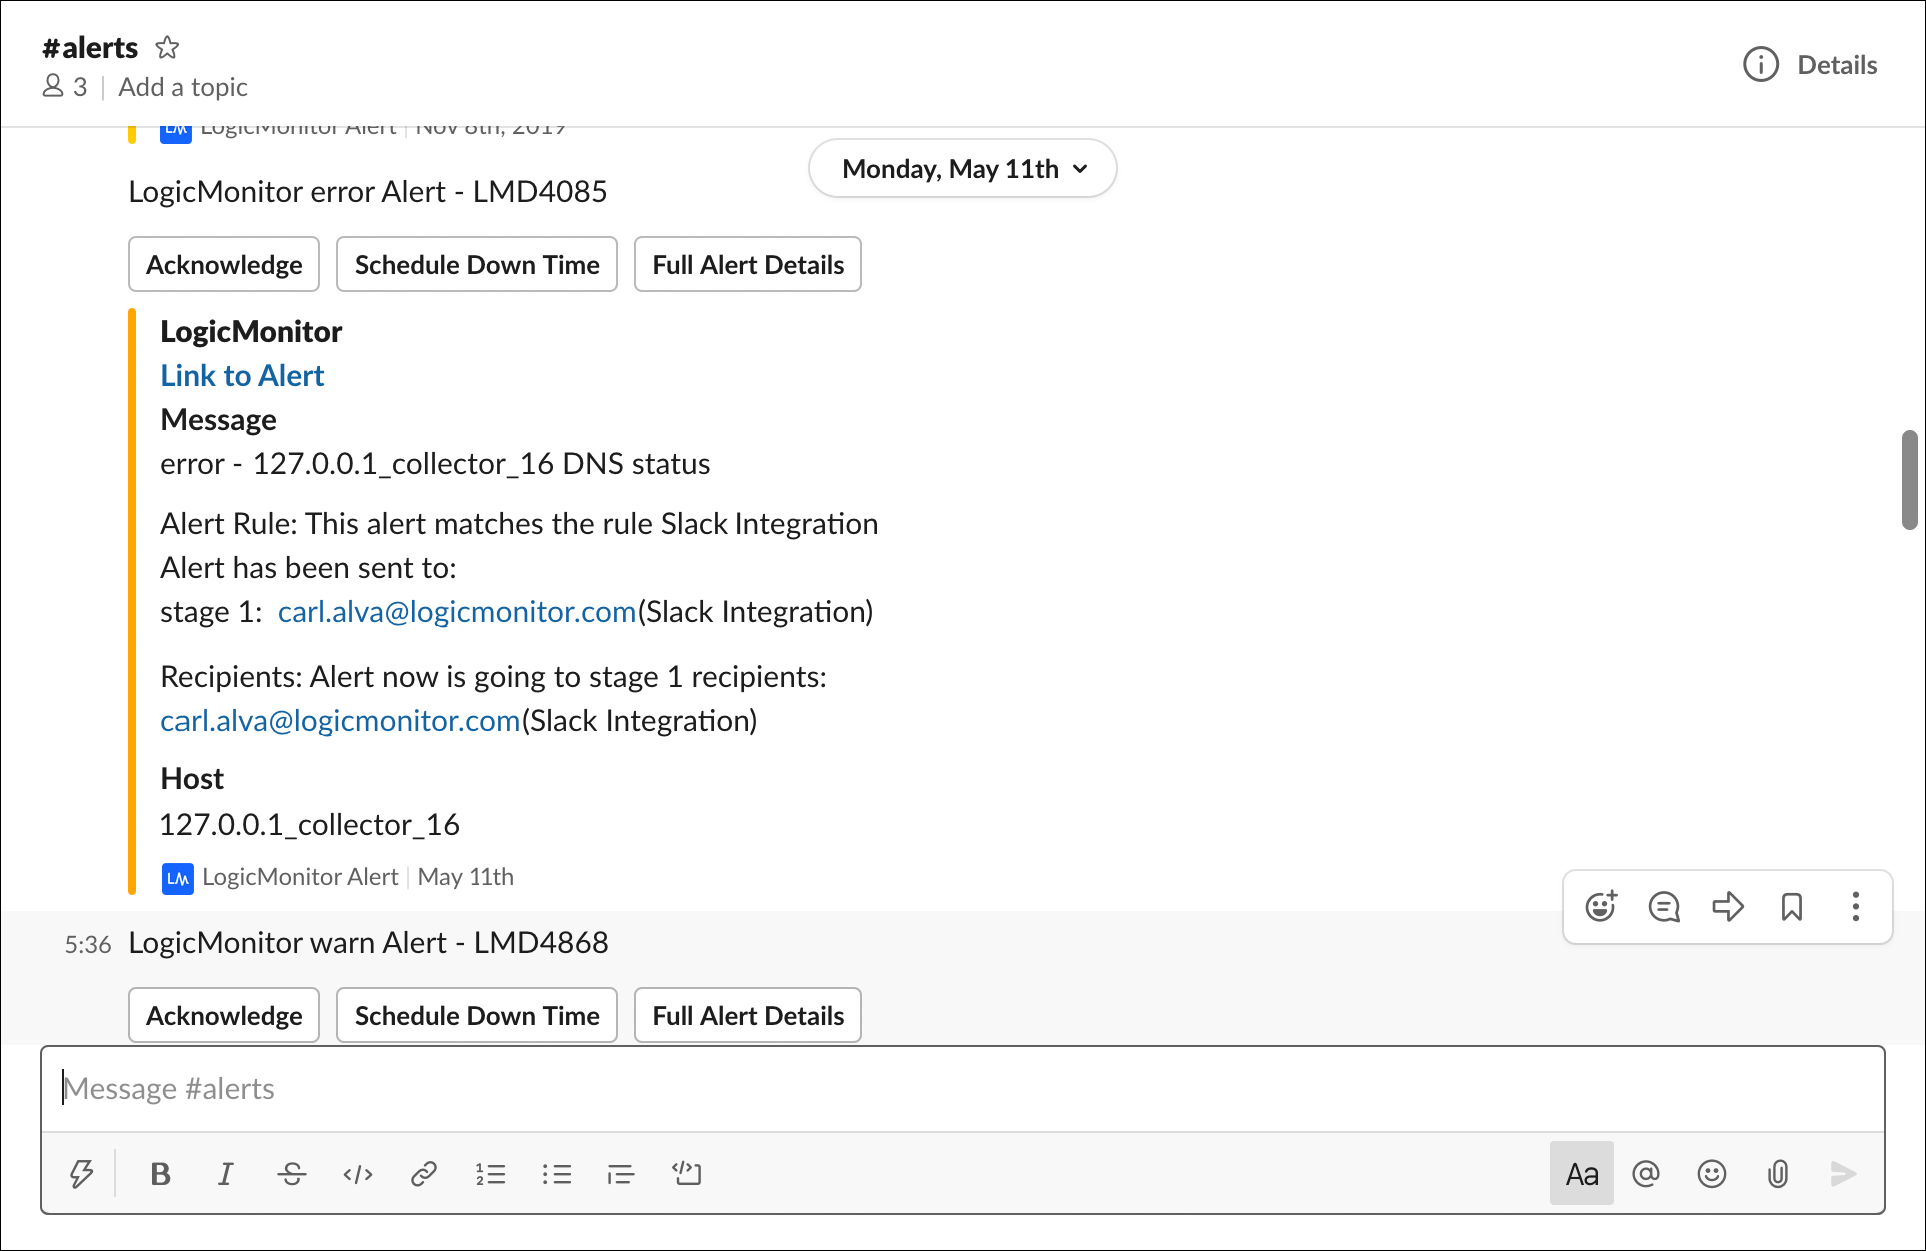
To learn more about the new Slack integration, see Slack Integration.
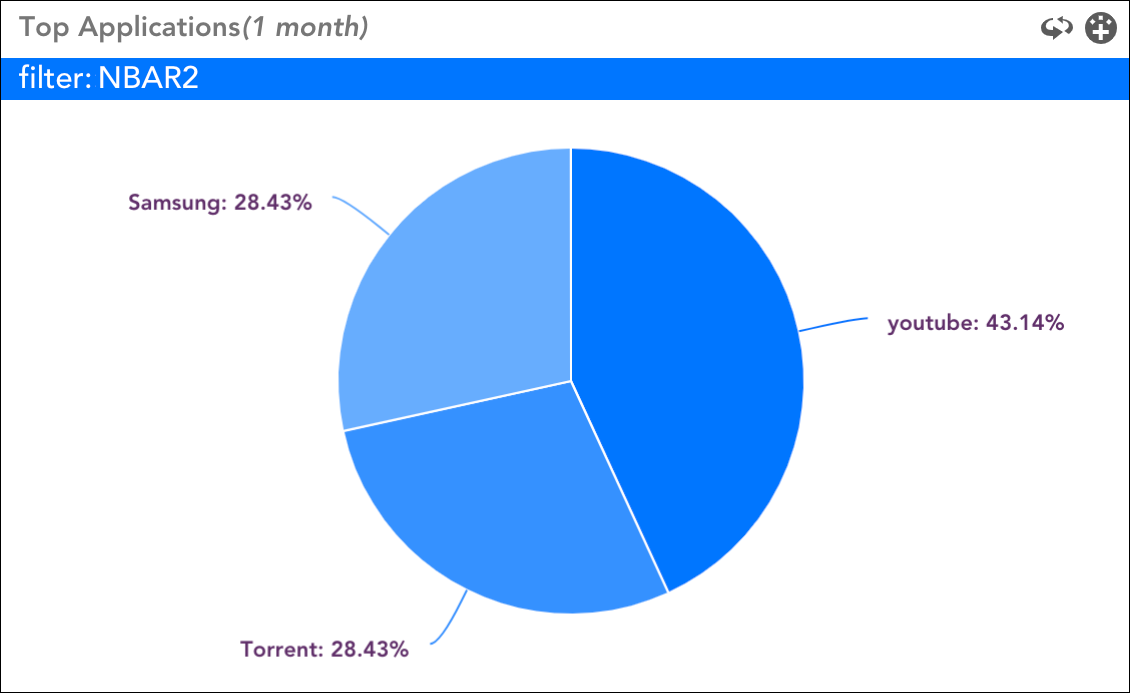
Feature Highlight: NBAR2 Support
LogicMonitor’s network traffic monitoring capabilities now include support for the NBAR2 protocol. The addition of NBAR2 nicely rounds out LogicMonitor’s suite of supported network traffic protocols which also includes NetFlow, JFLOW, sFlow, and IPFIX.
NBAR2 is the next generation of Cisco’s NBAR (network based application recognition) protocol, which recognizes and classifies network traffic by protocol or application. LogicMonitor’s support of NBAR2 allows you to:
- Collect and store NBAR2 data for a monitored device
- Filter network traffic data using NBAR2 classifications
- Visualize NBAR2 data in dedicated dashboard widgets
Although network traffic monitoring capabilities are available in all LogicMonitor portals, the ability to collect NBAR2 data will be available to users of LogicMonitor Enterprise only. Users of LogicMonitor Professional will have trial access to the feature through October 5 2020.
NBAR2 functionality requires Collector version 29.101 or greater. For more information on LogicMonitor’s network traffic monitoring capabilities, see Network Traffic Monitoring.
Other Platform Enhancements
Alerting
- (FIX) Errant alerts in ABCG context. Fixed an issue in which errant host status alerts were triggered when devices were moved from one Collector to another within an Auto-Balanced Collector Group (ABCG).
- (FIX) ##AGENT_DESCRIPTION## token. Previously, the ##AGENT_DESCRIPTION## token, when used inside the ##MESSAGE## token within the context of custom HTTP delivery integrations, was not resolving. This has been fixed.
Dashboards
- (FIX) Alert Detail widget. Previously, when viewing an Alert Detail widget shared via an embedded URL, alert details were not displaying in the detail window. This has been fixed.
- (FIX) Adding graphs to dashboards from the Alerts page. Previously, attempting to add a graph to a dashboard from the Alerts page (specifically the Graphs tab of an individual alert) was failing with a blank page. This has been fixed
EventSources
- Overriding duplicate suppression. Windows Event Log EventSources deduplicate messages with identical EventIDs, even if the messages between them differ. This release includes a new option titled Suppress duplicate EventIDs even when messages differs on the EventSource editor that allows you to override this behavior. Checked by default, you can uncheck this new option to indicate that you do not want LogicMonitor to suppress Windows Event Log events that have the same EventID, but different messages.
LM Container
- Tiller reference removed in install instructions. The reference to Tiller, a companion server component for Helm, has been removed from the Add Kubernetes Cluster UI wizard in contexts where Helm 3 is required for installation (Kubernetes version 1.14+) because Tiller is deprecated in Helm 3.
LM Cloud
- AWS updates:
- (FIX) AWS RDS monitoring. Previously, if a status of “Storage Optimization” was in place for an AWS Relational Database Service (RDS) instance, data collection for that instance would stop for the duration of the storage optimization phase. This has been fixed.
- Microsoft Azure updates:
- (FIX) Azure subscription reinstatement. Previously, Azure resources belonging to a subscription that was at one point removed (i.e. unselected from the Permissions tab of the top-level account settings) were remaining marked as dead even when the subscription was reinstated. This has been fixed. If you previously encountered this issue, open the Manage dialog, reselect the subscription, and click Save to “reset” the resources to the appropriate status.
- Subscription display. More than 50 subscriptions (a default API limit) are now permitted to display if available on an Azure integration.
LM Intelligence
- (FIX) Dynamic threshold resets. Saving static thresholds previously reset dynamic threshold edits, if any were made without saving the entire threshold editing window. This has been fixed.
- (FIX) Anomaly detection graph display at instance group level. Anomaly detection graphs were incorrectly displaying at the instance group level when viewing/setting dynamic thresholds from the Alert Tuning page. These graphs have been removed at the instance group level and now only display (as intended) at the individual instance level.
Network Traffic Monitoring
- New conversation filter. The Traffic tab features a new filter named conversation that allows you to filter traffic based on travel between two specified endpoints, allowing for more granular and intuitive filtering of network traffic flows.
Topology Mapping
- Expanded instance names when adding vertices to topology maps. When adding resources in bulk to a topology map, the Instances field now displays expanded instance names that include their parent resources. This provides improved identification in cases where instances share the same name, but belong to different resources.
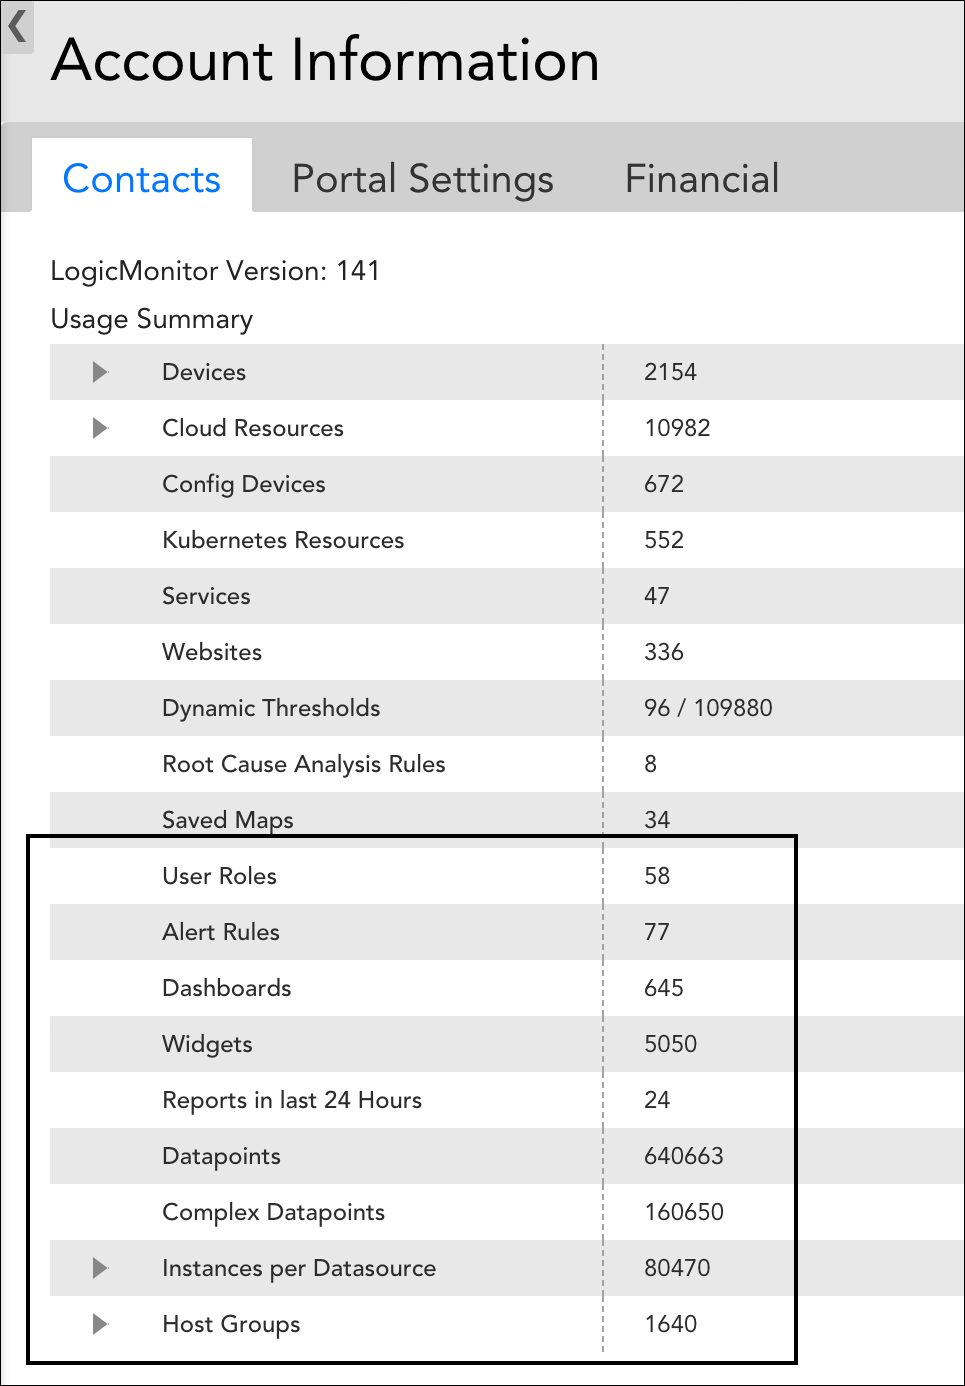
User Interface (UI)
- Additional usage summary counts. The Account Information page now displays a significantly expanded number of usage count summaries. Usage counts for user roles, alert rules, dashboards, widgets, datapoints, instances (total and per-DataSource), and resource groups are now included to help you better track LogicMonitor activity.
- Dynamic thresholds limit display. In addition to new usage counts, the Account Information page now also displays the maximum number of dynamic thresholds allowed for your account. Previously, only the number of dynamic thresholds currently in use displayed here.
- (FIX) Light blue gray color option removal. A new “Light blue gray” color option was inadvertently introduced in a recent platform version. Because this color was not explicitly supported by DataSource graphs, graphs configured to use this color were failing to load. To resolve this issue, the “Light blue gray” color option has been removed from graph configurations.
- (FIX) Attribute deletion for EventSources. Previously, if an EventSource (specifically EventSources that monitor log files) had multiple Collector attributes configured, only the most recent attribute could be successfully deleted from the UI. This has been fixed.
New, Updated, and Deprecated LogicModules
Upon your account’s upgrade to v.141, import our new and updated LogicModules from the LogicMonitor public repository to expand and enhance your monitoring coverage.
New LogicModules
- AWS Elemental MediaPackage – 1 DataSource
A new DataSource named AWS_Elemental_MediaPackage_VOD has been added to monitor throughput, request count, and response time metrics for MediaPackage VOD packages.
- AWS Trusted Advisor – 2 EventSources
Alerts on AWS Trusted Advisor checks.
- Linux SSH – 1 DataSource
A new DataSource named Linux_SSH_TCPUDP has been released to replace Linux_SSH_NetworkTCPUDP. See Deprecated LogicModules for details.
- Oracle – 1 DataSource
Added a new DataSource named Oracle_Database_WinServices to the Oracle monitoring suite that monitors the status of the Windows Services associated with an Oracle database.
- QNAP – 1 DataSource
A new DataSource named QNAP_Volumes has been released to replace QNAP Volumes. See Deprecated LogicModules for details.
- Remote Desktop Gateway – 1 DataSource, 1 PropertySource
The RD_Gateway_Connections DataSource and addCategory_RD_Gateway PropertySource work together to track the number of users currently connected via a Remote Desktop Gateway server.
Note: The release of these LogicModules is part of LogicMonitor’s initiative to enhance monitoring of the various remote work from home technologies that have become critical during this time. See Quick Reference for Remote Tools Monitoring for a list of remote tools monitoring capabilities our customers have found most helpful over the past few months.)
- Viptela – 3 DataSources
Expanded Viptela monitoring to gather metrics for tunnel status and color; SFP presence; and interface metrics including utilization, throughput and errors.
- Cisco Meraki – 4 DataSources, 1 PropertySource, 1 TopologySource
Updated several LogicModules in the Cisco Meraki monitoring suite to address merging issues between Meraki cloud and standard networking topologies: Cisco_Meraki_AccessPoints, Cisco_Meraki_Gateways, Cisco_Meraki_SecurityAppliances, Cisco_Meraki_Switches, and Meraki_Cloud_Topology (TopologySource).
The addERI_Device PropertySource, although not directly a member of the Cisco Meraki suite, was also updated for the same purpose.
- CiscoSLA_ICMPEcho- – 1 DataSource
Corrected the OID being used by the LatestRttStatus datapoint.
- CommVault – 3 DataSources
The collection scripts for the following DataSources were not collecting data for discovered instances: CommVault_Job_Subclients, CommVault_Job_VMwareSubclients, and CommVault_Job_VMwareSubclientVMs. This has been fixed.
Note: For the CommVault_Job_VMwareSubclients DataSource, new instances will be generated, effectively breaking history with its previous set of instances; however, since data was never collected for the previous instances, this should be of no consequence to your operations.
- Liebert_Condition_Events – 1 EventSource
Fixed incorrect time offset calculation when reporting events; shortened script; converted base64/gz-encoded string back to plain text.
- Linux (via SSH) – 2 DataSources
Updated the Linux_SSH_CGroups and Linux_SSH_ServiceStatus DataSources, both of which install with Active Discovery disabled in order to prevent the production of many instances, to improve the process (and documentation) for instance discovery.
- Microsoft_Exchange_MailboxOverview_2016+ – 1 DataSource
Fixed incorrectly ordered status codes in the DATABASESTATE datapoint’s description.
- Microsoft SQL Server – 3 DataSources
Invalid characters in instance names are now replaced with underscores to resolve collection/Active Discovery issues for the following DataSources: Microsoft_SQLServer_Databases, Microsoft_SQLServer_GlobalPerformance, and Microsoft_SQLServer_SystemJobs.
- MySQL – 1 PropertySource
Updated the addCategory_MySQL PropertySource script to use Expect instead of sockets for improved discovery reliability.
- OSPF – 1 PropertySource, 1 TopologySource
Updated the addERI_OSPF PropertySource and OSPF_Topology TopologySource to fix ERI mismatch and improve flexibility of area ID discovery during topology map generation.
- PaloAlto_FW_SystemResources – 1 DataSource
Added a new available_mem datapoint for version 9 CLI of Palo Alto firewalls; with this change, the swap_cached datapoint is no longer relevant and will report “NA”.
- Pure Storage – 9 DataSources, 3 PropertySources, 1 TopologySource
Updated all LogicModules in the Pure Storage monitoring suite that collect data via API query (the majority of LogicModules) to default to accessing the highest available version of the 1.x API due to stability issues with the 2.x API.
- TACACS_SyntheticTransaction – 1 DataSource
Removed additional decoration information from the sent request.
- VMware_vCenter_VMPerformance – 1 DataSource
Corrected the description in place for the DiskWriteKbytesPerSec datapoint; performed minor cleanup for other datapoint descriptions.
- Windows SNMP – 2 DataSources
Updated technical notes for Windows_SNMP_Memory and Windows_SNMP_Volumes DataSources to reference deprecation of SNMP on Windows. (These DataSources are currently operational if SNMP is enabled, but will be deprecated once Microsoft officially drops SNMP support).
- Windows System Event Log – 1 EventSource
The ApplesTo statement was accidentally reverted in a previously published version of this EventSource. This has been corrected and the EventSource no longer applies to Windows clusters.
- WinLogicalDrivePerformance- – 1 DataSource
Removed the alert threshold from the SplitIOPercent datapoint; added missing datapoint descriptions and graphs across all datapoints.
- Topology Mapping – 1 PropertySource, 1 TopologySource
Made discovery and deny listing improvements to the addERI_Device PropertySource and Networking_L2_snmpSwitch TopologySource to enhance basic networking topology operations.
- Increased data density
- Faster loading times
- More advanced filtering options
Updated LogicModules
Deprecated LogicModules
LogicMonitor deprecates LogicModules for a variety of reasons. Most common, it is because we have published a replacement LogicModule that provides superior access to the monitored technology. For example, the replacement supports more versions of the technology or provides improved scalability.
However, there are times when a LogicModule is deprecated with no replacement. For example, a LogicModule may not be replaced if the technology becomes defunct or security issues beyond LogicMonitor’s control arise).
Note: When importing a replacement LogicModule, you will not experience any data loss due to the name variation that LogicMonitor expressly adds. However, you will potentially collect duplicate data and receive duplicate alerts for as long as both LogicModules are active. For this reason, we recommend that you disable the deprecated LogicModule after you have imported its replacement and verified that it is working as expected.
| LogicModule Name/Type | Replaced By | Reason | End of Support Date |
| Linux_SSH_CGroupStatus
(DataSource) |
Linux_SSH_ServiceStatus | Did not provide accurate/useful data and can be deleted; the existing Linux_SSH_ServiceStatus DataSource has been retooled in v.141 to perform same function. | 2020-09-18 |
| Linux_SSH_NetworkTCPUDP
(DataSource) |
Linux_SSH_TCPUDP | The replacement DataSource offers several advantages including (1) the use of the more widely supported nstat (part of iproute2) command and netstat as fallback if nstat is not available and (2) additional monitoring for packet, datagram and error related metrics | 2020-09-18 |
| QNAP Volumes
(DataSource) |
QNAP_Volumes | Changed the collection method from standard SNMP to scripted SNMP to properly handle the units returned for the VolFreeSize and VolTotalSize datapoints. In the now-deprecated version, these datapoint calculations were failing if the returned values were not expressed as terabytes leading to data misrepresentation. | 2020-09-18 |
| Windows_SNMP_Services
(DataSource) |
N/A | Windows SNMP support has been deprecated by Microsoft since Server 2012 R2. As a result, this DaaSource does not collect reliable data for Server 2016 and above. | 2020-12-02 |
Entering Beta: New UI for Alerts Page
LogicMonitor is currently beta testing significant UI enhancements for the Alerts page. The new UI is more intuitive and efficient, featuring:
Any customer with a sandbox portal will be able to test drive these UI enhancements in their sandbox portal, targeted for roll out in mid October (subject to change). To access the new UI, open the Alerts page and add an “s” onto the very end of the URL (transforming “/alert” to “/alerts”).
Feedback on the new UI is welcome and can be submitted right through your portal, as outlined in Accessing Support Resources.