v.143 Release
Last updated on 15 October, 2022
v.143 Highlights:
- Feature Highlights: Alerts Page Refresh and New Profile Menu
- Platform Enhancements: Independent configuration of dynamic threshold suppression and generation capabilities, a significant number of Kubernetes monitoring enhancements, additional usage summary counts, expanded NetFlow support, and more
- New and Updated Monitoring: AWS Elemental MediaConvert, Cohesity, VMware VCSA, VMware VeloCloud, and more LogicModules
Feature Highlights
Feature Highlight: Alerts Page Refresh
LogicMonitor is releasing significant UI enhancements for the Alerts page. The new UI is more intuitive and efficient, featuring:
- Increased data density
- Fewer clicks to accomplish a task
- Faster loading times
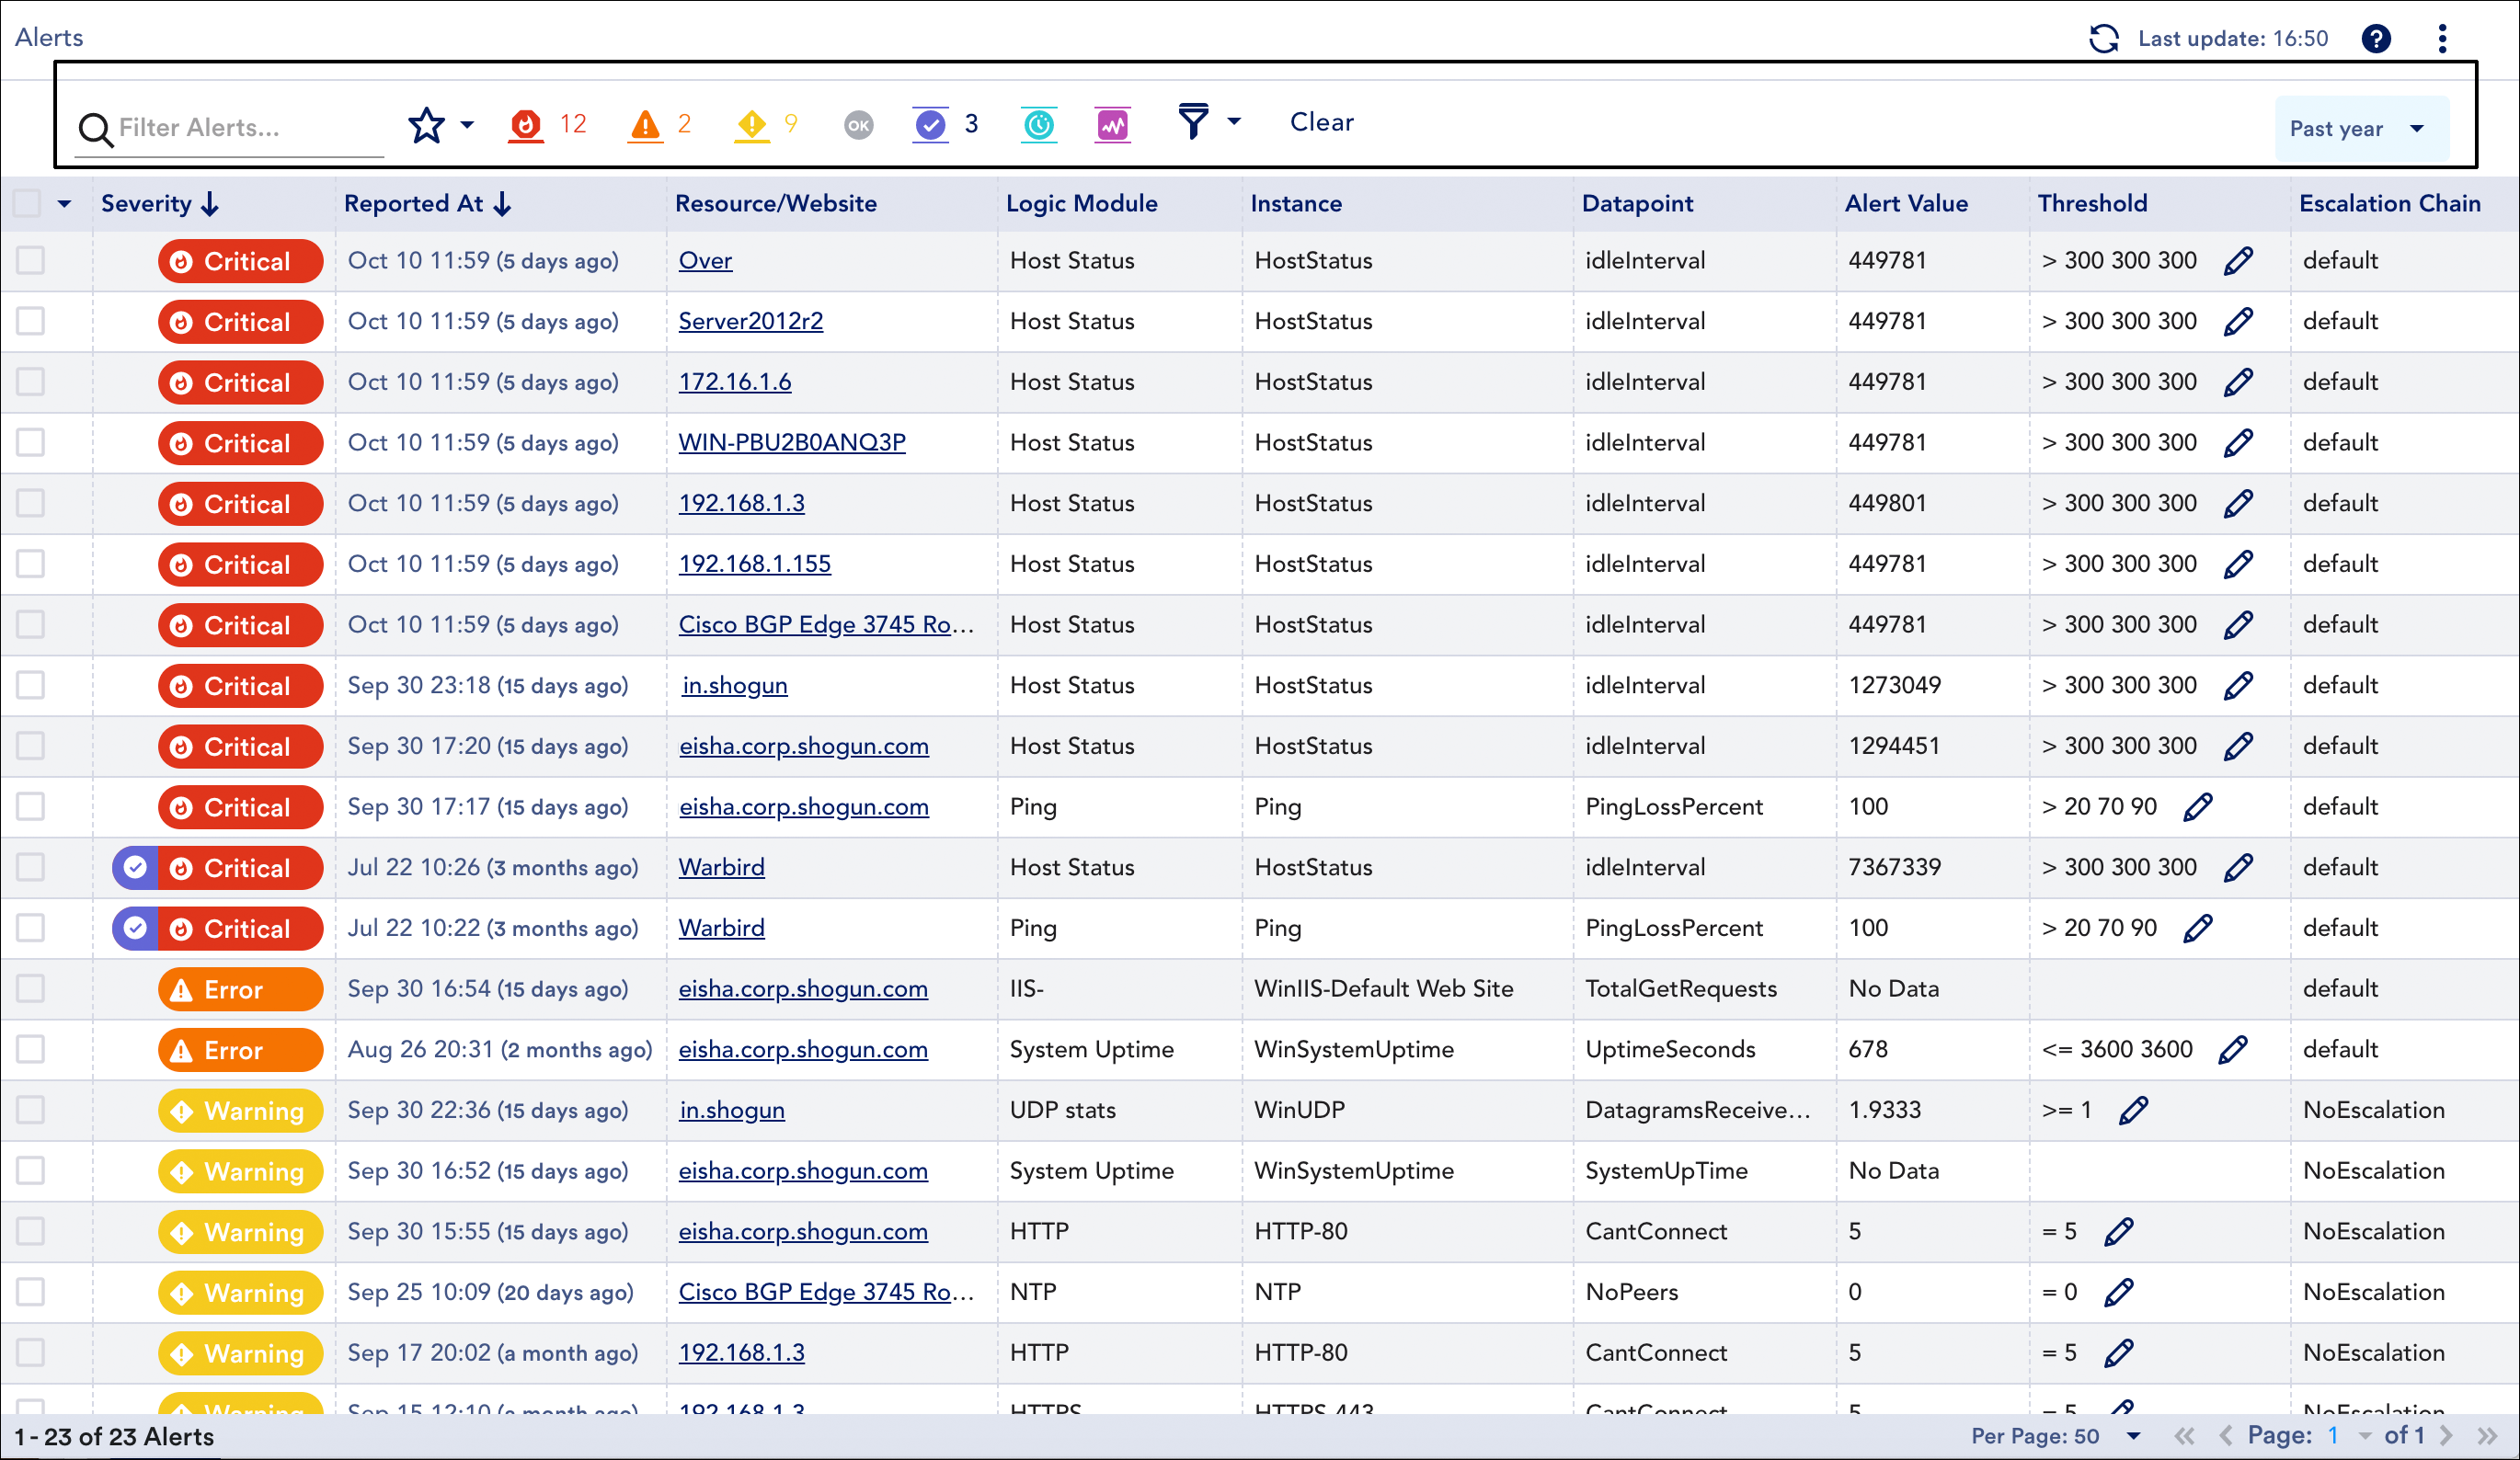
While the capabilities of the new Alerts page UI are largely parallel to those of the previous UI, some new functionality is being introduced, including:
- Bulk SDT action enhancements. You can now put parent devices (or device groups) into SDT from the bulk SDT action.
- Ability to escalate alerts or add notes to alerts as bulk actions. You can now escalate multiple alerts or add a note to multiple alerts at once from the bulk actions menu.
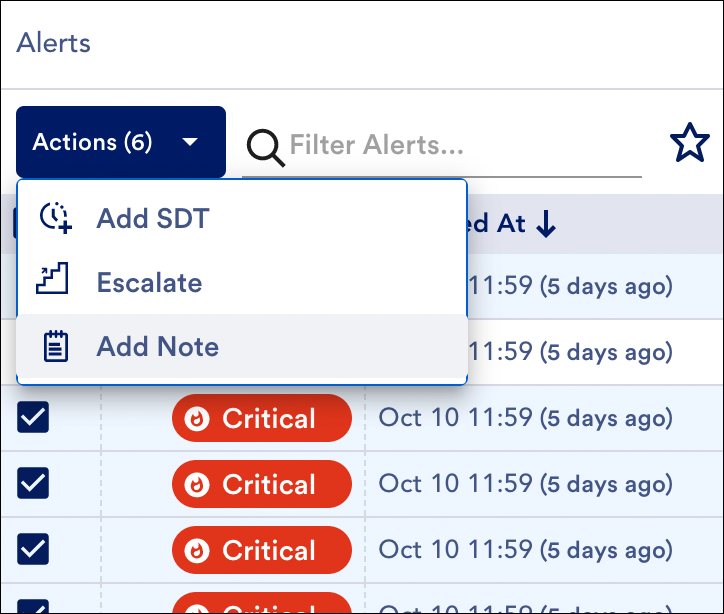
- Inverse alert selection. When selecting multiple alerts for the purpose of performing an action in bulk, the selection dropdown offers the ability to invert current selection, allowing you to select all except those currently selected.
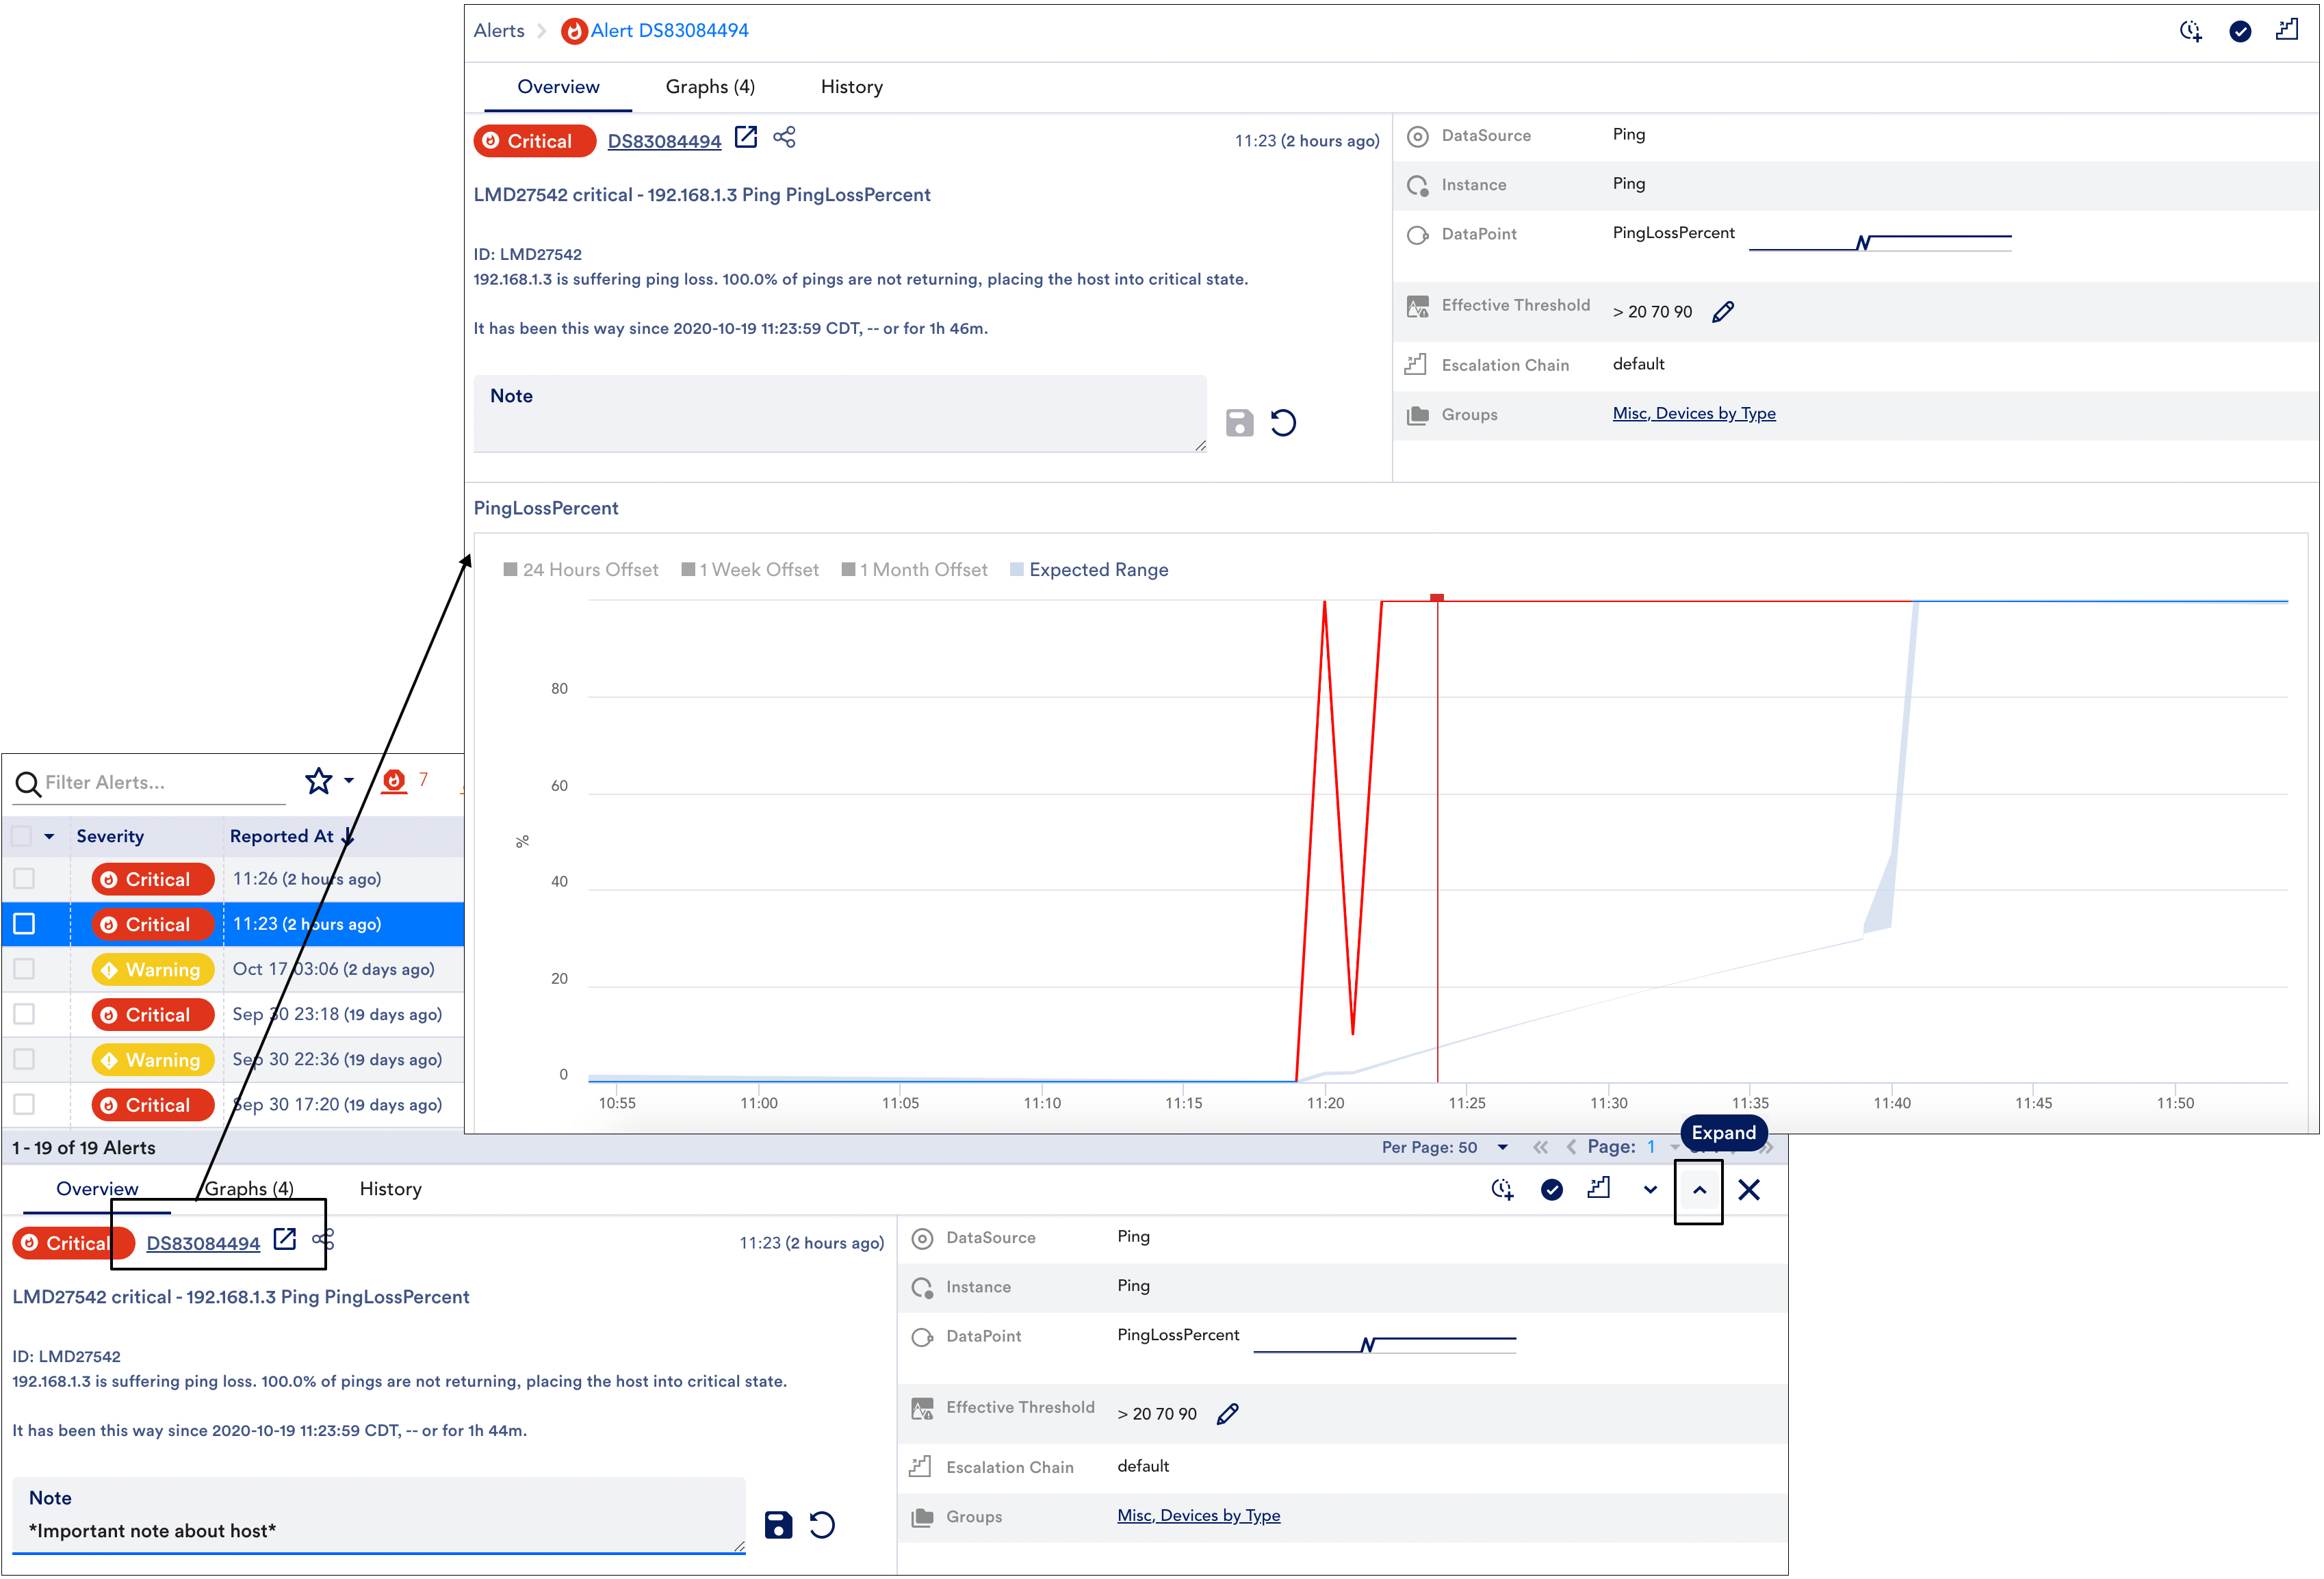
- User-friendly alert detail display. The Overview tab features several new user-friendly display features that make alert detail viewing more efficient and intuitive.

When viewing the details of an alert, the new UI provides an at-a-glance sparkline for the datapoint in alert and brings alert notations front and center. In addition, as highlighted here, it provides options for maximizing the display of alert details, allowing you to “Expand” the alert detail pane upwards to fill more of the Alerts page screen or, for unobstructed viewing, to link to a new page that displays a maximized view of the alert detail pane.
Note: Upon deployment of the new UI, the left-hand Alerts navigation menu will automatically open the new Alerts page. However, you can still access the prior version of the Alerts page by removing the “s” from the very end of the Alerts page URL (transforming “/alerts” to “/alert”). The prior version of the Alerts page will remain available through at least version v.144.
For more information on using the new UI, see Managing Alerts from the Alerts Page.
Feature Highlight: New Profile Menu
The left-hand navigation menu features a new Profile menu. Only available when viewing areas of the product with version 4.x of the UI (currently the Alerts and Exchange pages), this menu is unique per user, allowing you to manage your user account, access support/training, configure various appearance settings, and log out.
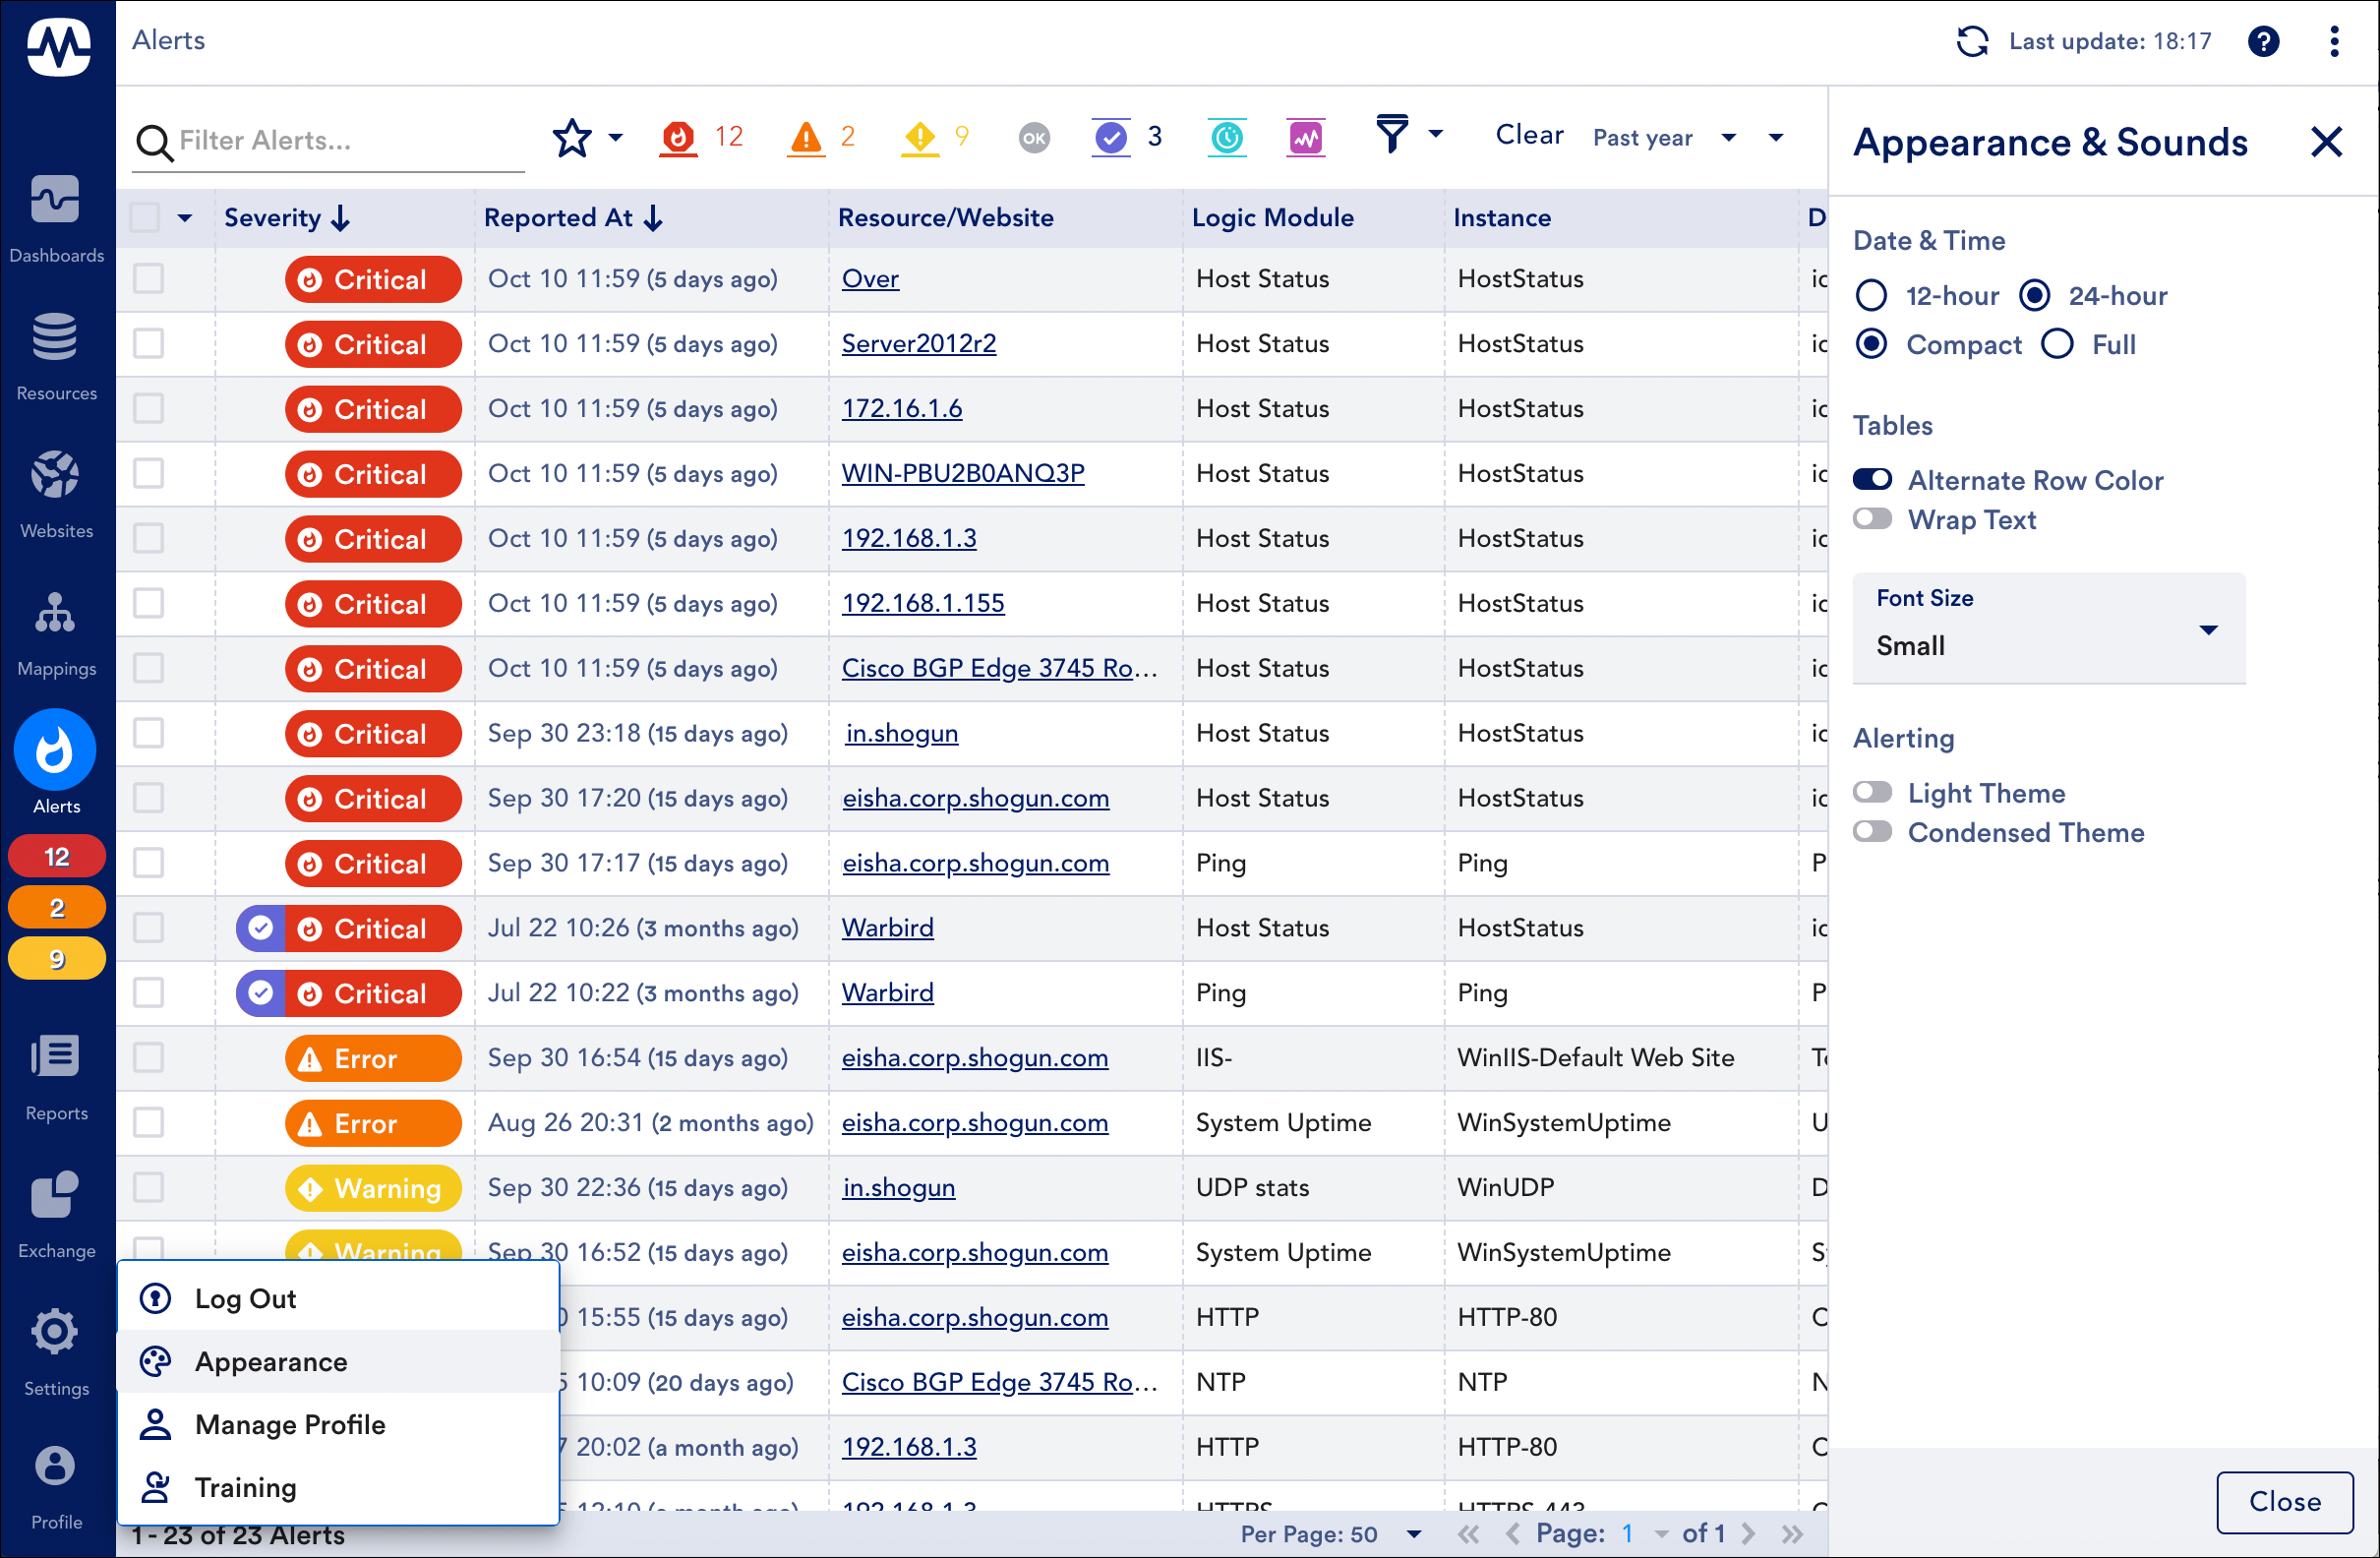
Note: When viewing areas of the product with version 3 of the UI, you can find these options (manage user account, access support/training, log out) in the upper right corner of the platform header.
Platform Enhancements
Alerting
- Alert notification suppression independently configurable from alert generation. Alert notification suppression is now independently configurable from the alert generation capabilities of dynamic thresholds. This means you can have dynamic thresholds that trigger alerts for anomalies, suppress notifications for alerts that correspond to expected performance, or both. This is useful when there are different use cases for suppression and alert generation (for example, a percentage-based metric for which there is a very clear good and bad range may benefit more from suppression than alert generation). For more information on using these capabilities independently or in cooperation, see Enabling Dynamic Thresholds for Datapoints.
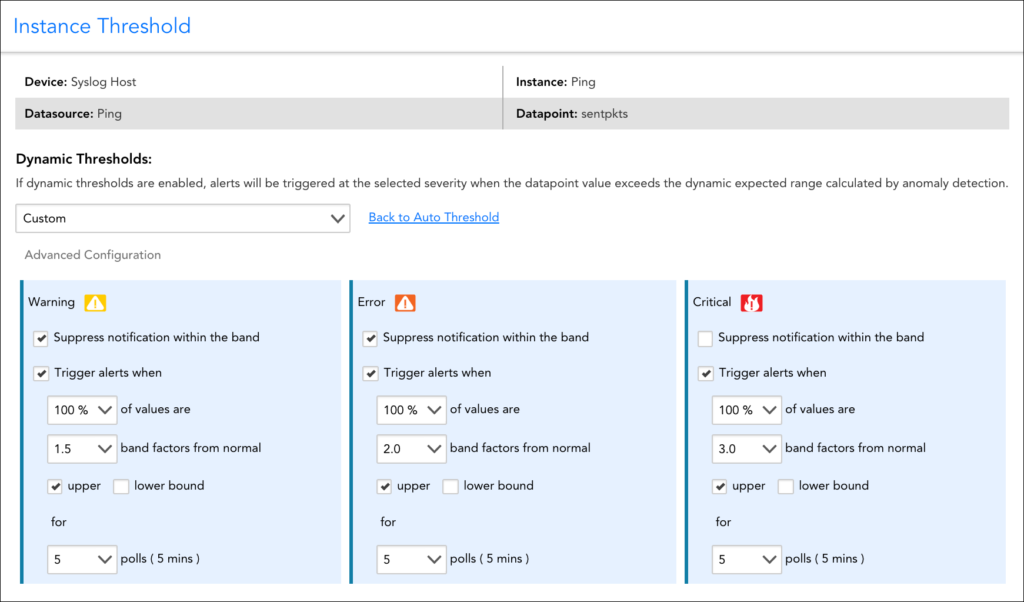
Upon rollout of this enhancement, any existing dynamic threshold configurations will update to having both the “Suppress notification within the band” and “Trigger alerts when” options checked to ensure no changes to expected current behavior.

Alert Integrations
- Improved alert clear behavior around instance deletion. Several enhancements have been made in this area to prevent orphaned tickets in third-party integrations:
- If an alert is cleared and the instance triggering the alert then gets deleted via Active Discovery, the alert will be cleared prior to the instance being deleted.
- If an alert’s severity level is upgraded and, prior to sending notification of upgrade, the instance triggering the alert is deleted via Active Discovery, an alert clear will now be sent for the initial severity level. Previously, this notification was unintentionally suppressed due to alert upgrade.
- If an alert’s severity level is upgraded and, prior to sending notification of upgrade, the upgraded alert is cleared and the instance triggering the alert is then deleted via Active Discovery, an alert clear will now be sent for the initial severity level. Previously, this notification was unintentionally suppressed due to alert upgrade.
- (FIX) ConnectWise alert integration cloning. Resolved an issue that was preventing the cloning of ConnectWise alert integrations without “Escalated” payloads. This has been fixed and the ability to clone a ConnectWise integration is now available regardless of the types of payloads configured for it.
Dashboards
- (FIX) NOC widget. Fixed an issue introduced by an update to the Chrome browser that was displaying hyperlinks in the NOC widget for non-privileged users (users with read only permissions for dashboard). The hyperlinks were leading non-privileged users to invalid URLs. This has been fixed and non-privileged users will no longer see rendered hyperlinks in the NOC widget.
Devices
- (FIX) Device association with DataSources and dynamic groups. Resolved an issue that was preventing DataSources and dynamic groups from applying to a device (despite the device matching the AppliesTo statement of DataSource(s) or dynamic group(s)) after the device’s properties were updated by an ERISource PropertySource. While this issue is resolved and will not occur moving forward, remedial steps must be performed on any impacted devices and/or dynamic groups in order to enable appropriate associations:
- To manually fix missing DataSource associations… Open each device in the Resources page and select Manage | Force DataSource Re-Match.
- To manually fix missing dynamic group associations… This can be accomplished using one of the following two methods:
- Temporarily update AppliesTo statement for dynamic group. Temporarily update the AppliesTo statement for each dynamic group in order to trigger dynamic group evaluation across all devices. It is recommended that you add an OR condition that adds a dummy property to the AppliesTo statement so as not to remove any currently associated devices or associate any new devices. To accomplish this, put the existing statement in parentheses and then append the OR condition. For example:
(<existing AppliesTo statement>) || dummy.property == xyz.After saving the new statement and waiting a few moments, revert the AppliesTo back to its original statement and save once again.
- Create a temporary PropertySource. Create and trigger a PropertySource that sets a dummy property on the devices whose memberships need to be reevaluated. The PropertySource can consist of a script as simple as a one line print statement:
println("auto.triggerdynamicgroups=true"). To trigger immediate evaluation of the PropertySource across your devices, select More | Run PropertySource from the PropertySource definition. Once the dynamic groups are updated, delete the PropertySource.
- Temporarily update AppliesTo statement for dynamic group. Temporarily update the AppliesTo statement for each dynamic group in order to trigger dynamic group evaluation across all devices. It is recommended that you add an OR condition that adds a dummy property to the AppliesTo statement so as not to remove any currently associated devices or associate any new devices. To accomplish this, put the existing statement in parentheses and then append the OR condition. For example:
- Helper text added to Dynamic Group configuration window. The following informational note has been added to the Add Dynamic Group and Update Dynamic Group configuration windows to provide further explanation of which properties the group’s AppliesTo statement evaluates.
“Note: To avoid circular references, the criteria that determines which devices are auto-assigned to a dynamic group (i.e. the AppliesTo script) can only evaluate properties of the host itself, not any inherited properties from those groups of which it is a member.”
- Improved warning message when adding devices to a device group. When adding devices to a device group, if a Collector (or Auto-Balanced Collector Group) other than the one currently assigned to the device is chosen, the following warning now displays in the UI.
“The highlighted devices are not being monitored by their preferred collector/group. To change the preferred collector or to perform failback, go to Collector Settings. In case of a device being monitored by an ABCG, check if the device has been moved to other group.”
Kubernetes Monitoring
- Editable and downloadable YAML configuration files. The Add Kubernetes Cluster wizard now provides editable and downloadable YAML configuration files for the LM Container Argus and Collectorset-Controller deployments. You may find this install process simpler than the previous copy/paste Helm commands (the new process is a one-line install using the Kubernetes cli to apply from the YAML file), and particularly useful when customizing configuration options that weren’t exposed in the UI wizard previously (all options are present in the YAML file).
- Kubernetes and Helm version properties. New properties are automatically added at the cluster (group) level to capture Kubernetes and Helm versions. This information is intended to help provide the LogicMonitor team the information they need in troubleshooting situations.
- Disabling Spinnaker versioning. New Helm chart options have been added to disable Spinnaker versioning. If you use Spinnaker, you may find this useful for avoiding issues with Spinnaker versioning on the config maps/secrets.
- Resource deletion retry. Argus will now retry deleting resources (e.g. pods) in monitoring when the initial delete request fails. This compensates for any issues that may interfere with initial deletion, helping to ensure monitoring stays up to date.
- (FIX) Improved handling of duplicate resource names. Kubernetes resources with the same names in different namespaces of the same cluster were previously not properly added into monitoring. To resolve this issue, namespaces are now appended to resource names in this scenario to ensure unique naming.
- Argus version 4.2.0. In Argus version 4.2.0, which was recently released, pod naming convention changes from <pod name> to <pod name-namespace>. This change was made to accommodate pods with the same names running in different namespaces, but it will result in pods being deleted and re-added under the new naming convention. If you wish to avoid this, you can update your Argus image tag in Helm to 4.1.0 so that you do not get the 4.2.0 release. In a future release we will change this behavior so that pods can simply be renamed without being deleted/re-added.
Network Traffic Flow Monitoring
- Network traffic flow monitoring available for more systems. Adjusted flexibility of mandatory field requirements in traffic flows to allow for network traffic flow monitoring on systems that do not provide both source and destination ports and/or interfaces. Although dependent on specific models, this enhancement should serve to expand LogicMonitor’s network traffic flow monitoring support to Cisco ASA, Cisco Meraki, and VMware VeloCloud systems—as well as other systems not yet directly known to us.
- Support for the SNMP_Network_Interfaces DataSource. Interface descriptions can now also be obtained via the newer SNMP_Network_Interfaces DataSource. Previously, only the snmp64_if DataSource was supported for this purpose.
- Group-level filtering. The Traffic tab that displays at the device group level now offers the same filtering capabilities as the Traffic tab that displays at the device level.
- (FIX) NetFlow Device Metric report. Adjusted report to handle aggregate devices.
- (FIX) NetFlow Device Metric report. Resolved issue that was preventing report generation if fields were missing data.
- (FIX) Missing IFout field. Fixed issue causing the interface out ID to display as 2147483648 when IFout field was not found.
User Interface (UI)
- Continued expansion of usage summary counts. In v.141, LogicMonitor introduced several new usage count summaries on the Account Information page (Settings | Account Information) including usage counts for user roles, alert rules, dashboards, and others. Continuing with this initiative of enhanced tracking of resource usage, new usage counts have been added for session users, external API users, open alerts, and previous day alerts. In addition, these counts have been broken down into four logical grouping tables. For detailed descriptions of the various usage accounts available, see About the Account Information Page.
- Remote support status icon. The left-hand navigation menu features a new remote support status icon. This icon only displays if you are currently viewing an area of the product with version 4.x of the UI (currently the Alerts and Exchange pages). As discussed in Users, this icon provides the current status of LogicMonitor remote support access.
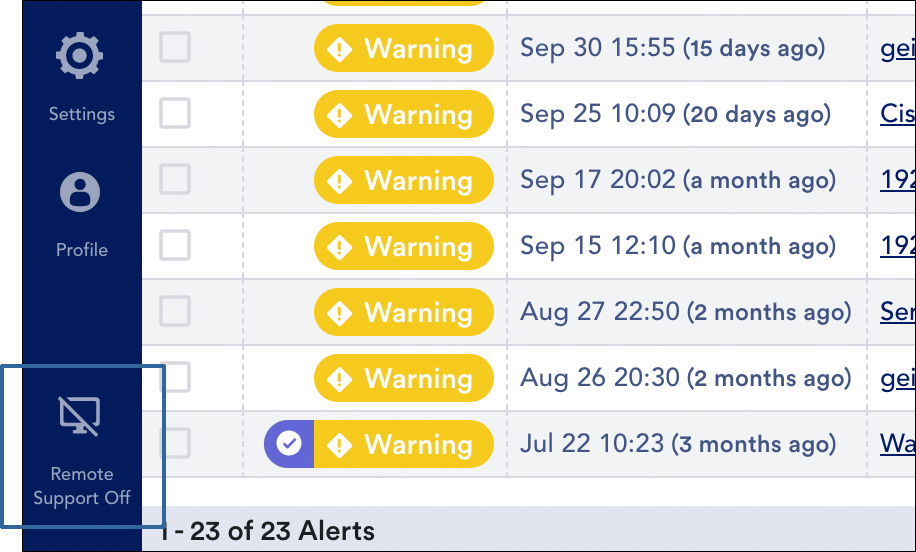
Note: When viewing areas of the product with version 3 of the UI, remote support status displays in the upper right of the platform header.
New, Updated, and Deprecated LogicModules
Recently released to the LogicMonitor public repository, our new and updated LogicModules are available for import to expand and enhance your monitoring coverage.
New LogicModules
- AWS Elemental MediaConvert – 1 DataSource
Monitors AWS Elemental MediaConvert job output duration, errors, and transcoding/standby time.
- Cisco_AIPSSM_Processor – 1 DataSource
Replacing the SNMP-based Cisco AIP SSM Memory Pools DataSource, this new DataSource offers a scripted SNMP version that returns accurate values. If you were previously using the now-deprecated DataSource, it can be deleted as it was providing invalid data.
- Cisco ASA – 1 SNMP SysOID Map
The \.1\.3\.6\.1\.4\.1\.9\.1\.2406 SNMP SysOID Map applies Cisco_ASA_* LogicModules to Firepower 2130 devices.
- Cohesity – 12 DataSources, 1 EventSource, 1 PropertySource
Monitors metrics related to storage, clusters, nodes, consumers, hardware, and data protection for your Cohesity platform. For setup and monitoring details, see Cohesity DataProtect and DataPlatform Monitoring.
- VMware VeloCloud – 5 DataSources, 1 PropertySource
Gathers metrics for VeloCloud edge health, throughput, performance, and errors via the VeloCloud Orchestrator API. Also gathers system CPU and memory metrics via SNMP. For setup and monitoring details, see VMware VeloCloud Monitoring.
Updated LogicModules
- Cisco_Meraki_Licensing – 1 DataSource
Updated to no longer fail to collect data on devices that have a license expiration date set to “N/A”.
- Citrix_Netscaler_AAA – 1 DataSource
Updated the metric type of the CurICASessions datapoint from derive to gauge.
- HP MSA – 10 DataSources
The scripted DataSources in the HPA monitoring suite have been updated to improve handling of leading 0s in the authentication hash.
- Infoblox_Appliance_DHCPv4Statistics – 1 DataSource
Changed the metric types of all datapoints from counter to derive.
- Linux_SSH_Filesystems – 1 DataSource
- Replaced invalid characters in wildvalues. Note: Upon import of this update, instances with invalid characters in their names will be deleted and replaced with new instances; however, impact should be minimal as the replaced instances would not have been successfully collecting data.
- Updated Active Discovery to no longer discover loop devices as they are dynamically allocated and thus always report 100% utilization resulting in unnecessary alerts.
- Microsoft SQL Server – 2 PropertySources
The Microsoft_SQLServer_SQLAuthConnections and Microsoft_SQLServer_Connections PropertySources now include the loginTimeout parameter in JDBC strings to resolve high CPU usage on Collector v29.003 caused by the PropertySource script not timing out correctly.
- NetApp – 2 PropertySources
The addCategory_NetApp and addCategory_NetApp_ESeries PropertySources now assign the category of “NetApp” to the system.categories property from API-based PropertySources rather than relying only on sysOIDs.
- NetSNMPCPUwithCores – 1 DataSource
Updated the appliesTo function to associate with F5 devices.
- Nimble_Array_Info – 1 DataSource
A value of NoData (rather than -1) is now returned for metrics that are not returned by the array.
- PaloAlto_FW_ThreatAnalysis_Events – 1 EventSource
This LogicModule now accepts the property paloalto.timezone which specifies a timezone offset in hours. If this property is not set, the offset defaults to UTC (0). Customers should check their devices to ensure that event timestamps from their devices are in UTC and set this new property accordingly.
- Printer Consumables- 1 DataSource
Added graphs and complex datapoints for status codes that are sometimes included as a negative return value for the Level metric, which should prevent incorrect graphs and false alerts. Added missing descriptions.
- Slack Events – 1 EventSource
Resolved issue that was causing outage updates to be displayed as duplicates of the same event.
- SNMP_Network_Interfaces – 1 DataSource
Fixed incorrect calculation of In/OutUtilizationPercent datapoint values.
- Topology Mapping – 1 TopologySource
General updates to LogicMonitor’s topology-mapping-specific LogicModules include:
- Networking_L2_snmpSwitch TopologySource
Discontinued matching OUI and LLDP edges on Brocade devices due to non-existent edges being generated.
- addERI_Device PropertySource
Added new OIDs for ERT discovery.
- Networking_L2_snmpSwitch TopologySource
- VMware vCenter Server Appliance – 10 DataSources
Updated all VMware VCSA DataSources to accept credentials via the vcsa.user/vcsa.pass properties. To ensure backwards compatibility, the DataSources will fallback to using esx.user/esx.pass if no VCSA-specific credentials are provided. Customers should migrate their VCSA-specific credentials to the new properties at their earliest convenience.
- WinSystemUptime – 1 DataSource
Added an UptimeDays complex datapoint to represent system uptime in days. Added missing datapoint descriptions.
Deprecated LogicModules
LogicMonitor deprecates LogicModules for a variety of reasons. Most often, it is because we have published a replacement LogicModule that provides superior access to the monitored technology (for example, supports more versions of the technology or provides improved scalability).
However, there are times when a LogicModule is deprecated with no replacement (for example, when a technology becomes defunct or security issues beyond LogicMonitor’s control arise).
Note: When importing a replacement LogicModule, you will not experience any data loss due to the name variation that LogicMonitor expressly adds. However, you will potentially collect duplicate data and receive duplicate alerts for as long as both LogicModules are active. For this reason, we recommend that you disable the deprecated LogicModule after you have imported its replacement and verified that it is working as expected.
| LogicModule Name/Type | Replaced By | Reason | End of Support Date |
| LogicModules Deprecated in v.143 | |||
| NetApp_SolidFire_Cluster NetApp_SolidFire_Volumes NetApp_SolidFire_Nodes NetApp_SolidFire_Drives (4 DataSources) |
N/A | General cleanup of DataSources that are not widely used and no longer work correctly. | 2021-01-19 |
| Cisco AIP SSM Memory Pools
(DataSource) |
Cisco_AIPSSM_Processor | The replacement DataSource offers a scripted SNMP version that returns accurate values. If you were previously using the now-deprecated DataSource, it can be deleted as it was providing invalid data. | 2020-11-16 |
| LogicModules Previously Deprecated (over past five versions) | |||
| Windows_SNMP_Services
(DataSource) |
N/A | Windows SNMP support has been deprecated by Microsoft since Server 2012 R2. As a result, this DataSource does not collect reliable data for Server 2016 and above. | 2020-12-02 |
| LM_Device_Count
(DataSource) |
LogicMonitor_Portal_Metrics | Uses a deprecated API. It is strongly recommended that this LogicModule be deleted and the replacement LogicModule be used. | 2020-10-26 |
| Arista_Switch_Storage
(DataSource) |
Arista_Switch_FlashStorage
Arista_Switch_Memory Arista_Switch_StorageUsage |
The replacement DataSources filter out instances to allow for separate DataSource monitoring of memory, flash storage, and standard storage. | 2020-10-26 |
| Linux_SSH_CGroupStatus
(DataSource) |
Linux_SSH_ServiceStatus | Did not provide accurate/useful data and can be deleted; the existing Linux_SSH_ServiceStatus DataSource has been retooled in v.141 to perform the same function. | 2020-09-18 |
| Linux_SSH_NetworkTCPUDP
(DataSource) |
Linux_SSH_TCPUDP | The replacement DataSource offers several advantages including (1) the use of the more widely supported nstat (part of iproute2) command and netstat as fallback if nstat is not available and (2) additional monitoring for packet, datagram and error related metrics | 2020-09-18 |
| QNAP Volumes
(DataSource) |
QNAP_Volumes | Changed the collection method from standard SNMP to scripted SNMP to properly handle the units returned for the VolFreeSize and VolTotalSize datapoints. In the now-deprecated version, these datapoint calculations were failing if the returned values were not expressed as terabytes leading to data misrepresentation. | 2020-09-18 |