v.147 Release
Last updated on 15 October, 2022
v.147 Highlights:
- General Enhancements and Fixes: New alert filter for identifying alerts with suppressed alert notifications, new NetFlow health widget, and more.
- New and Updated Monitoring: New LogicModules have been released for the monitoring of Extreme Networks, the LogicMonitor portal, Microsoft Azure Traffic Manager, Palo Alto firewalls, and more.
- Entering Beta: Push Metrics API and Cloud Integrations in LM Exchange.
General Enhancements and Fixes
Alerting
- New “Suppression Type” alert filter. A new alert filter (and alert table column) provides visibility into alerts whose notifications are suppressed by LogicMonitor for the purpose of reducing unnecessary alert noise. The new filter allows you to organize alerts according to the reason behind notification suppression. There are five available suppression types that can be used as filter criteria:
- None. Returns alerts whose notifications have not been suppressed. (Note: Refrain from using the None filter criterion as it is not working as intended. This is a known issue that will be addressed in an upcoming release.)
- SDT. Returns alerts whose notifications have been suppressed due to scheduled downtime (SDT) of the triggering resource/instance.
- Host Down. Returns alerts whose notifications have been suppressed because the Collector has not been able to access the triggering resource (host) for a period of six minutes or more.
- Cluster Alert. Returns alerts whose notifications have been suppressed because the triggering resources/datapoints are members of a cluster alert and the cluster alert has been configured to supersede the individual alerts.
- Collector Down. Returns alerts whose notifications were suppressed as a result of being triggered by devices impacted by a down Collector.
- Anomaly Detection. Returns alerts whose notifications were suppressed as a result of being determined non-anomalous by LogicMonitor’s dynamic thresholds.
Note: To include the accompanying suppression column in your alert table, you’ll need to customize the column settings for your alert table. To learn more about filtering alerts and customizing alert table settings on the Alerts page, see Managing Alerts from the Alerts Page.
- (FIX) Alert notification sound not playing. In the prior version of the Alerts page, which is accessible by removing the “s” from the very end of the Alerts page URL (transforming “/alerts” to “/alert”), alert sounds were not playing upon arrival of alerts. This issue has been fixed.
- (FIX) Error on opening anomaly detection version of graph from Alerts page. Previously, when attempting to open the anomaly detection version of a graph from the Graphs tab that displays in an alert detail summary, an error was returned. This has been fixed.
- (FIX) Alert clear notifications not delivered during SDT. Previously, LogicMonitor would only deliver alert clear notifications during scheduled downtime (SDT) if alert creation time occurred before SDT start time. Now, alert clear notifications will be delivered during SDT regardless of alert creation time.
- (FIX) Alerts erroneously referencing dynamic threshold as trigger. Previously, alerts generated by static datapoint thresholds with a Delta operator were referencing dynamic thresholds as trigger if dynamic thresholds were also configured for the datapoint. This issue has been fixed.
Audit Logs
- Capturing dynamic threshold updates at resource group/instance levels. LogicMonitor’s Audit Logs now comprehensively capture updates made to dynamic thresholds at the resource group/instance level (from the Resources page).
Cloud Monitoring
- AWS updates:
- Discovery improvements for AWS SQS. Previously, AWS did not support pagination and only returned the first 1000 Simple Queue Service (SQS) resources. An update from AWS now allows LogicMonitor to discover SQS resources beyond the initial 1000 SQS resources. Note: If you have more than 1000 SQS resources, this discovery improvement could result in an increase in the number of billable cloud resources.
- New system properties for monitoring AWS RDS. LogicMonitor now sets four new system properties for AWS Relational Database Service (RDS) resources for the purpose of limiting data collection to RDS instances with Performance Insights enabled. These properties are:
- system.aws.performanceInsightsEnabled
- system.aws.performanceInsightsKMSKeyId
- system.aws.performanceInsightsRetentionPeriod
- system.aws.dbiResourceId
Kubernetes Monitoring
- New Argus version available. The new v5.0.0 version of Argus is now available. As with all major Argus version releases, opt-in is required. See Upgrading Kubernetes Monitoring Applications for upgrade details and enhancements featured in this new version.
LM Logs
- (FIX) Intermittent log visibility on Logs page. Fixed an issue that was preventing the display of new logs on the Logs page, even upon page refresh.
- (FIX) ELB logs incorrectly mapped to LM resources. Fixed an issue that was preventing correct mapping of ELB logs forwarded from sub-directories in an S3 bucket.
Network Traffic Flow Monitoring
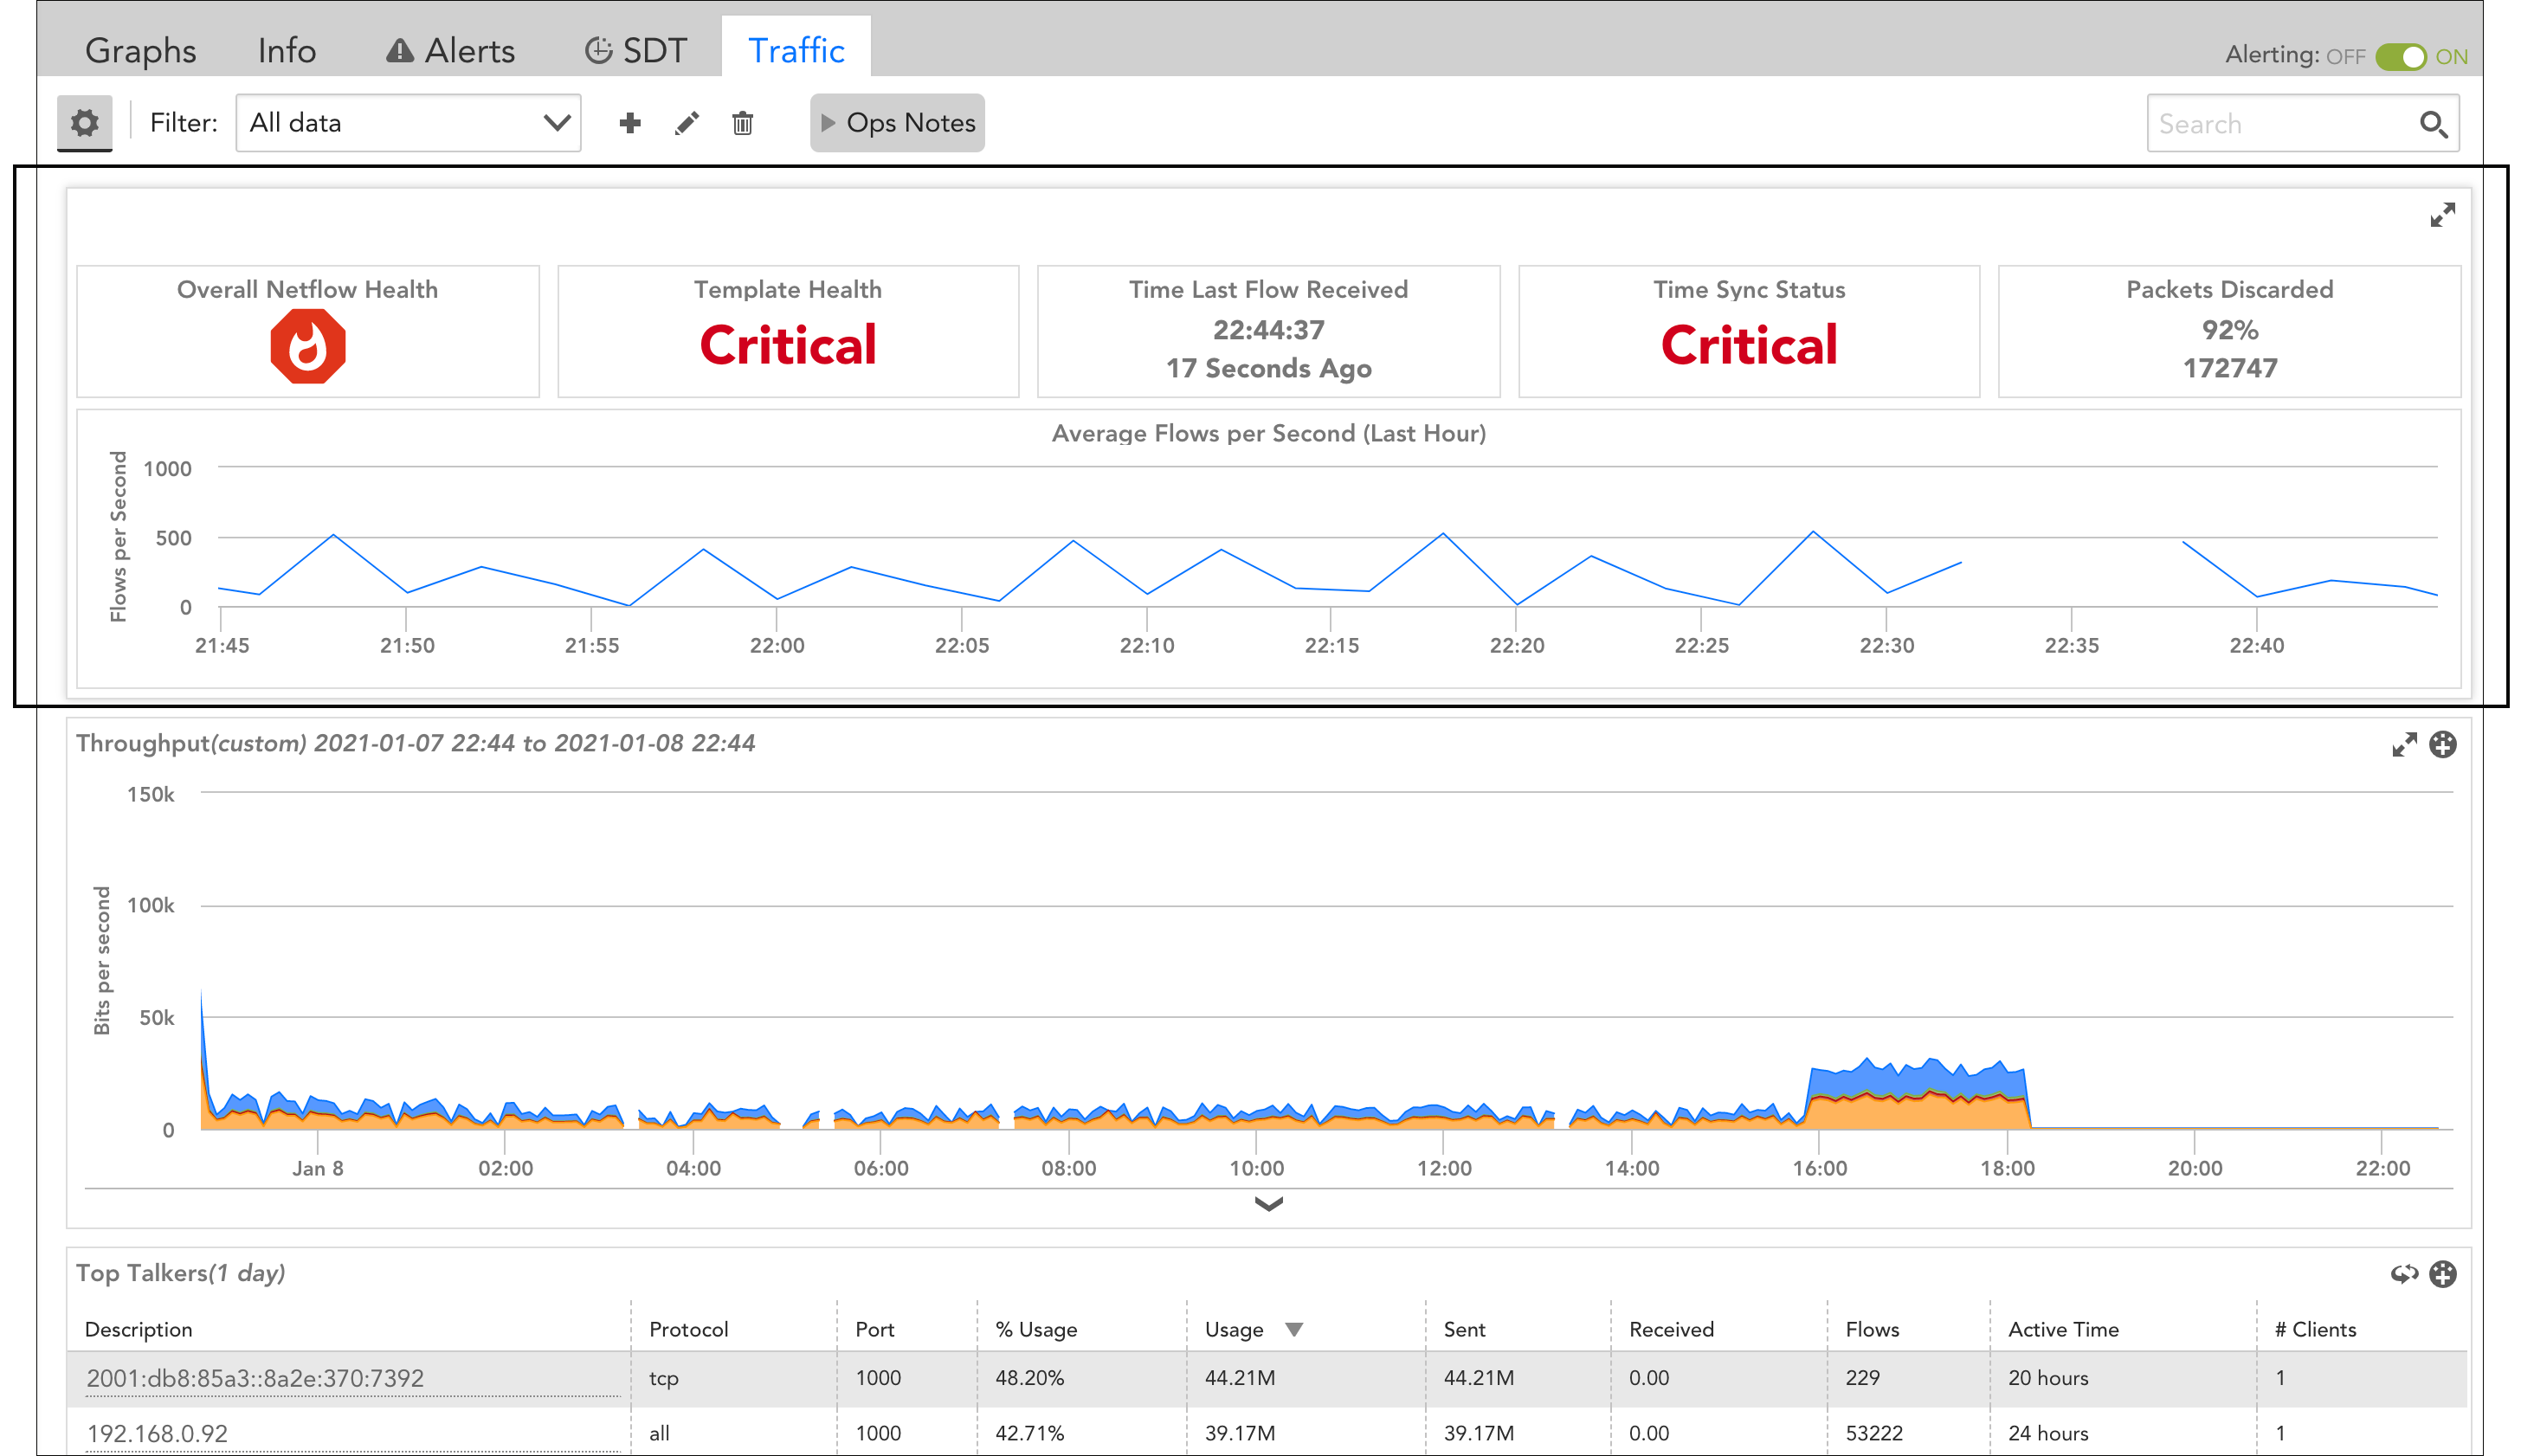
- NetFlow Health widget. The Traffic tab now displays an expandable/collapsible widget that provides network traffic flow monitoring health at a glance. This widget highlights the status of several key network flow markers and graphs the last 60 minutes of network traffic monitoring activity.
Because there is not always an obvious sign that network traffic flow monitoring has been diminished or interrupted, this new widget will serve to provide an earlier warning for time sync issues or high volumes of malformed templates or flows.
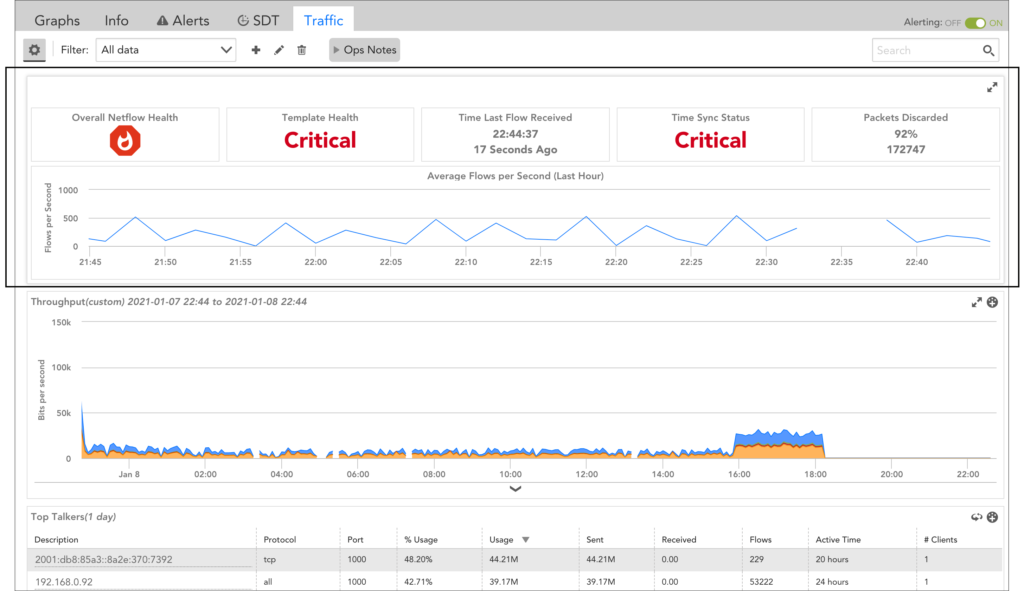
Note: This widget requires Collector version 30.100 or greater. Because this version is not yet available, the widget will be auto-collapsed upon release.
Reporting
- (FIX) Dynamic threshold settings not reported. Previously, dynamic thresholds configured for datapoints were not displaying in the output of the Alerts Thresholds report (or on the Alert Tuning tab). This issue has been fixed.
- (FIX) Resource Metric Trends report. In some cases, the Resource Metric Trends report was including negative values on its y-axis scale—even when all reported datapoint values were positive. This issue has been fixed.
- (FIX) NetFlow Device Metric report. IPv6 resolved DNS hostnames now display in the NetFlow Device Metric report.
Topology Mapping
- (FIX) Higher-priority ERTs not assigned. Previously, a higher-priority External Resource Type (ERT) would not be set on a device if a lower, different category ERT was present. This issue has been fixed.
User Interface
- (FIX) Erroneous display of dynamic threshold usage warning upon login. Previously, LogicMonitor erroneously displayed a warning message upon portal login that the allowed limit for configured dynamic thresholds had been exceeded. This issue has been fixed.
- (FIX) Missing note prompt when updating static datapoint thresholds at resource group/instance level. Upon removing, adding, or updating static datapoint thresholds at the resource group or instance level (from the Resources page), users were no longer being allowed to add notes to accompany the action for display in the static threshold history. This ability had been inadvertently removed in a previous version, but has now been returned.
New, Updated, and Deprecated LogicModules
Recently released to the LogicMonitor public repository, our new and updated LogicModules are available for import to expand and enhance your monitoring coverage.
New LogicModules
| LogicModule/System Name | Details |
| addCategory_XenServer | (PropertySource) Applies the “XenServer” category to the system.categories property of devices running version 8 and above.
As discussed in the Updated LogicModules section of these release notes, the DataSources for Citrix XenServer monitoring have been updated to recognize this new category. |
| ExtremeNetworks_PowerSupply_Status | (DataSource) Tracks power usage, input voltage and status for Extreme Networks chassis PSUs; resolves alerting issues with the PowerAlarm datapoint in the Extreme Chassis Status DataSource. |
| LogicMonitor_Portal_DataSources
LogicMonitor_Portal_Overview |
(2 DataSources) Tracks instance, datapoint and alert counts for the other DataSources in the LogicMonitor Portal monitoring package; provides summary metrics for instances, alerts, dashboards, groups and topology maps.
Note: The other LogicModules in the LogicMonitor Portal monitoring package have been updated to support the endeavors of these two new DataSources. |
| Microsoft_Azure_TrafficManager | (DataSource) Tracks health status and queries for Microsoft Azure Traffic Manager profiles. |
| PaloAlto_FW_QoS_V8+ | (DataSource) Supports the monitoring of QoS metrics on devices using the new API endpoint (PAN-OS v8+); tracks passed bits, dropped packets, and throughput per QoS class. |
| PropertySource:
addERI_VMware_VeloCloud TopologySource: VMware_VeloCloud_Topology |
(1 PropertySource, 1 TopologySource) Adds topology support for VeloCloud Edge routers and links.
As discussed in the Updated LogicModules section of these release notes, existing LogicModules for VMware VeloCloud monitoring have been updated to provide topology support. |
Updated LogicModules
| LogicModule/System Name | Details |
| addCategory_Isilon | (PropertySource) Updated the AppliesTo statement to exclude CloudGenix devices, which have been identified as inappropriately responding to Isilon OIDs; updated script to check the sysinfo property before trying to query SNMP.
Important: This update will prevent any newly added CloudGenix devices from having the “Isilon” category applied for the system.categories property; however, since categories are not removed by Active Discovery, users will need to manually update the categories on any affected CloudGenix devices. |
| Arista_EOS | (ConfigSource) Updated to filter out free memory values. |
| Aruba_WirelessController | (ConfigSource) Updated pagination regex to be case insensitive. |
| AWS_EC2_TrustedAdvisorServiceLimits
AWS_IAM_ServiceLimits AWS_VPC_TrustedAdvisorServiceLimits |
(3 DataSources) Updated collection interval to 60 minutes to match the frequency of AWS Trusted Advisor updates; increased Active Discovery intervals. |
| Cisco_Nexus_FRU_Power | (DataSource) Updated Active Discovery to only discover instances of ports that do not have an operating state of “down”; disabled instance deletion so previously discovered instances are not removed when ports are taken down; added safeguard to prevent instance properties from being populated with empty/null data. |
| Cisco_Meraki_AccessPoint_Interfaces
Cisco_Meraki_AccessPoints Cisco_Meraki_DeviceCount Cisco_Meraki_Gateway_Interfaces Cisco_Meraki_Gateways Cisco_Meraki_SecurityAppliance_Interfaces Cisco_Meraki_SecurityAppliances Cisco_Meraki_Switch_Interfaces Cisco_Meraki_Switches Cisco_Meraki_UplinkLossAndLatency |
(10 DataSources) For all DataSources except Cisco_Meraki_UplinkLossAndLatency, updated collection script to use datasourceinstanceProps to gather wildvalues when running on Collectors with version 29.105 and above due to collection issues.
For Cisco_Meraki_UplinkLossAndLatency only, updated to ignore timeseries with null data when calculating averages. |
| Cisco_Wireless_RogueAccessPoints | (DataSource) Updated Active Discovery script to avoid calling macOID; updated to avoid walking the whole rogue routers entities table by making multiple smaller calls for specific metrics; moved casting dates to its own function and checking for null values. |
| Cohesity_DataPlatform_ProtectionJobs | (DataSource) Updated Active Discovery script to discover all protection jobs that have ever been run and removed filtering conditions; updated endpoints used for collection and Active Discovery; added datapoint for hours since last backup; iIncreased collection interval; updated technical notes. |
| F5_BigIP_SSL_VIP_Certs | (DataSource) Updated Active Discovery script to support both IPv4 and IPv6 addresses; added debug output. |
| FreeBSD_Filesystem_Usage | (DataSource) Updated filters to filter out devfs files and the entirety of the /proc and /dev folders. |
| LogicMonitor_Collector_BufferDataReporterLatencyJMX | (DataSource) Fixed display name; added to “Collector” DataSource group; removed unused/invalid datapoint; updated AppliesTo statement to match on the system.categories property rather than the system.collector property. |
| DataSources:
LogicMonitor_Portal_Alerts LogicMonitor_Portal_APIUtilization LogicMonitor_Portal_Collectors LogicMonitor_Portal_Resources LogicMonitor_Portal_Users LogicMonitor_Portal_Websites PropertySource: addCategory_LogicMonitorPortal |
(6 DataSources, 1 PropertySource) Made updates to prevent devices from incorrectly showing as dead; added support for logicmonitor.access.id and logicmonitor.access.key properties to support functioning of the two new DataSources released for the LogicMonitor Portal monitoring package (these new DataSources are highlighted in the New LogicModules section of these release notes).
For the LogicMonitor_Portal_Users and LogicMonitor_Portal_Alerts DataSources only, fixed regression unintentionally introduced in previous DataSource versions where collection output functions were removed. For the LogicMonitor_Portal_Users DataSource only, added datapoints for roles and session users. |
| Microsoft_ActiveDirectory_Computers
Microsoft_ActiveDirectory_DomainController Microsoft_ActiveDirectory_Domains Microsoft_ActiveDirectory_Forests Microsoft_ActiveDirectory_FSMORoles Microsoft_ActiveDirectory_GroupPolicies Microsoft_ActiveDirectory_OrganizationalUnits Microsoft_ActiveDirectory_PasswordPolicy Microsoft_ActiveDirectory_SitesSubnets |
(9 ConfigSources) Added retry logic; updated collection script to fallback to using WinRM if the device is not a Collector and the Collector credentials are not being used and use PSSessions; added session health check command to collection script for Microsoft_ActiveDirectory_FSMORoles. |
| Microsoft_Azure_ExpressRouteCircuit | (DataSource) Added metrics ARP/BGP availability and throughput for Microsoft, public and private peering types; changed collection interval to one minute. |
| Microsoft_Azure_ResourceHealth | (DataSource) Removed the AvailabilityStateWarningAlerts complex datapoint; updated the description of the AvailabilityState datapoint to clarify the purpose of the Unknown status code. |
| Microsoft_FailoverCluster_Resources | (DataSource) Fixed invalid AppliesTo statement. |
| Networking_L2_snmpSwitch | (TopologySource) Updated to filter out 0.0.0.0 which is used in some CDP IDs. |
| DataSources:
All Oracle_Database_* DataSources PropertySource: Oracle_Database_Names |
(19 DataSources) Updated the technical notes for all DataSources in the Oracle monitoring package with a link to the Oracle Monitoring support article.
(PropertySource) Updated script to validate device OS using the auto.linux.kernel.name property in addition to system.sysinfo property to address cases where system.sysinfo is not populated (usually when SNMP is not enabled for the device). |
| PaloAlto_FW_GlobalProtectGateway_ConfigXML | (ConfigSource) Updated to filter out ephemeral lines under the “ip-pool-next-ip” and “ip-pool-next-ip-v6” tags from configs. |
| PaloAlto_GlobalProtect_Sessions | (DataSource) Updated display name to match other LogicModules in the PaloAlto GlobalProtect monitoring package. |
| DataSources:
VMware_VeloCloud_EdgeHealth VMware_VeloCloud_EdgeLinkHealth PropertySource: addERI_Device |
(2 DataSources, 1 PropertySource) Added external resource identifier (ERI) generation for VeloCloud Edge routers and links.
Note: As discussed in the New LogicModules section of these release notes, two new LogicModules have been added to the VMware VeloCloud monitoring package that add topology support. |
| Xen Host CPU-
Xen Host NIC- Xen Host Status- Xen Pool- Xen Storage- Xen VM Disk- Xen VM NIC- Xen VM Performance- |
(8 DataSources) Updated the AppliesTo statement to additionally look for the “XenServer” category.
Note: As discussed in the New LogicModules section of these release notes, a new PropertySource has been released for Citrix XenServer that applies the new “XenServer” category. |
Deprecated LogicModules
LogicMonitor deprecates LogicModules for a variety of reasons. Most often, it is because we have published a replacement LogicModule that provides superior access to the monitored technology (for example, supports more versions of the technology or provides improved scalability).
However, there are times when a LogicModule is deprecated with no replacement (for example, when a technology becomes defunct or security issues beyond LogicMonitor’s control arise).
Note: When importing a replacement LogicModule, you will not experience any immediate data loss due to the name variation that LogicMonitor expressly adds. However, there will be a diversion in data collection between the deprecated and new LogicModule, and you will potentially collect duplicate data and receive duplicate alerts for as long as both LogicModules are active. For this reason, we recommend that you disable monitoring of the DataSource instances at the resource or resource group level after you have imported its replacement. When DataSource monitoring is disabled in this way, it stops querying the host and generating alerts, but maintains all historical data. At some point in time, you may want to delete the legacy DataSource altogether, but consider this move carefully as all historical data will be lost upon deletion. For more information on disabling DataSource monitoring, see Disabling Monitoring for a DataSource or Instance.
| LogicModule Deprecated/Replacement | Reason | End of Support Date |
LogicModules Deprecated in v.147 |
||
| Deprecated: Unomaly Anomalies Frequency Spikes Unomaly Known Events Unomaly New Anomalies Replacement: New LM Logs feature, released in fourth quarter of 2020. |
(3 EventSources) Functionality has been fully replaced by LogicMonitor’s new LM Logs feature. | 2021-02-17 |
LogicModules Previously Deprecated (over past five versions) |
||
| Deprecated: VMware_VeloCloud_SystemStats Replacement: N/A |
(1 DataSource) It has been determined that all data gathered by this DataSource is being reported more robustly through the existing NetSNMPCPUwithCores and NetSNMP_Memory_Usage DataSources, making it redundant and unnecessary. | 2021-02-09 |
| Deprecated: snmpFreeBSDDisk- Replacement: FreeBSD_Filesystem_Usage |
(1 deprecated DataSource) Enhancements featured by replacement include an updated AppliesTo statement that includes OpenBSD systems; updated filters to exclude /proc and /dev and allow discovery of files between 0-100 bytes on filesystems; new complex datapoints; and support for drives over 8 TB and block sizes other than 4 K. | 2021-01-19 |
| Deprecated: Windows_Cluster_ResourceState Windows_Cluster_NodeState Windows_Cluster_DiskPartitions WinClusterResources- WinClusterResourceGroup- WinClusterNodes- WinClusterGroupToNode- Replacement: Microsoft_FailoverCluster_Resources Microsoft_Windows_Cluster_NodeStatus Microsoft_Windows_Cluster_Disks Microsoft_Windows_Cluster_Resources Microsoft_Windows_Cluster_ResourceGroups Microsoft_Windows_Cluster_Nodes |
(7 deprecated DataSources) The replacement DataSources apply to the cluster VNN rather than each node individually, significantly reducing the incidence of duplicate alerts.
Note: The six replacement DataSources listed here are part of a bigger monitoring package for Microsoft Windows Failover Clusters that was released in v.146. |
2021-01-19 |
| Deprecated: NetApp_SolidFire_Cluster NetApp_SolidFire_Volumes NetApp_SolidFire_Nodes NetApp_SolidFire_Drives Replacement: N/A |
(4 DataSources)General cleanup of DataSources that are not widely used and no longer work correctly. | 2021-01-19 |
| Deprecated: CiscoCPU- Replacement: Cisco_CPU_Usage |
(1 DataSource) Converted to a scripted DataSource and uses an additional OID to resolve duplicate wildvalues. | 2021-01-04 |
| Deprecated: Liebert Power lines Liebert Temperature probes- Liebert UPS Temperature probes- Replacement: Liebert_Power_Lines Liebert_System_Temperature |
(3 DataSources) Rewrote DataSources as scripted SNMP; merged monitoring of temperature and UPS temperature probes into a single DataSource; added new power and voltage metrics for power lines monitoring; fixed an incorrect filter for power lines. | 2021-01-04 |
| Deprecated: LogicMonitor_Portal_Metrics Replacement: LogicMonitor_Portal_Alerts LogicMonitor_Portal_Collectors LogicMonitor_Portal_Resources LogicMonitor_Portal_Users LogicMonitor_Portal_Websites |
(1 DataSource) LogicMonitor released five new DataSources that provide 15 additional datapoints and group related metrics into separate DataSources, making it easier to hone in on specific aspects of your portal. For more information, see LogicMonitor Portal Monitoring. | 2021-01-04 |
| Deprecated: F5_BigIP_PoolMemberStatistics Replacement: F5_BigIP_PoolMemberStats |
(1 DataSource) Active Discovery and data collection methods were converted from SNMP to script to improve overall efficiency. | 2020-12-07 |
| Deprecated: Veeam_BackupAndReplication_Jobs_VMWareSureBackups Replacement: Veeam_BackupAndReplication_Jobs_SureBackups |
(1 DataSource) “VMware” was removed from the DataSource name as the backups are not VMWare specific. | 2020-12-07 |
| Deprecated: Cisco AIP SSM Memory Pools- Replacement: Cisco_AIPSSM_Processor Cisco_AIPSSM_MemoryPools |
(1 DataSource) The replacement DataSources offer a scripted SNMP version that returns accurate values. If you were previously using the now-deprecated DataSource, it can be deleted as it was providing invalid data. | 2020-11-16 |
| Deprecated: LM_Device_Count Replacement: LogicMonitor_Portal_Resources |
(1 DataSource) Uses a deprecated API. It is strongly recommended that this LogicModule be deleted and the replacement LogicModule be used. | 2020-10-26 |
| Deprecated: Arista_Switch_Storage Replacement: Arista_Switch_FlashStorage Arista_Switch_Memory Arista_Switch_StorageUsage |
(1 DataSource) The replacement DataSources filter out instances to allow for separate DataSource monitoring of memory, flash storage, and standard storage. | 2020-10-26 |
Entering Beta
Push Metrics API
LogicMonitor is developing a Push Metric API in order to allow metrics to be sent directly to LogicMonitor without the use of a Collector. Some technology landscapes where this capability is becoming vital include server-less infrastructures such as AWS Lambda, large distributed microservices environments with custom metrics (including business metrics), and IoT environments.
The first phase of beta for Push Metrics API is underway! In this first beta phase, a REST API is provided for beta participants that features endpoints for metric ingestion, resource property update, and instance property update.
In the second beta phase (targeted for the later half of Q1 2021), the REST API and a Python SDK will additionally be available for beta participants. We plan on making other language-specific SDKs available soon after.
If you have a compelling use case and the resource availability, and would like to be considered for participation in either the first or second beta phase, please complete the Customer Beta survey. In the comments section please let us know if you would like to use the REST API directly, via Python SDK, or have a request of another language-specific SDK such as Go, Java, or .NET.
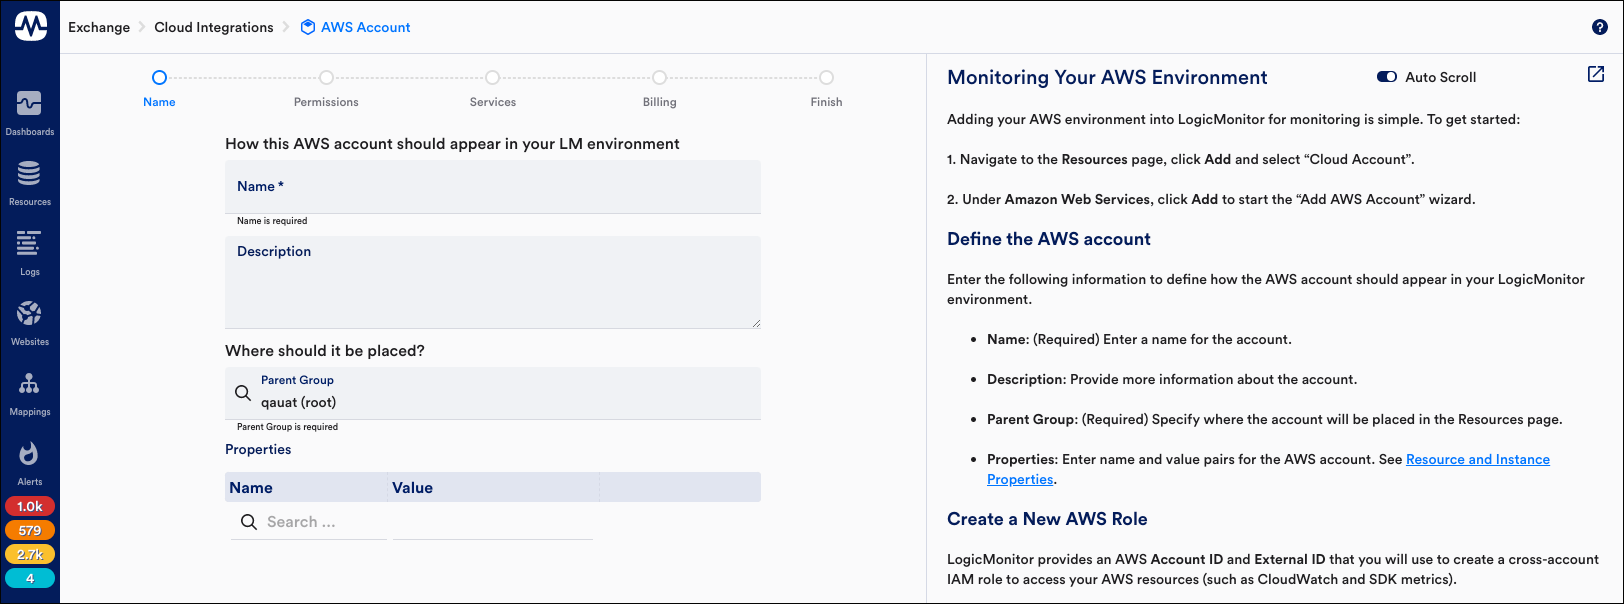
Cloud Integrations in LM Exchange
In this beta release, we’ve made some cloud integrations available through LM Exchange in your LogicMonitor portal. LM Exchange will make it possible for you to sort and filter for modules by type or status, for example, to see when upgrades are available or to review all the LogicModules available in a package.
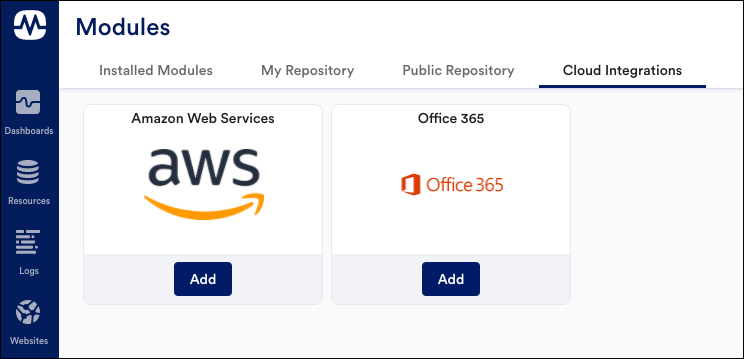
Specifically, for this beta, the AWS cloud integration onboarding has received a facelift and can now be initiated from LM Exchange. Microsoft Azure and GCP will follow suit in future releases.
Also, as part of this beta, we are beginning our SaaS API authentication for Office365—with more SaaS solutions (Zoom, SalesForce, and so on) to follow in coming releases. This marks a new method for agentless collection of SaaS application metrics.
If you are interested in participating in the beta program for SaaS integrations, reach out to your LogicMonitor representative. Ideal partners are already leveraging cloud monitoring and are willing and able to integrate with at least one Office 365 subscription and participate in feedback rounds.