


v.149 of the LogicMonitor portal is scheduled to roll out to customers from March 8 through March 17.
Highlights:
- General Enhancements and Fixes: A new auto-assigned system property for on-premises devices, several enhancements to LM Logs, and more.
- New and Updated Monitoring: New LogicModules for monitoring Storage Spaces Direct (S2D), Citrix NetScaler, and more.
IMPORTANT: The snmpIf- and snmp64_If- DataSources will be officially deprecated in this release and replaced by the SNMP_Network_Interfaces DataSource. Learn more under Updated LogicModules. - Entering Beta: Push Metrics API (ongoing), and Alert Grouping Graph on Alerts page (ongoing).
- Looking Ahead: Sunset of the RPC API.
General Enhancements and Fixes
Alerting
- (FIX) Addressed several issues related to initiating SDT from the Alerts page:
- Fixed issue preventing SDT in durations of weeks, months, or years from being scheduled.
- Fixed issue preventing the SDT icon from being immediately shown after setting SDT for an alert.
- Fixed issue preventing SDT initiation for the device associated with an alert.
- Attempting to initiate SDT from the old Alerts page UI (available by transforming “/alerts” to “/alert” in the URL) was causing a blank page to be generated. This has been fixed and SDT can now be initiated from the previous UI version of the Alerts page.
- (FIX) Improved warning message when acknowledging a previously acknowledged alert. When acknowledging an alert that was previously acknowledged, LogicMonitor now displays a descriptive warning message: “Alert <ID> has already been acknowledged”. Previously, the warning consisted of a 400 error.
Audit Logs
- (FIX) Unnecessarily capturing unchanged static thresholds. Previously, LogicMonitor’s Audit Logs were unnecessarily capturing unchanged static threshold data when dynamic threshold data was updated at the resource group level. This has been fixed and Audit Logs now only capture details of dynamic threshold updates.
Cloud Monitoring
- (FIX) Microsoft Azure. The Azure File Storage Capacity was not triggering an alert because the allowed delay time limit was too short. This delay time has been increased (default 2 hours). Added GCC configurations: azure.collector.allowedDelay and azure.allowedDelay.collectionTypes.
- (FIX) Microsoft Azure. Added subscriptionId as additional argument to string.format() to fix an issue where Azure Advisor EventSource was not working.
Collectors
- EA 29.106. Collector version EA 29.106 was released on February 10. This version fixes the known issue present in versions 29.101 through 29.105 that caused resources with heartbeats to be incorrectly marked as dead/down.
Collector releases are deployed independently of LogicMonitor platform releases. For more information on the different Collector versions available for upgrade, see Collector Versions.
LM Logs
- (NEW) Added RBAC support! New Logs permissions for: viewing logs, viewing pipelines, and managing pipelines are now available within roles. You may find this useful for controlling which users can see which logs, and who can create alert conditions. To view logs, a user also needs access to the resources the logs are associated with.
Note: Users who don’t have access to all resources will only be able to view logs for up to 300 resources when no filters are used on the Logs page. This will be fixed in an upcoming release. To avoid this, use at least one filter as a workaround.
- (HOTFIX) Some customers were unable to Add Role when LM Logs was disabled. A fix for this has been deployed.
- (NEW) Multiple resource selection in Pipelines. You’re now able to select more than one resource when creating pipelines.
- (NEW) Two new resource group filtering options were added to the Logs page, allowing you to (1) filter logs associated with resources directly in the selected group and (2) filter logs associated with resources in the selected group AND its subgroups. These filters may be useful for displaying desired logs more efficiently.
- (ENHANCEMENT) Log Alerts. Consistent with other alert types, users can now un-acknowledge log alerts.
- (ENHANCEMENT) Log Alerts. Removed the option to create log alerts from a row in the logs table if at least one log processing pipeline does not exist, because alert conditions are created within pipelines.
Dashboards
- (FIX) NetFlow widget. Previously, the NetFlow widget only displayed the top 10 flows, regardless of the number specified (10, 20, 50 or 100) when configuring the widget. This has been fixed.
- (FIX) Top Applications pie chart not properly rendering on dashboard. Previously, when the Top Applications pie chart was added as a widget to a dashboard (from the Traffic tab), the pie chart remained static, only displayed a solid circle at 100%. This issue has been fixed and the pie chart now correctly displays percentage segmentations when viewed from a dashboard.
Kubernetes
- (FIX) Argus v5 was crashing in some cases following API rate limiting. This has been fixed.
- (ENHANCEMENT) Added Kubernetes Monitoring support for Kubernetes 1.20.
Netflow Traffic Monitoring
- (ENHANCEMENT) Improved support for Cisco ASA devices. Previously, some Cisco ASA devices were not showing network traffic flow data. To resolve this issue, LogicMonitor now accepts alternative initiator and responder fields from the ASA flows to fulfill field requirements.
Important: Collector version 29.107 or higher is required for this enhancement; 29.107 has not yet been released.
Resources
- (NEW) New system.hoststatus property. A new auto-assigned system information property named
system.hoststatushas been added for all on-premises devices (it is not applicable to cloud resources). This property updates the status of the device every two minutes. Valid values for this property are:- normal – device and associated Collector host are both up
- dead-collector – device’s associated Collector host is down device and Collector host are both down
- dead – device is down and associated Collector host is up
Reporting
- (FIX) Alerts report. Log alerts weren’t being reflected in the output of the Alerts report. This has been fixed.
- (FIX) Email notification of report generation failure. When LogicMonitor determines that a report will take a long time to generate, the user is notified that results will be delivered via email. However, if the report were to subsequently encounter an error, users were not being notified via email that generation had failed. This has been fixed.
- (FIX) Resource Metric Trends report. Two updates have been made to the Resource Metric Trends report:
- Duplicate graph lines. Previously, this report created duplicate graph lines if duplicate datapoints were present. To resolve this issue, instance checks are now performed while generating graphs and identified duplicate datapoints are treated as a single datapoint with a single plotting.
- Differing timestamp formats. Previously, the timestamps that displayed when hovering over a point on the graph featured differing formats depending on the duration of the reporting period. This has been fixed and all timestamps are now uniformly formatted.
REST API
- (ENHANCEMENT) More precise error messages for appliesTo field updates. Previously, if a request to update the appliesTo field was made by a read-only user and an incorrect value for the logicModuleId field was provided, the response generated was “Unknown error.” This has been fixed and responses now precisely detail the reason for the error.
- (ENHANCEMENT) More precise error messages for “Invalid json body” errors. The general error response message of “Invalid json body” has been enhanced to additionally include information about the cause of the exception.
- (FIX) Incorrect value returned for the enableFailOverOnCollectorDevice field when Collector is a member of an ABCG. Previously, the API response provided by a request to the
/setting/collector/collectors/{id}endpoint would return the incorrect value of “false” for theenableFailOverOnCollectorDevicefield when the Collector was part of an ABCG (Auto-Balanced Collector Group). This has been fixed and the value of “true” is now returned in this case.
User Interface
- (FIX) Pagination preservation. Previously, pagination on the Alerts page was sticky. This has been fixed and pagination is now appropriately reset once you navigate away from the Alerts page.
- (ENHANCEMENT) Topology Mapping. Updated map icons and hover behavior to be consistent with new UI.
User Management
- (FIX) Permissions for Big Number widget on dashboards. Big Number widget (including resourceCount metrics) should be visible for users with Manage permissions on Dashboard and View permissions on the Resources.
New, Updated, and Deprecated LogicModules
New LogicModules
| LogicModule/System Name | Details |
| addCategory_InfobloxDHCP | (PropertySource) Probes both the DHCP IPv4 and IPv6 Infoblox OIDs in order to set the “InfobloxDHCP” category. |
| addCategory_NetscalersActive | (PropertySource) Automatically applies the “NetscalersActive” system category to the SNIP of Netscaler HA devices. Requires that the device hostname match the SNIP. It is recommended that customers remove any manually set “NetscalersActive” categories from devices since the PropertySource will not. May cause alerts on import if new SNIP devices are discovered. Note: The Netscaler_lb_vip- DataSource for this monitoring package has also been updated. |
| Microsoft_Windows_Cluster_S2DStatistics Microsoft_Windows_Cluster_S2DStoragePoolStatus Microsoft_Windows_Cluster_S2DVirtualDisk |
(3 DataSources) Monitors virtual disk health, storage pool status along with aggregated metrics for throughput and performance for Microsoft Storage Spaces Direct. Note: The addCategory_WindowsFailoverCluster PropertySource for this monitoring package has also been updated to support these new DataSources. |
Updated LogicModules
| LogicModule/System Name | Details |
| SNMP_Network_Interfaces | (DataSource) Added discovery filters, alerts and datapoints for throughput in Mbps; made various script fixes and optimizations; allowed for filtering commonly filtered interface types by setting the interface.filtering property on the host to “true”. IMPORTANT: With these updates, LogicMonitor is officially deprecating the snmpIf- and snmp64_If- DataSources. All the functionality of these DataSources is provided in the SNMP_Network_Interfaces DataSource, along with enhancements including additional datapoints, scripted data collection for improved performance, instance-level properties for additional filtering capabilities, and more precise alerting to eliminate alert storms caused by the old DataSources. Customers are recommended to disable monitoring of the now-deprecated DataSources at the Resource or Resource Group-level after importing the replacement. See Deprecated LogicModules for details on how to transition from a deprecated to a replacement LogicModule. |
| addCategory_Isilon | (PropertySource) Updated to ensure that the fallback discovery method is executed when the device does not have the “Isilon” category set; fixed an invalid sysinfo check that was preventing “Isilon” category from being added to devices. |
| addCategory_WindowsFailoverCluster | (PropertySource) Updated to apply appropriate categories for monitoring Storage Spaces Direct. Updated to use PowerShell remoting. Note: Three new DataSources were added to this monitoring package to support monitoring of Storage Spaces Direct |
| addERI_Device | (ERI PropertySource) Fixed incorrect identification of FortiSwitch devices as firewalls; blocked problematic SunOS MAC address. |
| addERI_Juniper | (ERI PropertySource) Blocked MAC for redundant ethernet interface (reth). |
| Cisco_CUCM_LBM | (DataSource) Updated the AppliesTo statement to correctly reference the cucm.api.user and cucm.api.pass properties (previously these API credential properties were being referenced with incorrect names). |
| Cisco_IPSec_PolicyBasedTunnels | (DataSource) Updated wildvalues to be unique. This will create new instances which will result in the loss of historical data for existing instances. |
| Cisco_Meraki_Gateway_Interfaces Cisco_Meraki_SecurityAppliance_Interfaces Cisco_Meraki_AccessPoint_Interfaces |
(3 DataSources) Fixed an issue related to wildvalue handling in 29.10x Collectors. |
| Linux_SSH_CPUMemory | (DataSource) Fixed complex datapoint expression for PercentUsedMemory, was previously calculating a decimal value instead of a percentage. |
| LogicMonitor_Collector_LMLogs | (DataSource) Removed alert on SizeOfBigQueue datapoint. |
| LogicMonitor_Portal_Alerts LogicMonitor_Portal_Collectors LogicMonitor_Portal_DataSources LogicMonitor_Portal_Overview LogicMonitor_Portal_Resources LogicMonitor_Portal_Users LogicMonitor_Portal_Websites |
(7 DataSources) Fixed incorrect aggregation method and consolidation function on various graphs.
Removed alerts graphs from LogicMonitor_Portal_Overview due to API bug causing invalid data to be returned. Datapoints were not removed so historical data will not be affected. |
| Microsoft_SQLServer_Databases | (DataSource) Fixed integer overflow bug that occurred when using the SUM() statement. |
| Netscaler_lb_vip- | (DataSource) Added multiple DP’s that track health, vserver hits/misses/spillovers, and SYN floods. Moved the ServicesDown alert to a new CDP called AlertingServicesDown which only alerts about downed services if the vServer is in an up state, there is another alert that alerts on non-optimal states and this avoids double alerting. Removed the ServicesUp alert since there are plenty of valid configurations where the user might have a single backend service.
Note: A new addCategory_NetscalersActive PropertySource was added to this monitoring package. |
| Networking_L2_snmpSwitch | (TopologySource) Parse out MAC address from HP Switch CDP ID. Account for MAC addresses delimited with “-” instead of “:” |
| PaloAlto_FW_BGP | (DataSource) Updated to ensure that wildvalues are properly sanitized. |
| PaloAlto_L2_HA | (TopologySource) Fixed active-passive mapping for PaloAlto High Availability pairs. |
| VMware_vCenter_DatastoreCapacity | (DataSource) Improved script performance by caching the datastore summary. Reduced incorrectly set timeout of 10000 seconds to 30 seconds. |
Deprecated LogicModules
LogicMonitor deprecates LogicModules when we have published a replacement LogicModule that provides superior access to the monitored technology (for example, supports more versions of the technology or provides improved scalability).
However, there may be times when a LogicModule is deprecated with no replacement (for example, when a technology becomes defunct or security issues beyond LogicMonitor’s control arise).
| LogicModule Deprecated/Replacement | Reason | End of Support Date |
LogicModules Deprecated in v.149 |
||
| Deprecated: snmpIf- snmp64_If- Replacement: SNMP_Network_Interfaces |
(2 DataSources) All the functionality of these now-deprecated DataSources is present in the SNMP_Network_Interfaces DataSource, along with significant enhancements including additional datapoints, scripted data collection for improved performance, instance-level properties that provide for additional filtering capabilities, and more precise alerting to eliminate alert storms caused by the old DataSources. | 2021-03-19 |
| Deprecated: Postfix- PostfixStatsProcess- Replacement: N/A |
(2 DataSources) Postfix no longer provides the data requested by the modules. | 2021-05-24 |
LogicModules Previously Deprecated (over past five versions) |
||
| Deprecated: Cisco_vManage_ApplicationAwareRoutingStats Replacement: N/A |
(DataSource) This DataSource was creating excessive instances, resulting in degraded Collector performance. | 2021-05-05 |
| Deprecated: CiscoASAcpu- CiscoCPU_old- Replacement: Cisco_CPU_Usage |
(2 DataSources) Released in v.145, Cisco_CPU_Usage performs the same functions as these deprecated DataSources in a more efficient manner. | 2021-03-08 |
| Deprecated: H3C_System_Fans H3C_System_ModulePerformance H3C_System_Power H3C_System_TemperatureSensors Replacement: H3C_Switch_Fans H3C_Switch_ModulePerformance H3C_Switch_Power H3C_Switch_TemperatureSensors |
(4 DataSources) The replacement DataSources use scripted Active Discovery to ensure unique instance naming, a known issue with the now-deprecated DataSources. | 2021-03-08 |
| Deprecated: Microsoft_FailoverCluster_Resources Replacement: N/A |
(DataSource) Development DataSource that was inadvertently published. | Immediate |
| Deprecated: NetscalerGSLBDomains- Replacement: Netscaler_GSLB_Domains |
(DataSource) The now-legacy DataSource produced indecipherable instance names. The replacement DataSource remedies this as well as features new overview graphs and datapoint descriptions.. | 2021-03-08 |
| Deprecated: Unomaly Anomalies Frequency Spikes Unomaly Known Events Unomaly New Anomalies Replacement: New LM Logs feature, released in fourth quarter of 2020. |
(3 EventSources) Functionality has been fully replaced by LogicMonitor’s new LM Logs feature. | 2021-02-17 |
| Deprecated: VMware_VeloCloud_SystemStats Replacement: N/A |
(1 DataSource) It has been determined that all data gathered by this DataSource is being reported more robustly through the existing NetSNMPCPUwithCores and NetSNMP_Memory_Usage DataSources, making it redundant and unnecessary. | 2021-02-09 |
| Deprecated: snmpFreeBSDDisk- Replacement: FreeBSD_Filesystem_Usage |
(1 deprecated DataSource) Enhancements featured by replacement include an updated AppliesTo statement that includes OpenBSD systems; updated filters to exclude /proc and /dev and allow discovery of files between 0-100 bytes on filesystems; new complex datapoints; and support for drives over 8 TB and block sizes other than 4 K. | 2021-01-19 |
| Deprecated: Windows_Cluster_ResourceState Windows_Cluster_NodeState Windows_Cluster_DiskPartitions WinClusterResources- WinClusterResourceGroup- WinClusterNodes- WinClusterGroupToNode- Replacement: Microsoft_FailoverCluster_Resources Microsoft_Windows_Cluster_NodeStatus Microsoft_Windows_Cluster_Disks Microsoft_Windows_Cluster_Resources Microsoft_Windows_Cluster_ResourceGroups Microsoft_Windows_Cluster_Nodes |
(7 deprecated DataSources) The replacement DataSources apply to the cluster VNN rather than each node individually, significantly reducing the incidence of duplicate alerts.
Note: The six replacement DataSources listed here are part of a bigger monitoring package for Microsoft Windows Failover Clusters that was released in v.146. |
2021-01-19 |
| Deprecated: CiscoCPU- Replacement: Cisco_CPU_Usage |
(1 DataSource) Converted to a scripted DataSource and uses an additional OID to resolve duplicate wildvalues. | 2021-01-04 |
| Deprecated: Liebert Power lines Liebert Temperature probes- Liebert UPS Temperature probes- Replacement: Liebert_Power_Lines Liebert_System_Temperature |
(3 DataSources) Rewrote DataSources as scripted SNMP; merged monitoring of temperature and UPS temperature probes into a single DataSource; added new power and voltage metrics for power lines monitoring; fixed an incorrect filter for power lines. | 2021-01-04 |
| Deprecated: LogicMonitor_Portal_Metrics Replacement: LogicMonitor_Portal_Alerts LogicMonitor_Portal_Collectors LogicMonitor_Portal_Resources LogicMonitor_Portal_Users LogicMonitor_Portal_Websites |
(1 DataSource) LogicMonitor released five new DataSources that provide 15 additional datapoints and group related metrics into separate DataSources, making it easier to hone in on specific aspects of your portal. For more information, see LogicMonitor Portal Monitoring. | 2021-01-04 |
| Deprecated: F5_BigIP_PoolMemberStatistics Replacement: F5_BigIP_PoolMemberStats |
(1 DataSource) Active Discovery and data collection methods were converted from SNMP to script to improve overall efficiency. | 2020-12-07 |
| Deprecated: Veeam_BackupAndReplication_Jobs_VMWareSureBackups Replacement: Veeam_BackupAndReplication_Jobs_SureBackups |
(1 DataSource) “VMware” was removed from the DataSource name as the backups are not VMWare specific. | 2020-12-07 |
Note: When importing a replacement LogicModule, you will not experience any immediate data loss due to the name variation that LogicMonitor expressly adds. However, there will be a diversion in data collection between the deprecated and new LogicModule, and you will potentially collect duplicate data and receive duplicate alerts for as long as both LogicModules are active. For this reason, we recommend that you disable monitoring of the DataSource instances at the resource or resource group level after you have imported its replacement. When DataSource monitoring is disabled in this way, it stops querying the host and generating alerts, but maintains all historical data. At some point in time, you may want to delete the legacy DataSource altogether, but consider this move carefully as all historical data will be lost upon deletion. For more information on disabling DataSource monitoring, see Disabling Monitoring for a DataSource or Instance.
Entering Beta
Alert Grouping with New Header Graph on Alerts Page
Recently released as a beta feature in v.148 for all Enterprise and Enterprise MSP customer accounts, the Alerts page incorporates a brand new time-series header graph that provides immediate visual insight into an alert storm or other event requiring investigation.
Beta for this new header graph will continue in v.149 as we make performance improvements and align the graph filters with the Alerts page filters.
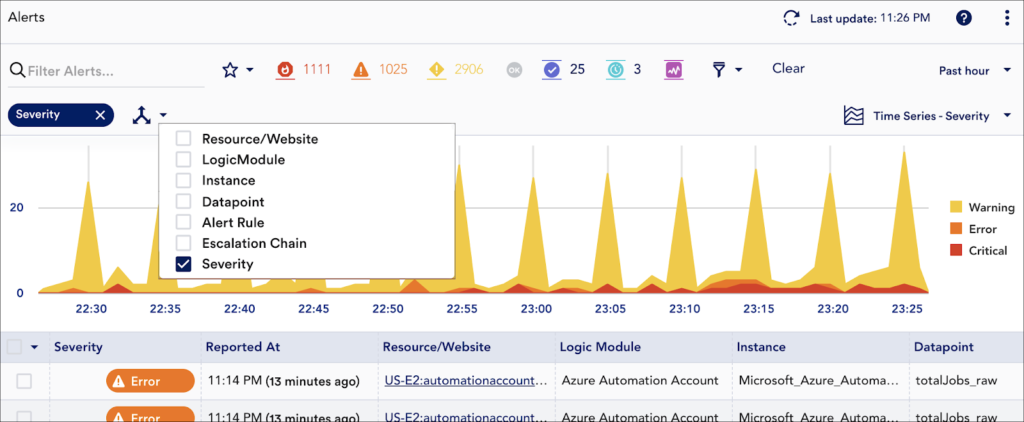
For more information on using this new alert header graph, see Managing Alerts from the Alerts Page.
Push Metrics API
LogicMonitor is developing a Push Metric API in order to allow metrics to be sent directly to LogicMonitor without the use of a Collector.
The first phase of the beta, which consists of a REST API that features endpoints for metric ingestion, has been ongoing since early January. The second phase of the beta, which we opened up in early February and includes the addition of a Python SDK, is continuing as well.
If you are interested in participating in the first phase and would like to expand your testing to include the new Python SDK, see the Push Metrics API Solution guide. If you are not currently participating in the first phase, please complete the Customer Beta survey and use the comments section to indicate your interest in participating in testing for the Push Metrics API Python SDK.
Looking ahead: Sunset of RPC API
We have decided to focus on improving the LogicMonitor REST API, which has higher security standards and integration capabilities more in-line with our future development goals. This means that we are preparing to end support for the RPC API after this summer. If you are using the RPC API for Ansible, reach out to Support for guidance on migrating playbooks to the REST API.
